1 Introduction
Multiple cylindrical structures are frequently involved in engineering applications, such as risers, undersea pipelines, tubes in heat exchangers and nuclear power plants, cables of cable-stayed bridges, groups of chimney stacks, transmission line bundles, masts and chemical reaction towers. A system of two tandem circular cylinders is an excellent model to understand the fluid–structure interactions involved in multiple structures. Most previous investigations have been performed on two fixed-supported rigid circular cylinders, focusing on the flow structure (Lin, Yang & Rockwell Reference Lin, Yang and Rockwell2002; Jester & Kallinderis Reference Jester and Kallinderis2003; Zhou & Yiu Reference Zhou and Yiu2006; Carmo, Meneghini & Sherwin Reference Carmo, Meneghini and Sherwin2010), fluid forces (Arie et al.
Reference Arie, Kiya, Moriya and Mori1983; Ljungkrona, Norberg & Sunden Reference Ljungkrona, Norberg and Sunden1991; Alam et al.
Reference Alam, Moriya, Takai and Sakamoto2003; Alam Reference Alam2016) and Strouhal numbers (
 $St$
) (Igarashi Reference Igarashi1981; Igarashi Reference Igarashi1984; Xu & Zhou Reference Xu and Zhou2004; Alam & Sakamoto Reference Alam and Sakamoto2005; Zhou et al.
Reference Zhou, Feng, Alam and Bai2009). See recent compendiums by Sumner (Reference Sumner2010) and Zhou & Alam (Reference Zhou and Alam2016) for more details. However, engineering structures are, strictly speaking, not rigid; as a matter of fact, they are elastically mounted and can be associated with violent vibrations.
There have been a number of studies on the flow-induced vibration (FIV) of an elastically mounted cylinder in the presence of an upstream fixed cylinder (e.g. Bokaian & Geoola Reference Bokaian and Geoola1984a
; Brika & Laneville Reference Brika and Laneville1999; Carmo et al.
Reference Carmo, Sherwin, Bearman and Willden2011; Hover & Triantafyllou Reference Hover and Triantafyllou2001; Assi et al.
Reference Assi, Meneghini, Aranha, Bearman and Casaprima2006; Assi, Bearman & Meneghini Reference Assi, Bearman and Meneghini2010; Assi et al.
Reference Assi, Bearman, Carmo, Meneghini, Sherwin and Willden2013; Qin, Alam & Zhou Reference Qin, Alam and Zhou2017). Bokaian & Geoola (Reference Bokaian and Geoola1984a
) investigated the FIV of a cylinder placed in the wake of another, with the downstream cylinder being spring-mounted at both ends and free to vibrate transversely. The system had a mass-damping ratio
 $m^{\ast }\unicode[STIX]{x1D701}$
of 0.109, where
 $m^{\ast }$
is the mass ratio and
 $\unicode[STIX]{x1D701}$
is the damping ratio. In this paper, asterisks denote normalization by the displaced fluid mass
 $m_{f}$
and/or
 $D$
. Four distinct dynamic responses are identified, depending on the cylinder centre-to-centre spacing ratio
 $L/D$
: galloping only
 $(L/D=1.09)$
, vortex excitation (VE) only
 $(L/D>3)$
, separated vortex excitation and galloping
 $(2<L/D<3)$
, and combined VE and galloping
 $(L/D=1.5)$
. The VE case refers to the occurrence of strong vibrations where the natural vortex shedding frequency
 $f_{v}$
coincides with the natural frequency
 $f_{n}$
of the fluid–cylinder system and they are locked with each other. The galloping case is characterized by a higher reduced velocity
 $U_{r}$
(
 $=U_{\infty }/f_{n}D$
, where
 $U_{\infty }$
is the free-stream velocity) than that at which the VE occurs, which is also referred to as wake galloping for a two-tandem-cylinder system (Cooper & Wardlaw Reference Cooper and Wardlaw1971). Assi et al. (Reference Assi, Bearman and Meneghini2010) focused on the downstream cylinder vibration
 $(m^{\ast }\unicode[STIX]{x1D701}=0.018)$
for
 $L/D=4{-}6$
, where the upstream cylinder generated vortices in the gap between the cylinders. A divergent galloping vibration was observed, with the vibration amplitude increasing with
 $U_{r}$
. Assi et al. (Reference Assi, Bearman, Carmo, Meneghini, Sherwin and Willden2013) introduced wake stiffness and analysed the origin of the lift forces on the downstream cylinder. Brika & Laneville (Reference Brika and Laneville1997) and Laneville & Brika (Reference Laneville and Brika1999) examined the response of the downstream cylinder with the upstream cylinder stationary or vibrating for
 $L/D=7{-}25$
,
 $U_{r}=4{-}25$
and
 $m^{\ast }\unicode[STIX]{x1D701}=0.00007$
, and found a strong dependence of the downstream cylinder vibration on
 $L/D$
given a freely vibrating upstream cylinder. The maximum vibration amplitude and the synchronization region decreased with increasing
 $L/D$
.
Flow physics and fluid–structure coupling between two vibrating elastically mounted cylinders are much more complicated than that where only one of the two cylinders is allowed to vibrate (e.g. Zhou et al.
Reference Zhou, Wang, So, Xu and Jin2001). King & Johns (Reference King and Johns1976) performed experiments in a water tunnel on the free vibration of the two cylinders in two degrees of freedom (
 $L/D=1.25{-}7.0$
,
 $m^{\ast }\unicode[STIX]{x1D701}=0.051$
). At
 $L/D=5.5$
, the upstream cylinder response exhibited a typical VE feature. On the other hand, the downstream cylinder vibration amplitude
 $A^{\ast }\,(=A/D)$
increased to 0.52 for
 $U_{r}=5.0{-}7.2$
and then remained almost unchanged for a further increase in
 $U_{r}$
up to 12.5. Zdravkovich (Reference Zdravkovich1985) performed a study of two-cylinder vibrations with
 $m^{\ast }\unicode[STIX]{x1D701}=50$
for
 $L/D=4$
. The vibration started at
 $U_{r}\approx 50$
, reaching
 $A^{\ast }=1.7$
at
 $U_{r}=80$
. Kim et al. (Reference Kim, Alam, Sakamoto and Zhou2009) performed wind tunnel experiments on two tandem cylinders
 $(m^{\ast }\unicode[STIX]{x1D701}=0.65)$
, both free to vibrate laterally for
 $L/D=1.1{-}4.2$
and
 $U_{r}=1.5{-}26$
. They observed different responses at different
 $L/D$
. No cylinder vibrated at
 $1.1\leqslant L/D<1.2$
and
 $3.0\leqslant L/D<3.7$
. Both cylinders vibrated violently at
 $1.2\leqslant L/D<1.6$
, where combined VE and galloping occurred. At
 $1.6\leqslant L/D<3.0$
, VE was observed for both cylinders at
 $U_{r}$
smaller than that for a single isolated cylinder. At
 $L/D\geqslant 3.7$
, each cylinder vibrated like an isolated cylinder. However, they did not examine systematically the vortex shedding frequency, flow structure and wake evolution; thus, the understanding of the fluid–structure interaction behind the observations was rather limited.
Huera-Huarte & Bearman (Reference Huera-Huarte and Bearman2011) conducted experiments on FIV of two tandem cylinders for
 $L/D=2.0{-}4.0$
at
 $m^{\ast }\unicode[STIX]{x1D701}=0.043$
. The upstream cylinder experienced a larger vortex-excited vibration than the downstream cylinder for
 $L/D=2{-}2.5$
at
 $U_{r}=4{-}9$
, where the shedding frequency was close to the cylinder natural frequency. At
 $L/D=3.0{-}4.0$
, the downstream cylinder displayed the feature of galloping vibrations at
 $U_{r}>9$
. Huera-Huarte & Gharib (Reference Huera-Huarte and Gharib2011) further extended
 $L/D$
to 4.0–8.0 and confirmed that the downstream cylinder experienced a large-amplitude vibration at
 $U_{r}$
beyond the classical lock-in region, whereas the upstream cylinder underwent a classical VE response similar to a single isolated cylinder. The large-amplitude vibration was attributed to vortices in the gap between the two cylinders.
Apart from experimental investigations, there have been a number of numerical studies on the FIV of two elastically mounted tandem cylinders. Mittal & Kumar (Reference Mittal and Kumar2001) carried out two-dimensional simulations for two elastically mounted cylinders in two degrees of freedom at
 $U_{r}=4.3$
and 6.0 (Reynolds number
 $Re=100$
,
 $L/D=5.5$
and
 $m^{\ast }\unicode[STIX]{x1D701}=0.000495$
). At
 $U_{r}=4.3$
, the upstream cylinder behaved like a single vibrating cylinder, while the downstream cylinder exhibited oscillations of very small amplitude in both directions. At
 $U_{r}=6.0$
, the vibration response of the upstream cylinder resembles that at
 $U_{r}=4.3$
, and the downstream cylinder was characterized by a significantly larger vibrating amplitude in the transverse direction than in the longitudinal direction. Prasanth & Mittal (Reference Prasanth and Mittal2009a
,Reference Prasanth and Mittal
b
) investigated the FIV of two tandem cylinders at
 $Re=100$
for
 $L/D=5.5$
,
 $m^{\ast }=10$
and
 $\unicode[STIX]{x1D701}=0$
, with
 $U_{r}=2{-}15$
. Again, the response of the upstream cylinder was found to be qualitatively the same as that of an isolated cylinder for
 $U_{r}=4.0{-}8.3$
. The downstream cylinder underwent a strong oscillation in the VE regime, its maximum amplitude (
 $A^{\ast }=1.1$
) being twice that of an isolated cylinder. For the higher
 $U_{r}\,(=8.3{-}15)$
,
 $A^{\ast }$
remained large, between 0.3 and 0.8. Papaioannou et al. (Reference Papaioannou, Yue, Triantafyllou and Karniadakis2008) numerically studied the influence of
 $L/D$
on the FIV of two tandem cylinders at
 $Re=160$
and
 $m^{\ast }\unicode[STIX]{x1D701}=0.127$
. Three
 $L/D=2.5$
, 3.5 and 5 were examined. The VE range of the upstream cylinder was dependent on
 $L/D$
, larger at a smaller
 $L/D$
, shifting towards higher values of
 $U_{r}$
than those for a single cylinder. Borazjani & Sotiropoulos (Reference Borazjani and Sotiropoulos2009) conducted two- and three-dimensional numerical simulations to investigate the FIV of tandem cylinders with one and two degrees of freedom (
 $Re=200$
,
 $L/D=1.5$
,
 $m^{\ast }=2.6$
and
 $\unicode[STIX]{x1D701}=0$
). Two flow states were identified. State 1 corresponded to small
 $U_{r}$
(
 ${\leqslant}$
4), where the vibration amplitude of the upstream cylinder was greater than that of the downstream cylinder, while state 2 involved large
 $U_{r}$
(
 ${\gtrsim}$
7) when the vibration characteristics of the two cylinders were opposite to their counterparts at state 1. At state 1, the vortices shed from the upstream cylinder disrupted vortex shedding from the downstream cylinder, thus reducing the vibration amplitude of this cylinder. At state 2, the gap flow increased the asymmetry of the pressure field around the rear cylinder. The transition between the two states
 $(4<U_{r}\lesssim 7)$
was referred to as a ‘critical’ mode. Griffith et al. (Reference Griffith, Jacono, Sheridan and Leontini2017) found this ‘critical’ mode to be distinct from states 1 and 2, occurring when a vortex shedding mode with some quasi-periodicity is discernible in the wake rather than a transition mode. The FIV of two elastically mounted tandem cylinders subjected to planar shear flow were studied numerically at
 $Re=160$
,
 $m^{\ast }=10$
and
 $\unicode[STIX]{x1D701}=0$
by Tu et al. (Reference Tu, Zhou, Bao, Ma, Lu and Han2015). Four
 $L/D=2.5$
, 3.5, 4.5 and 8.0 were investigated. The shear rate was found to play an important role in the FIVs of both cylinders at various
 $L/D$
.
Despite the great progress made in the previous investigations, our understanding has yet to be greatly improved on the fluid–structure interactions involved in free vibrations on two elastically mounted cylinders in crossflow. Many issues remain to be resolved. For example, how does the initial state of a cylinder affect the vibration of the other? Under what conditions does the vibration amplitude of a cylinder greatly exceed that of the other? How are the vibrations of the cylinders sustained? Is there any difference in the characteristics of vortices originating from different cylinders? How do they contribute to the work done on the cylinders? This work aims to address the above issues. A systematic experimental study is conducted on the fluid–structure interactions of two tandem cylinders that are free to vibrate laterally. The ranges of
 $L/D$
and
 $U_{r}$
examined are 1.2–6.0 and 3.8–47.8, respectively. The structural responses of both cylinders and the flow structures between and behind the cylinders are simultaneously captured using time-resolved particle imaging velocimetry (PIV), hotwire, laser vibrometer and pressure scanner techniques. Experimental details are given in § 2. The results and discussions are presented in § 3 through § 8. The work is concluded in § 9.
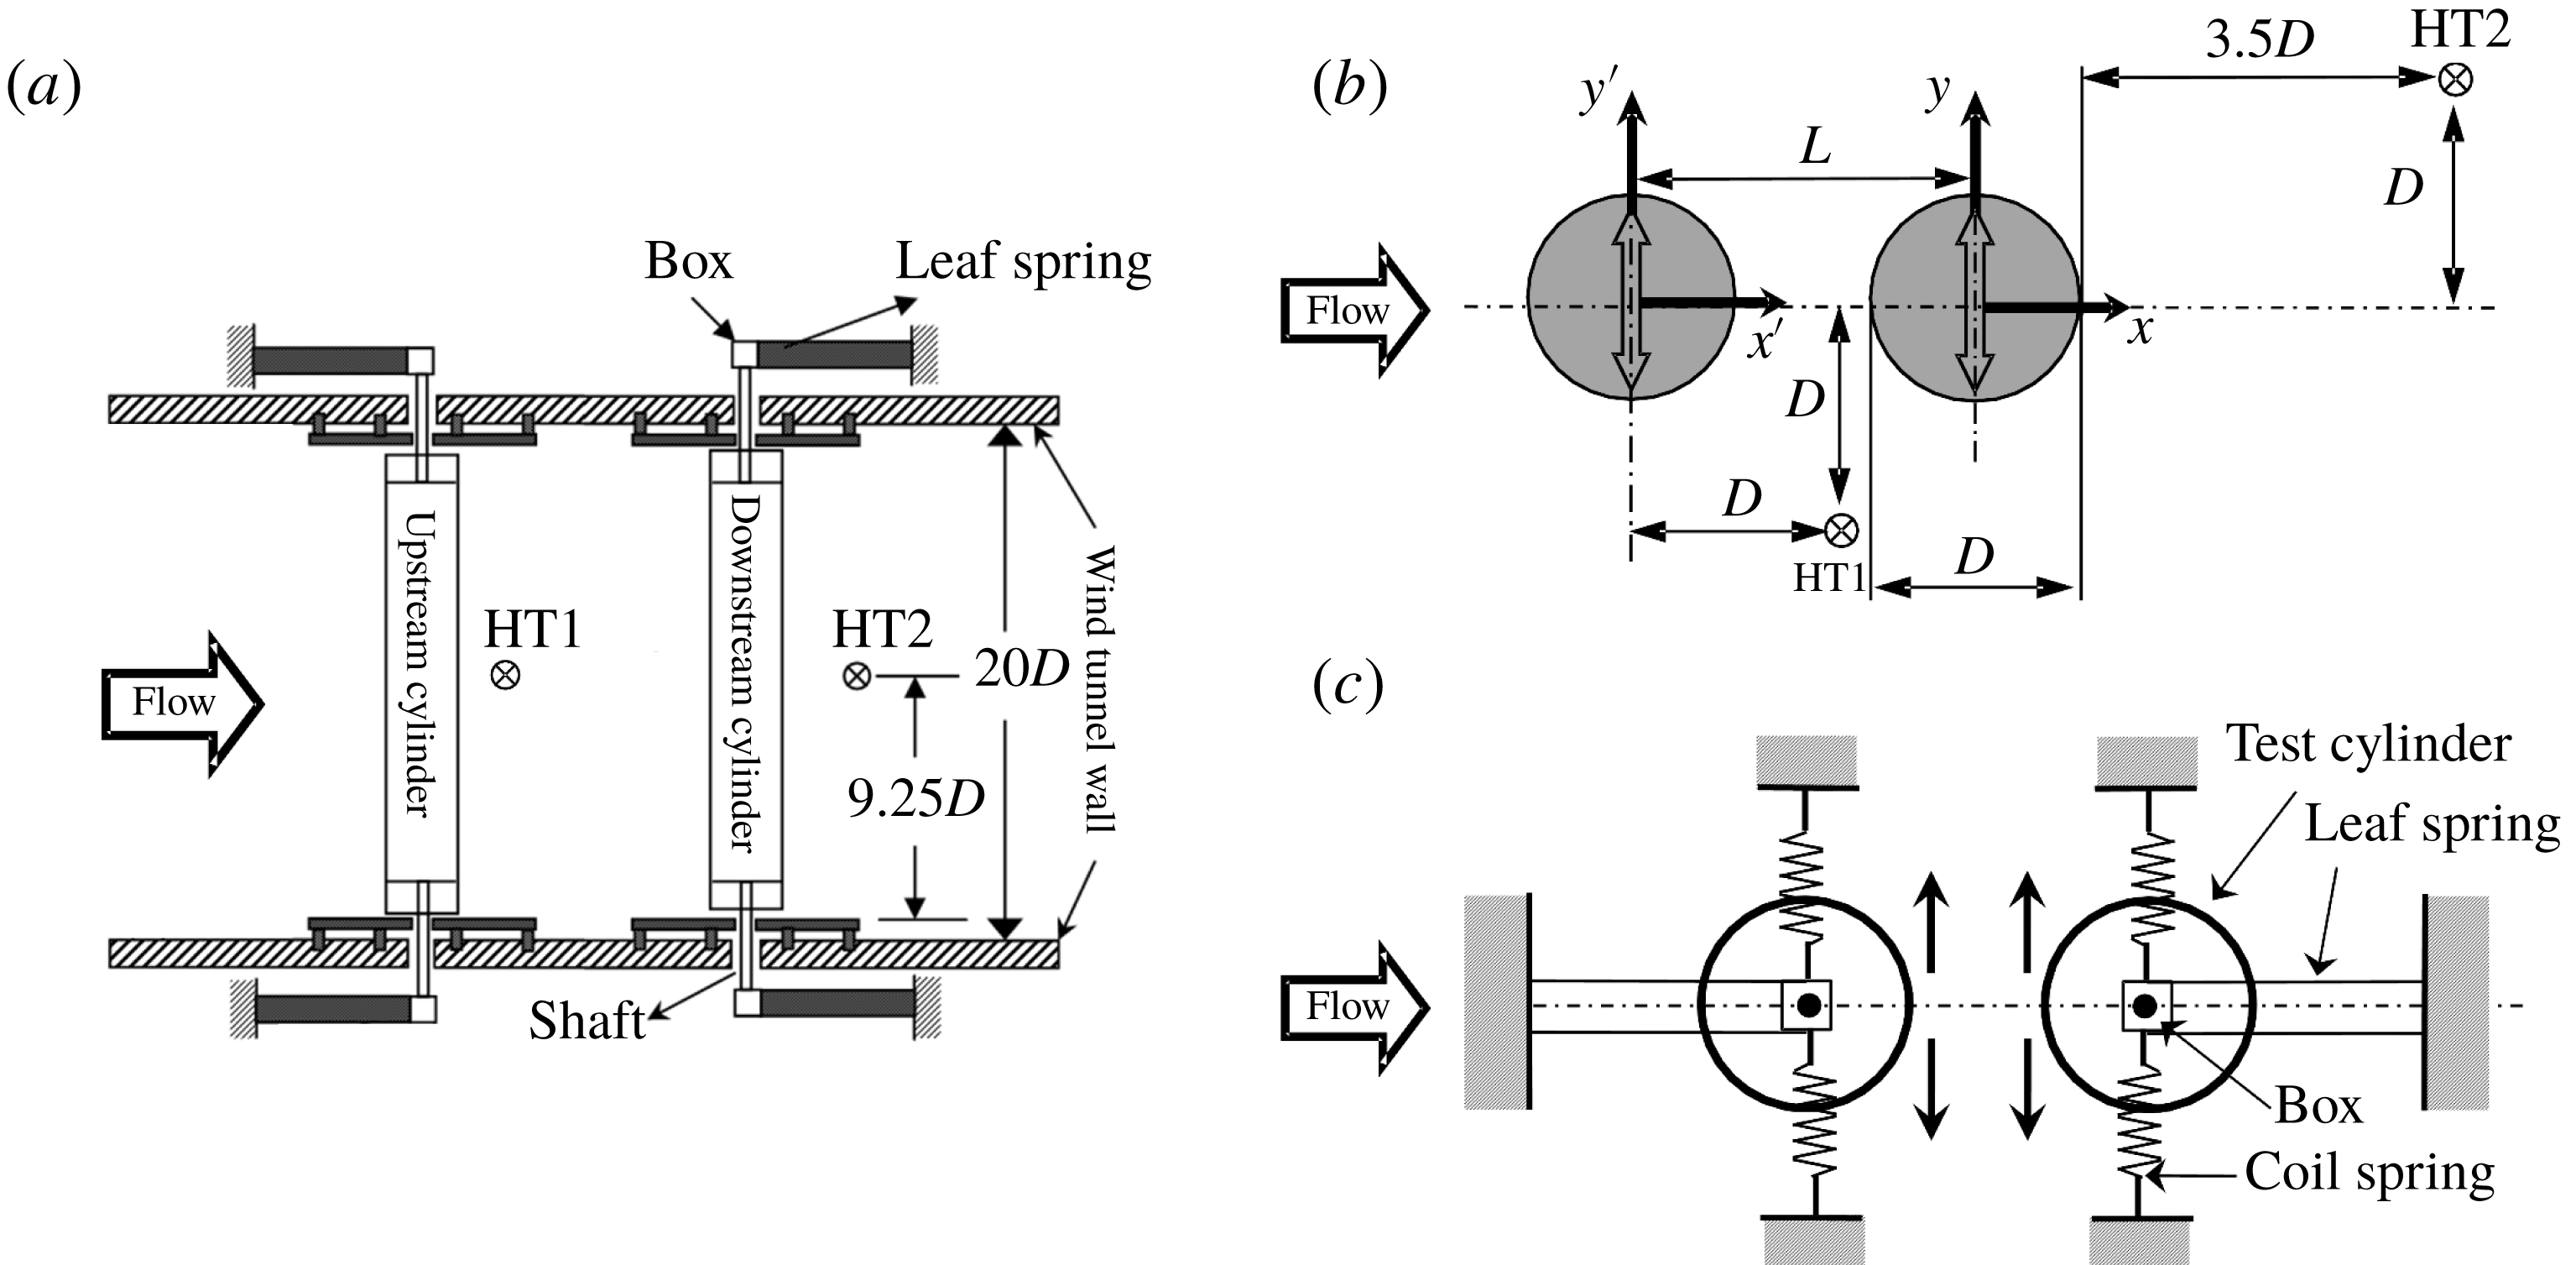
(a) Experimental setup. (b) Definitions of symbols. (c) Cylinder support system.

2 Experimental setup
Experiments were performed in a low-speed, closed-circuit wind tunnel with a test section of 5.6 m in length, 0.8 m in width and 1.0 m in height. The two cylinders were mounted in tandem in the horizontal midplane of the test section. Figure 1 shows a schematic of the experimental setup, definitions of symbols, and coordinates
 $(x^{\prime },y^{\prime },z^{\prime })$
and
 $(x,y,z)$
, with the origins defined at the upstream and downstream cylinder centres at midspan, respectively. Both cylinders are hollow, made of Plexiglass, with outer diameter
 $D=40~\text{mm}$
, inner diameter 36 mm, and length
 $l=740~\text{mm}$
. The mass ratio
 $m^{\ast }=m/m_{f}=4m/(\unicode[STIX]{x03C0}\unicode[STIX]{x1D70C}D^{2}l)$
is 275, where
 $m$
is the total vibrating mass,
 $m_{f}$
is the mass of fluid displaced by the cylinder and
 $\unicode[STIX]{x1D70C}$
is the density of the fluid. The cylinder centre-to-centre spacing ratios
 $L/D$
examined are 1.2, 1.5, 2.0, 2.5, 3.0 and 6.0. The blockage is approximately 3.7 %, and the aspect ratio of the cylinders is
 $l/D=18.5$
. As shown in figure 1, each cylinder, mounted independently, is supported at its ends on two 1-mm-thick leaf springs made of brass and two coil springs made of steel, which are designed such that the cylinder may vibrate only laterally. End plates are fitted on both sides of each cylinder to avoid interference/complexities caused by the cylinder support. Each end plate is made of two rectangular slots of size
 $12~\text{mm}\times 80~\text{mm}$
to ensure an adequate clearance for the cylinder vibration. The upstream and downstream cylinder displacements
 $Y^{\prime }$
and
 $Y$
are measured using a laser vibrometer (OFV-505/5000, Polytec), which is capable of resolving a displacement of
 $0.05~\unicode[STIX]{x03BC}\text{m}$
. The cylinder vibration frequency is determined from the power spectral density function
 $E_{Y}$
(or
 $E_{Y^{\prime }}$
) of
 $Y$
(or
 $Y^{\prime }$
), calculated via a fast Fourier transform (FFT). The free-stream velocity
 $U_{\infty }$
is varied from 1.8 to
 $22.4~\text{m}~\text{s}^{-1}$
, corresponding to
 $U_{r}=3.8{-}47.8$
and
 $Re=4.8\times 10^{3}{-}6.0\times 10^{4}$
. The turbulent intensity for this range of velocity is less than 0.3 %.
In order to measure the structural system properties (i.e. damping ratio
 $\unicode[STIX]{x1D701}$
and natural frequency
 $f_{n}$
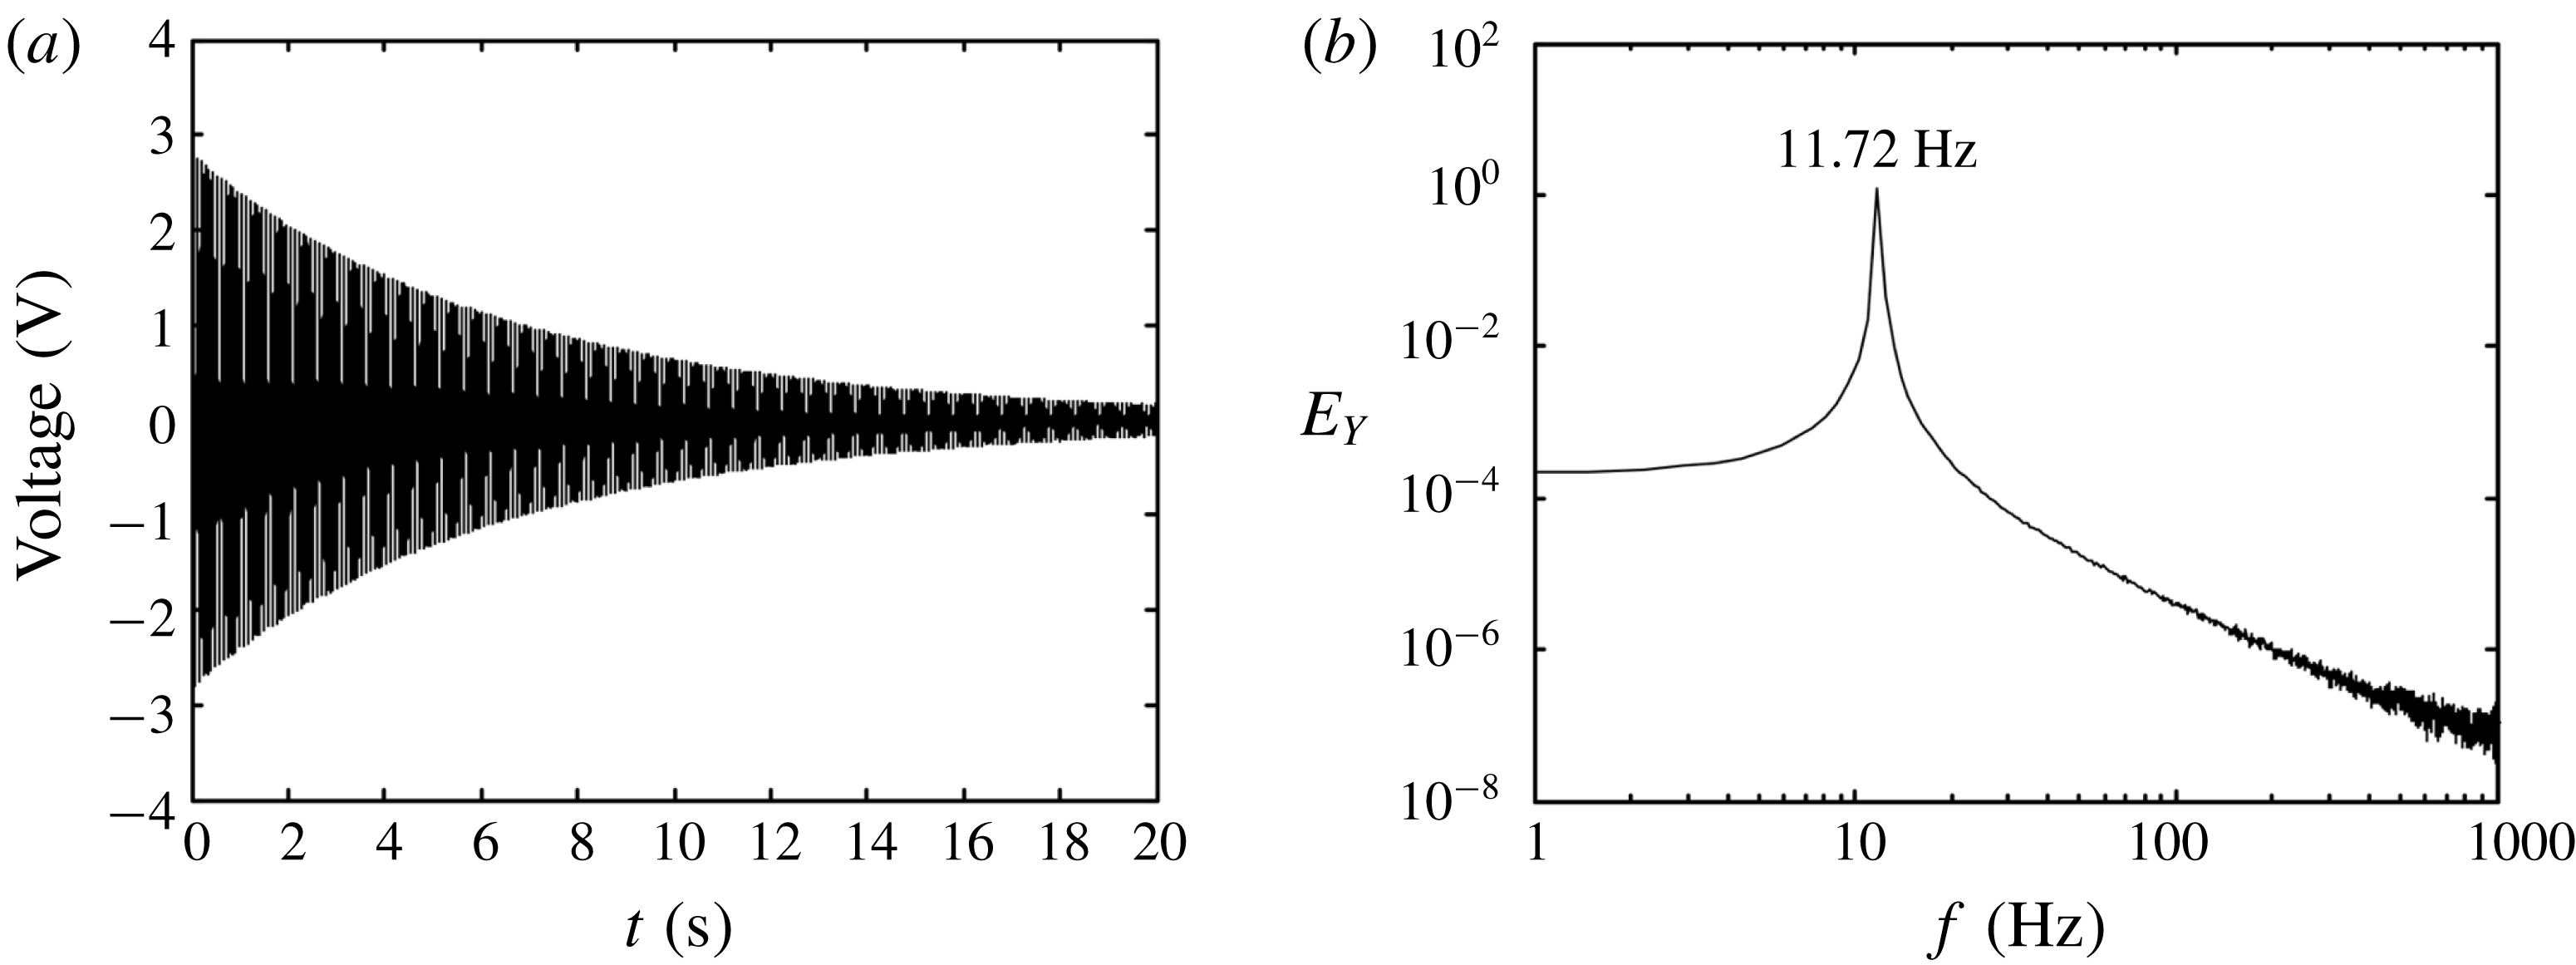
), the cylinder is given an initial displacement and then released to vibrate in still air (no flow) and a laser vibrometer is used to capture the time history of the structural vibration. Due to the structural damping, the vibration amplitude dampens with time (figure 2
a). The value of
 $f_{n}$
is determined to be 11.72 Hz from the power spectral density function of the displacement signal (figure 2
b), and the value of
 $\unicode[STIX]{x1D701}$
is estimated to be 0.0021 from the logarithmic decrement
 $\unicode[STIX]{x1D6FF}$
of the amplitude as
 $\unicode[STIX]{x1D701}=(\unicode[STIX]{x1D6FF}/2\unicode[STIX]{x03C0})/\sqrt{1+(\unicode[STIX]{x1D6FF}/2\unicode[STIX]{x03C0})^{2}}$
. Then,
 $m^{\ast }\unicode[STIX]{x1D701}$
is found to be 0.58. The flow-induced displacement signals
 $Y^{\prime }$
and
 $Y$
of the upstream and downstream cylinders, respectively, are measured simultaneously using two laser vibrometers, each with a resolution of
 $0.05~\unicode[STIX]{x03BC}\text{m}$
. The cylinder displacement amplitudes
 $A_{u}$
and
 $A_{d}$
are defined by
 $A_{u}=Y_{rms}^{\prime }\times \sqrt{2}$
and
 $A_{d}=Y_{rms}\times \sqrt{2}$
, where subscript rms denotes the root-mean-square value. The sampling time for the vibration response measurement was 20 s and the oscillation period
 $T\,(=1/f_{n})$
was approximately 0.0853 s. In these circumstances, each signal includes approximately 234 natural vibration periods. The uncertainty in the measurement of
 $A^{\ast }$
was less than 5 %.
(a) Signal from a laser vibrometer after a plucking excitation. (b) Power spectrum of the displacement signal.

The flow-induced vibration response is governed by the combined mass-damping ratio
 $m^{\ast }\unicode[STIX]{x1D701}$
, not by the individual values
 $m^{\ast }$
and
 $\unicode[STIX]{x1D701}$
(Govardhan & Williamson Reference Govardhan and Williamson2006). In wind tunnel experiments, it is not easy to obtain small
 $m^{\ast }$
. In an effort to make
 $m^{\ast }\unicode[STIX]{x1D701}$
as small as possible, we used hollow cylinders made of acrylic to achieve
 $m^{\ast }=275$
and
 $\unicode[STIX]{x1D701}=0.0021$
, yielding
 $m^{\ast }\unicode[STIX]{x1D701}=0.58$
. A value of
 $m^{\ast }\unicode[STIX]{x1D701}$
of the order of magnitude
 $-1$
is common in aeroelastic applications where the fluid is air (Feng Reference Feng1968; Brika & Laneville Reference Brika and Laneville1993) and may also appear in hydroelastic applications in water with small
 $m^{\ast }$
but large
 $\unicode[STIX]{x1D701}$
, giving a value of
 $m^{\ast }\unicode[STIX]{x1D701}$
with an order of magnitude less than
 $-2$
(Zhu, Lin & Yao Reference Zhu, Lin and Yao2016; Oviedo-Tolentino et al.
Reference Oviedo-Tolentino, Perez-Gutierrez, Romero-Mendez and Hernandez-Guerrero2014). The vibration amplitude is in general much smaller in the streamwise direction than in the transverse direction. Jauvtis & Williamson (Reference Jauvtis and Williamson2004) demonstrated that the streamwise vibration hardly influences the transverse vibration when
 $m^{\ast }>6$
. Note that the present
 $m^{\ast }=275$
and
 $m^{\ast }\unicode[STIX]{x1D701}=0.58$
. Therefore, only the transverse vibration is considered in order to understand its physics, without any contamination from the streamwise vibration (Assi et al.
Reference Assi, Bearman, Carmo, Meneghini, Sherwin and Willden2013).
Two hot wires are used to measure the streamwise fluctuating velocities
 $u_{1}$
and
 $u_{2}$
, one (HT1) placed at
 $(x^{\prime }D,y^{\prime }/D,z^{\prime }/D)=(1,-1,0)$
in the gap between the cylinders and the other (HT2) behind at
 $(x/D,y/D,z/D)=(4,1,0)$
. The hotwire signals are offset, low-pass-filtered, amplified, and then digitized using a 16-channel A/D board at a sampling frequency of 3 kHz. The sampling duration is 20 s for each record. The power spectral density functions
 $E_{u1}$
and
 $E_{u2}$
of
 $u_{1}$
and
 $u_{2}$
are calculated using a fast Fourier transform algorithm. The frequency resolution in the power spectra is approximately 0.7 Hz.
A Dantec high-speed 2D PIV system (Litron LDY304-PIV, Nd: YLF; the triggering rate is up to 727 Hz for the mode of double frames) is used to capture the flow in the (
 $x$
,
 $y$
) plane in the gap between the cylinders and behind. The cylinder surface is painted black to minimize the laser reflection noise. The flow is seeded by smoke particles, generated from paraffin oil using a TSI 9307-6 fog generator, with a particle size of approximately
 $1~\unicode[STIX]{x03BC}\text{m}$
in diameter. Flow illumination is provided by two pulsed laser sources of 527 nm wavelength, each with a maximum energy output of 30 mJ per pulse. One CCD camera (PhantomV641, double frames) is used to capture particle images with a resolution of
 $2560\times 1600~\text{pixels}$
. The laser pulse and image taking are synchronized via a Dantec timer box 80N77. A total of 1600 flow images are captured at a trigger rate of 300 Hz. The interrogation window is
 $32\times 32~\text{pixels}$
, with a 50 % overlap in each direction for image processing. A moving average validation is then performed and the averaging area consists of
 $3\times 3$
interrogation windows with an acceptance factor of 0.1.
The pressure around the cylinder surface was captured using a piezoresistive pressure scanner (Pressure Systems DTC Initium
 $+$
ESP-32HD) with a range of
 $\pm 2.5~\text{kPa}$
. Thirty pressure taps of 0.8 mm in diameter, all connected to the pressure scanner, were made and distributed on the surfaces of the two cylinders unevenly at
 $\unicode[STIX]{x1D703}=0$
,
 $22.5^{\circ }$
,
 $56.25^{\circ }$
,
 $67.5^{\circ }$
,
 $78.75^{\circ }$
,
 $90^{\circ }$
,
 $123.75^{\circ }$
,
 $157.5^{\circ }$
,
 $202.5^{\circ }$
,
 $236.25^{\circ }$
,
 $270^{\circ }$
,
 $281.25^{\circ }$
,
 $292.5^{\circ }$
,
 $303.75^{\circ }$
and
 $337.5^{\circ }$
. More pressure taps were made at
 $\unicode[STIX]{x1D703}=56.25^{\circ }{-}90^{\circ }$
and
 $270^{\circ }{-}303.75^{\circ }$
on the front surface where the reattachment of the gap shear layers may occur. The details of the pressure measurements can be found in Qin et al. (Reference Qin, Alam and Zhou2017). The phase-averaged pressure coefficient
 $\langle C_{P}\rangle$
is positive when directed to the cylinder centre, and a length of
 $D/2$
corresponds to
 $|\langle C_{P}\rangle |=1.0$
.
The pressure coefficient
 $C_{P}$
is calculated using
 $$\begin{eqnarray}C_{P}(t)=\frac{P(t)-P_{s}}{0.5\unicode[STIX]{x1D70C}U_{\infty }^{2}},\end{eqnarray}$$
where
 $P(t)$
is the cylinder surface pressure captured by a pressure scanner and
 $P_{s}$
is the static pressure measured at
 $(x,y,z)=(-600~\text{mm},300~\text{mm},0)$
by connecting a Pitot tube to the pressure scanner.
The time-dependent lift force coefficient (
 $C_{L}$
) on the cylinder is obtained by integrating the surface pressure,
 $$\begin{eqnarray}C_{L}(t)=-\frac{1}{2}\int _{0}^{2\unicode[STIX]{x03C0}}C_{P}(t)\sin \unicode[STIX]{x1D703}\,\text{d}\unicode[STIX]{x1D703},\end{eqnarray}$$
where
 $\unicode[STIX]{x1D703}$
is the azimuthal position of a pressure tap, measured in radians from the nominal leading stagnation point of the cylinder.
3 Characteristics of the free vibrations
The variations in
 $A^{\ast }$
and the shedding frequency ratios
 $f_{v}/f_{n}$
with
 $U_{r}$
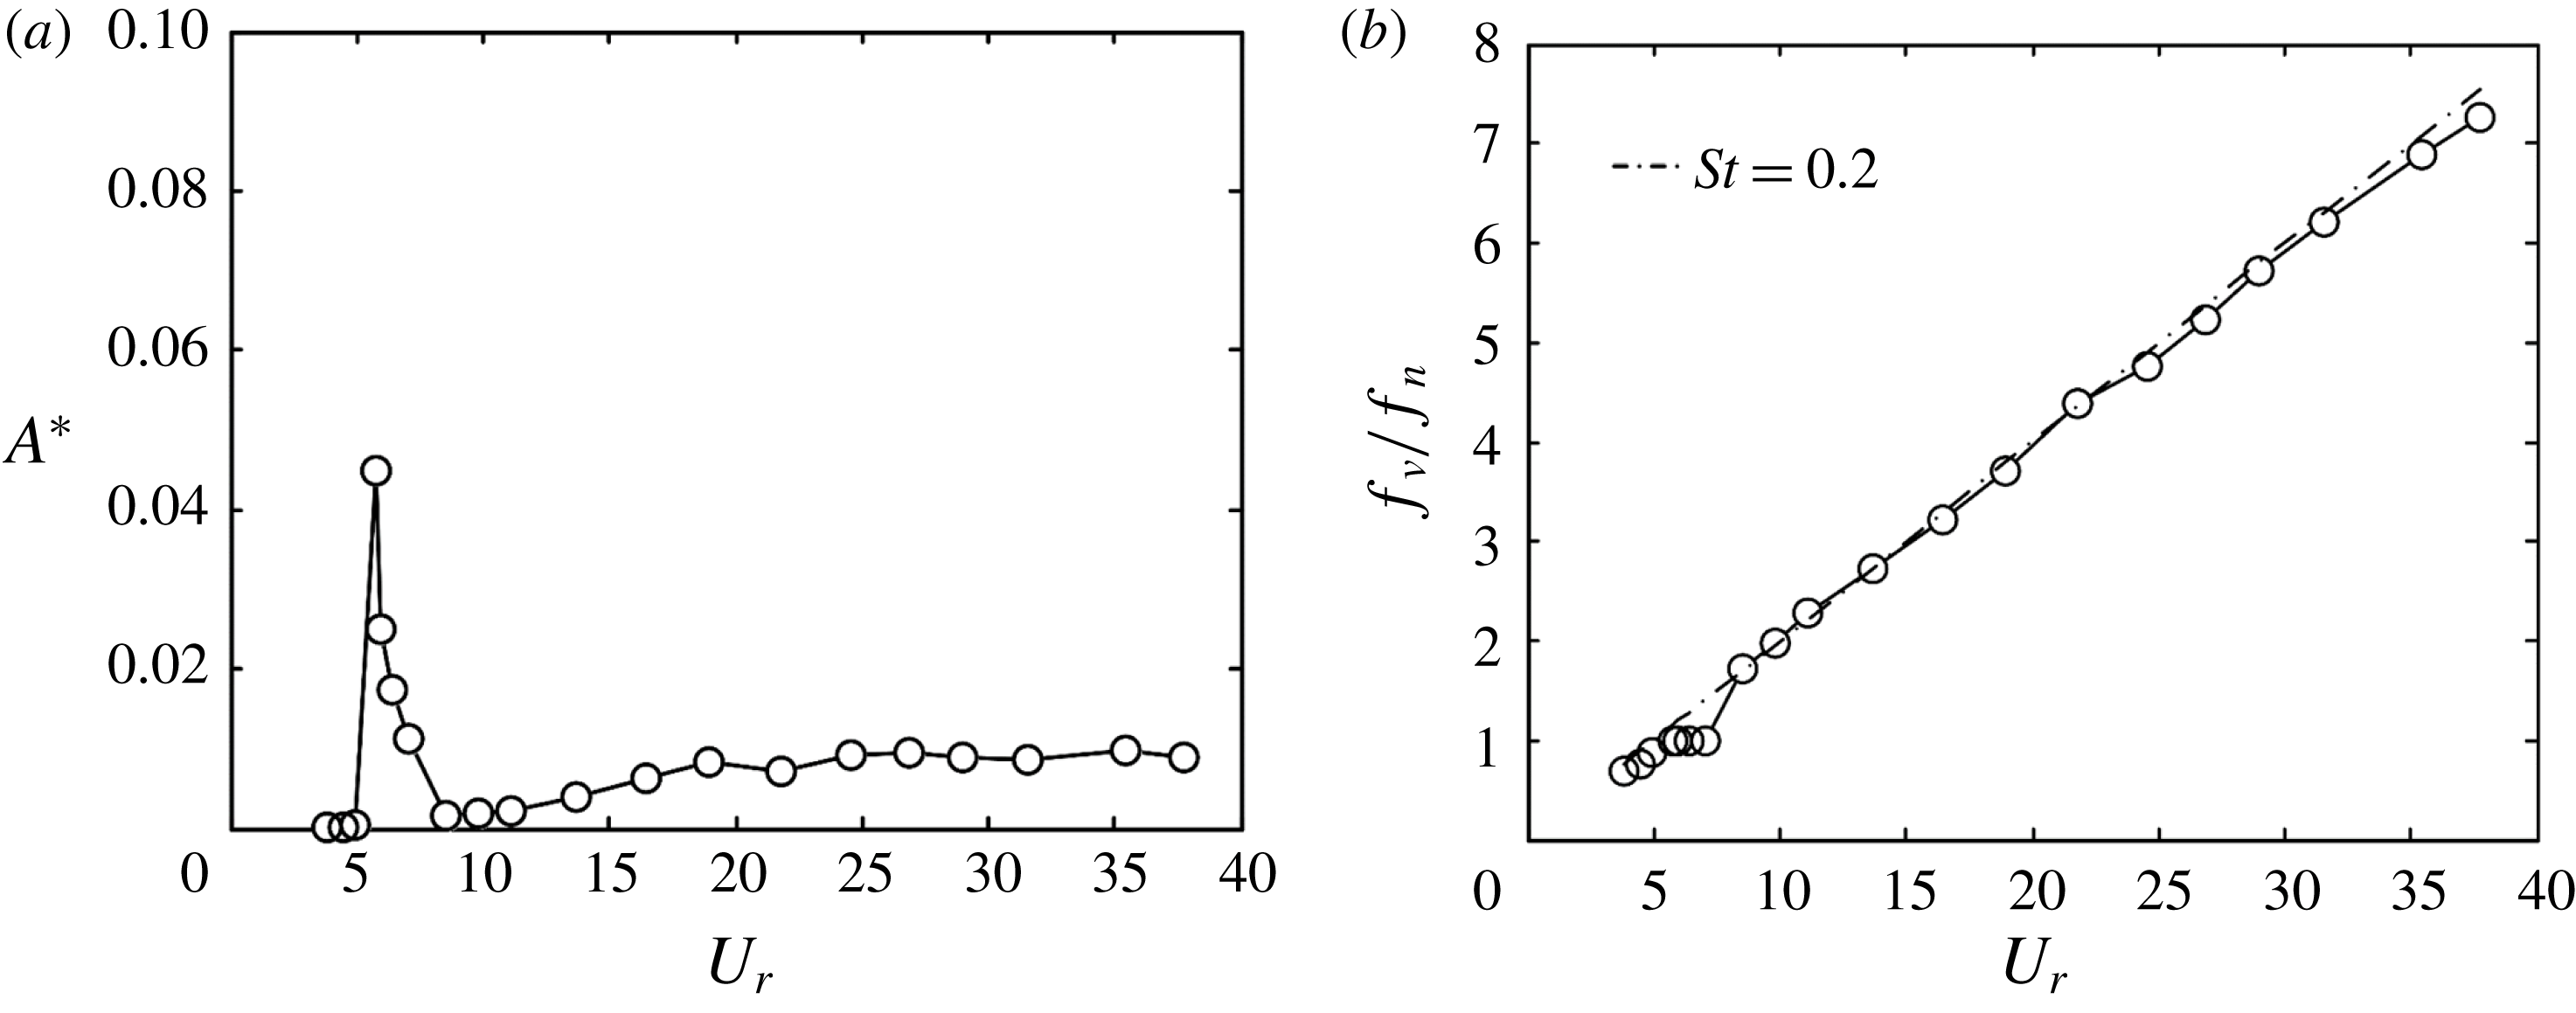
for a single circular cylinder are presented in figures 3(a) amd 3(b), respectively, to show the vibration characteristics of a single cylinder. Here
 $f_{v}$
was obtained from the power spectral density function of the streamwise velocity obtained at
 $(x/D,y/D,z/D)=(4,1,0)$
. The VE regime occurs at around
 $U_{r}=5.2{-}7.0$
, with
 $f_{v}/f_{n}=1$
(figure 3
b). After the VE regime
 $(U_{r}>7.0)$
, the vibration is small
 $(A^{\ast }<0.01)$
and
 $f_{v}/f_{n}$
follows
 $St\approx 0.2$
.
Variations in
 $A^{\ast }$
(a) and
 $f_{v}/f_{n}$
(b) with
 $U_{r}$
for a single cylinder.

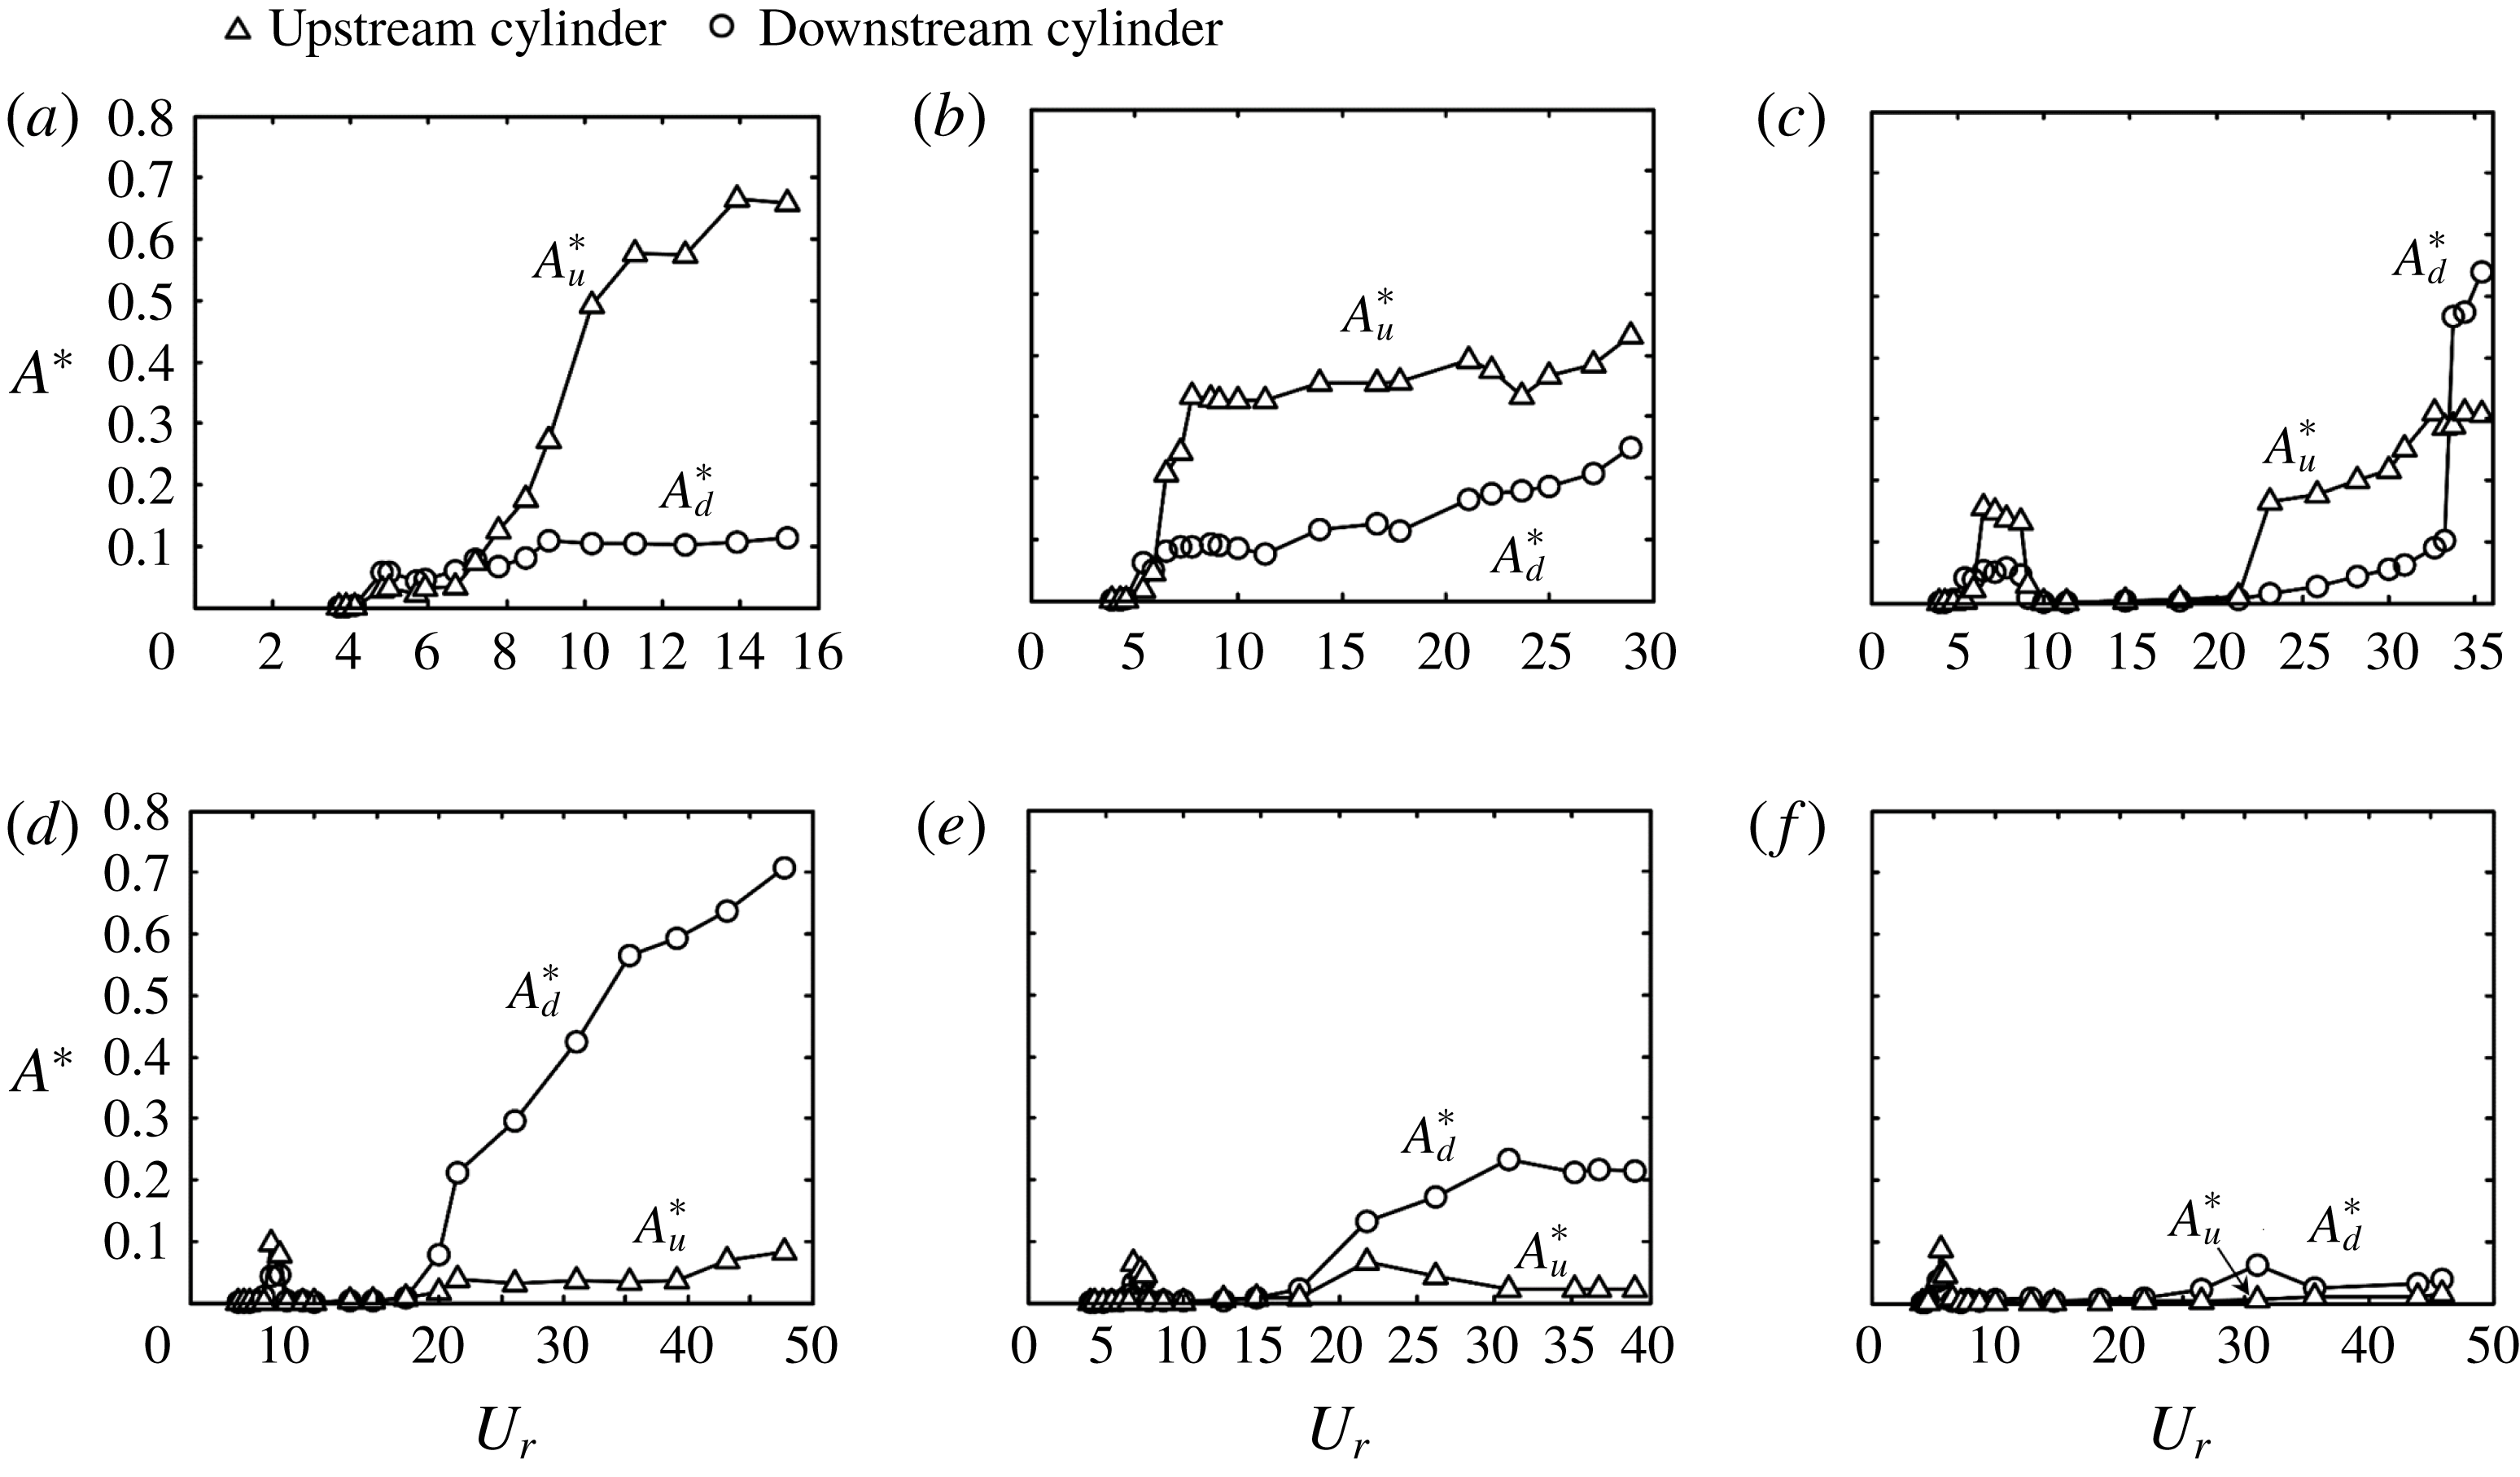
Figure 4 shows the dependence of
 $A_{u}^{\ast }$
and
 $A_{d}^{\ast }$
on
 $U_{r}$
and
 $L/D$
. Based on the characteristics of the vibration, and also the generation mechanism behind, we can classify the free vibrations of the two cylinders into four regimes.
Dependence on
 $U_{r}$
of the upstream and downstream cylinder vibration responses at (a)
 $L/D=1.2$
, (b) 1.5, (c) 2.0, (d) 2.5, (e) 3.0 and (f) 4.0.

Regime I
 $(L/D\leqslant 1.5)$
is characterized by
 $A_{u}^{\ast }>A_{d}^{\ast }$
during the galloping vibration. At
 $L/D=1.2$
(figure 4
a), VE occurs, as reflected by very small humps (
 $A_{u}^{\ast }\approx 0.03$
and
 $A_{d}^{\ast }\approx 0.06$
) for both cylinders at
 $U_{r}=4.8{-}6.7$
. Beyond
 $U_{r}\approx 7$
,
 $A_{u}^{\ast }$
increases rapidly with increasing
 $U_{r}$
, indicating the occurrence of galloping; however,
 $A_{d}^{\ast }$
varies little. At
 $L/D=1.5$
, the variations in
 $A_{u}^{\ast }$
and
 $A_{d}^{\ast }$
(figure 4
b) are similar. However, the rise in
 $A_{u}^{\ast }$
is quite sharp, becoming insensitive to
 $U_{r}$
beyond this sharp growth range. On the other hand,
 $A_{d}^{\ast }$
goes up steadily, albeit slowly. The difference between
 $A_{u}^{\ast }$
and
 $A_{d}^{\ast }$
thus becomes smaller with increasing
 $U_{r}$
. Bokaian & Geoola (Reference Bokaian and Geoola1984b
) reported, with a stationary downstream cylinder, divergent galloping vibration on the upstream cylinder
 $(m^{\ast }\unicode[STIX]{x1D701}=0.093)$
at
 $L/D=1.09$
but convergent galloping vibration at
 $L/D=1.25$
, 1.5 and 1.75. At
 $L/D=1.3$
, Kim et al. (Reference Kim, Alam, Sakamoto and Zhou2009) observed VE as well as divergent and convergent vibrations on the upstream and downstream cylinders, respectively, though they identified only VE at other
 $L/D$
. Their
 $m^{\ast }\unicode[STIX]{x1D701}$
was 0.65, which is slightly higher than the present investigation, and
 $U_{r}$
was 1.5–26.0.
In Regime II
 $(1.5<L/D<2.5)$
,
 $A_{u}^{\ast }$
may exceed
 $A_{d}^{\ast }$
or may be smaller than
 $A_{d}^{\ast }$
, depending on
 $U_{r}$
. At
 $L/D=2.0$
, the variations in
 $A_{u}^{\ast }$
and
 $A_{d}^{\ast }$
(figure 4
c) appear very different. The VE occurs over a broader range of
 $U_{r}$
, starting at
 $U_{r}\approx 5.3$
and ending at
 $U_{r}\approx 9.1$
. The corresponding maximum
 $A_{u}^{\ast }\,({\approx}0.16)$
greatly exceeds the maximum
 $A_{d}^{\ast }\,({\approx}0.06)$
, followed by the absence of vibration for both cylinders up to
 $U_{r}\approx 21$
. Galloping vibration emerges for
 $U_{r}>21$
, indicating that the responses of both cylinders display separated VE and galloping (figure 4
c). Note that
 $A_{u}^{\ast }$
is larger than
 $A_{d}^{\ast }$
at
 $21<U_{r}<33$
, following the trends at
 $L/D=1.2$
and 1.5. The
 $A_{d}^{\ast }$
jumps at
 $U_{r}=33$
, exceeding
 $A_{u}^{\ast }$
. As a result,
 $A_{u}^{\ast }$
is much larger than
 $A_{d}^{\ast }$
over
 $U_{r}=21{-}33$
, as at
 $L/D=1.2{-}1.5$
. Interestingly, once large galloping vibration occurs with the downstream cylinder,
 $A_{d}^{\ast }$
rises sharply, greatly exceeding
 $A_{u}^{\ast }$
.
Regime III
 $(2.5\leqslant L/D\leqslant 3.0)$
is opposite to Regime I, and
 $A_{u}^{\ast }$
is in general very small, not exceeding
 $A_{d}^{\ast }$
. At
 $L/D=2.5$
, VE occurs over a narrow range of
 $U_{r}\,(=6.5{-}7.2)$
for both cylinders (figure 4
d). At
 $U_{r}>17.3$
, the downstream cylinder undergoes divergent violent galloping vibration, whereas the upstream cylinder shows a rather weak vibration. A similar observation is made for
 $L/D=3.0$
(figure 4
e), though the downstream cylinder vibration is much less violent than its counterpart at
 $L/D=2.5$
.
Regime IV corresponds to
 $L/D>3.0$
and both
 $A_{u}^{\ast }$
and
 $A_{d}^{\ast }$
are small. At
 $L/D=4.0$
(figure 4
f) and 6.0 (not shown), the downstream cylinder vibration is small, and the upstream cylinder vibration is even smaller.
4 Vortex shedding frequency and its lock-in with vibration
Figure 5 shows variations with
 $U_{r}$
in the shedding frequency ratios
 $f_{v1}/f_{n}$
and
 $f_{v2}/f_{n}$
for various
 $L/D$
, where
 $f_{v1}$
and
 $f_{v2}$
, determined from
 $E_{u1}$
and
 $E_{u2}$
, respectively, are the predominant vortex frequencies between and behind the two cylinders, respectively. The Strouhal number
 $St\,(=0.2)$
in the isolated cylinder wake, indicated by the broken line, is also given in the figure for the purpose of comparison. At
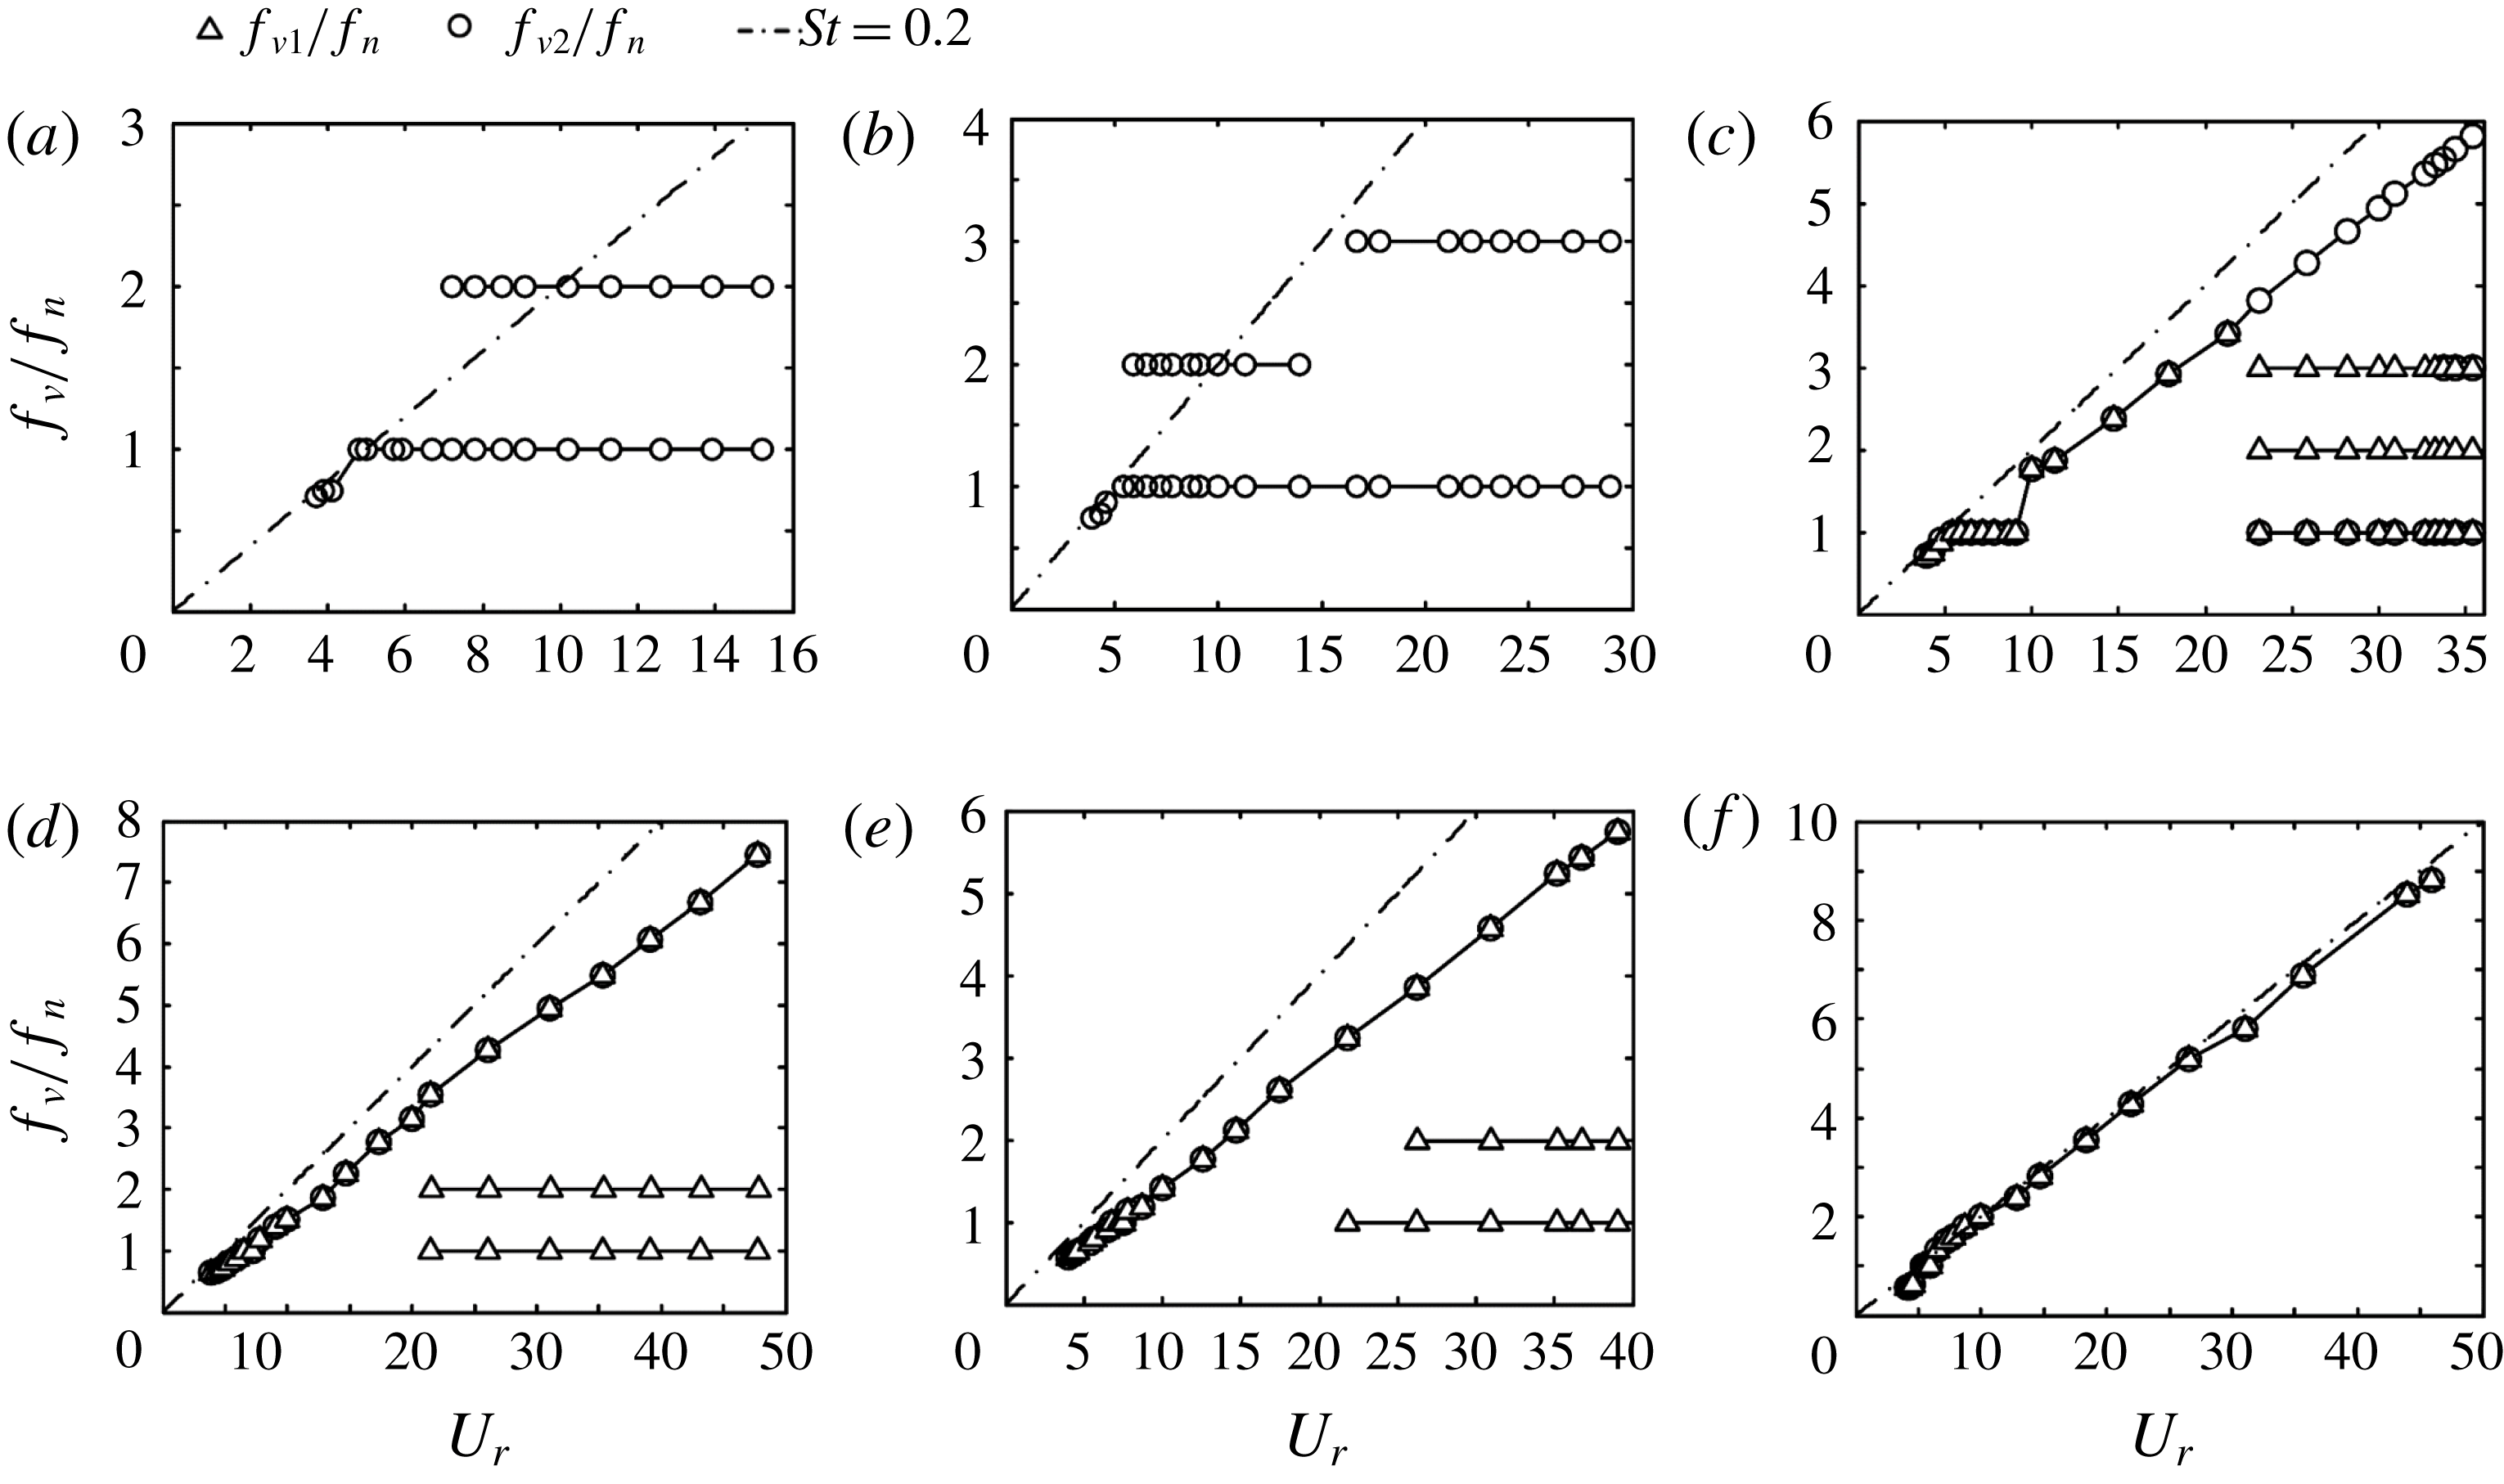
 $L/D=1.2$
and 1.5, the gap between the cylinders is very small and
 $f_{v1}$
was not measured as the hotwire probe could be damaged by the vibrating cylinders. At
 $L/D=1.2$
(figure 5
a),
 $f_{v2}/f_{n}<1.0$
for
 $U_{r}<4.8$
before the onset of the VE vibration. The value of
 $f_{v2}/f_{n}$
jumps to and remains 1.0 at
 $4.8\leqslant U_{r}\leqslant 6.7$
, where very small humps are observed in figure 4(a), indicating the occurrence of VE. At
 $U_{r}>6.7$
, two distinct frequencies are identified. The first
 $(f_{v2}/f_{n}=1)$
represents the vibration frequency, while the second
 $(f_{v2}/f_{n}=2)$
denotes the vortex shedding frequency during the galloping oscillations – that is, the shedding frequency and the second harmonic of
 $f_{n}$
are locked with each other. Similarly, the shedding frequency and the second harmonic of
 $f_{n}$
are locked with each other for
 $5.9\leqslant U_{r}\leqslant 13.9$
and the third harmonic for
 $16.7\leqslant U_{r}\leqslant 28.9$
at
 $L/D=1.5$
(figure 5
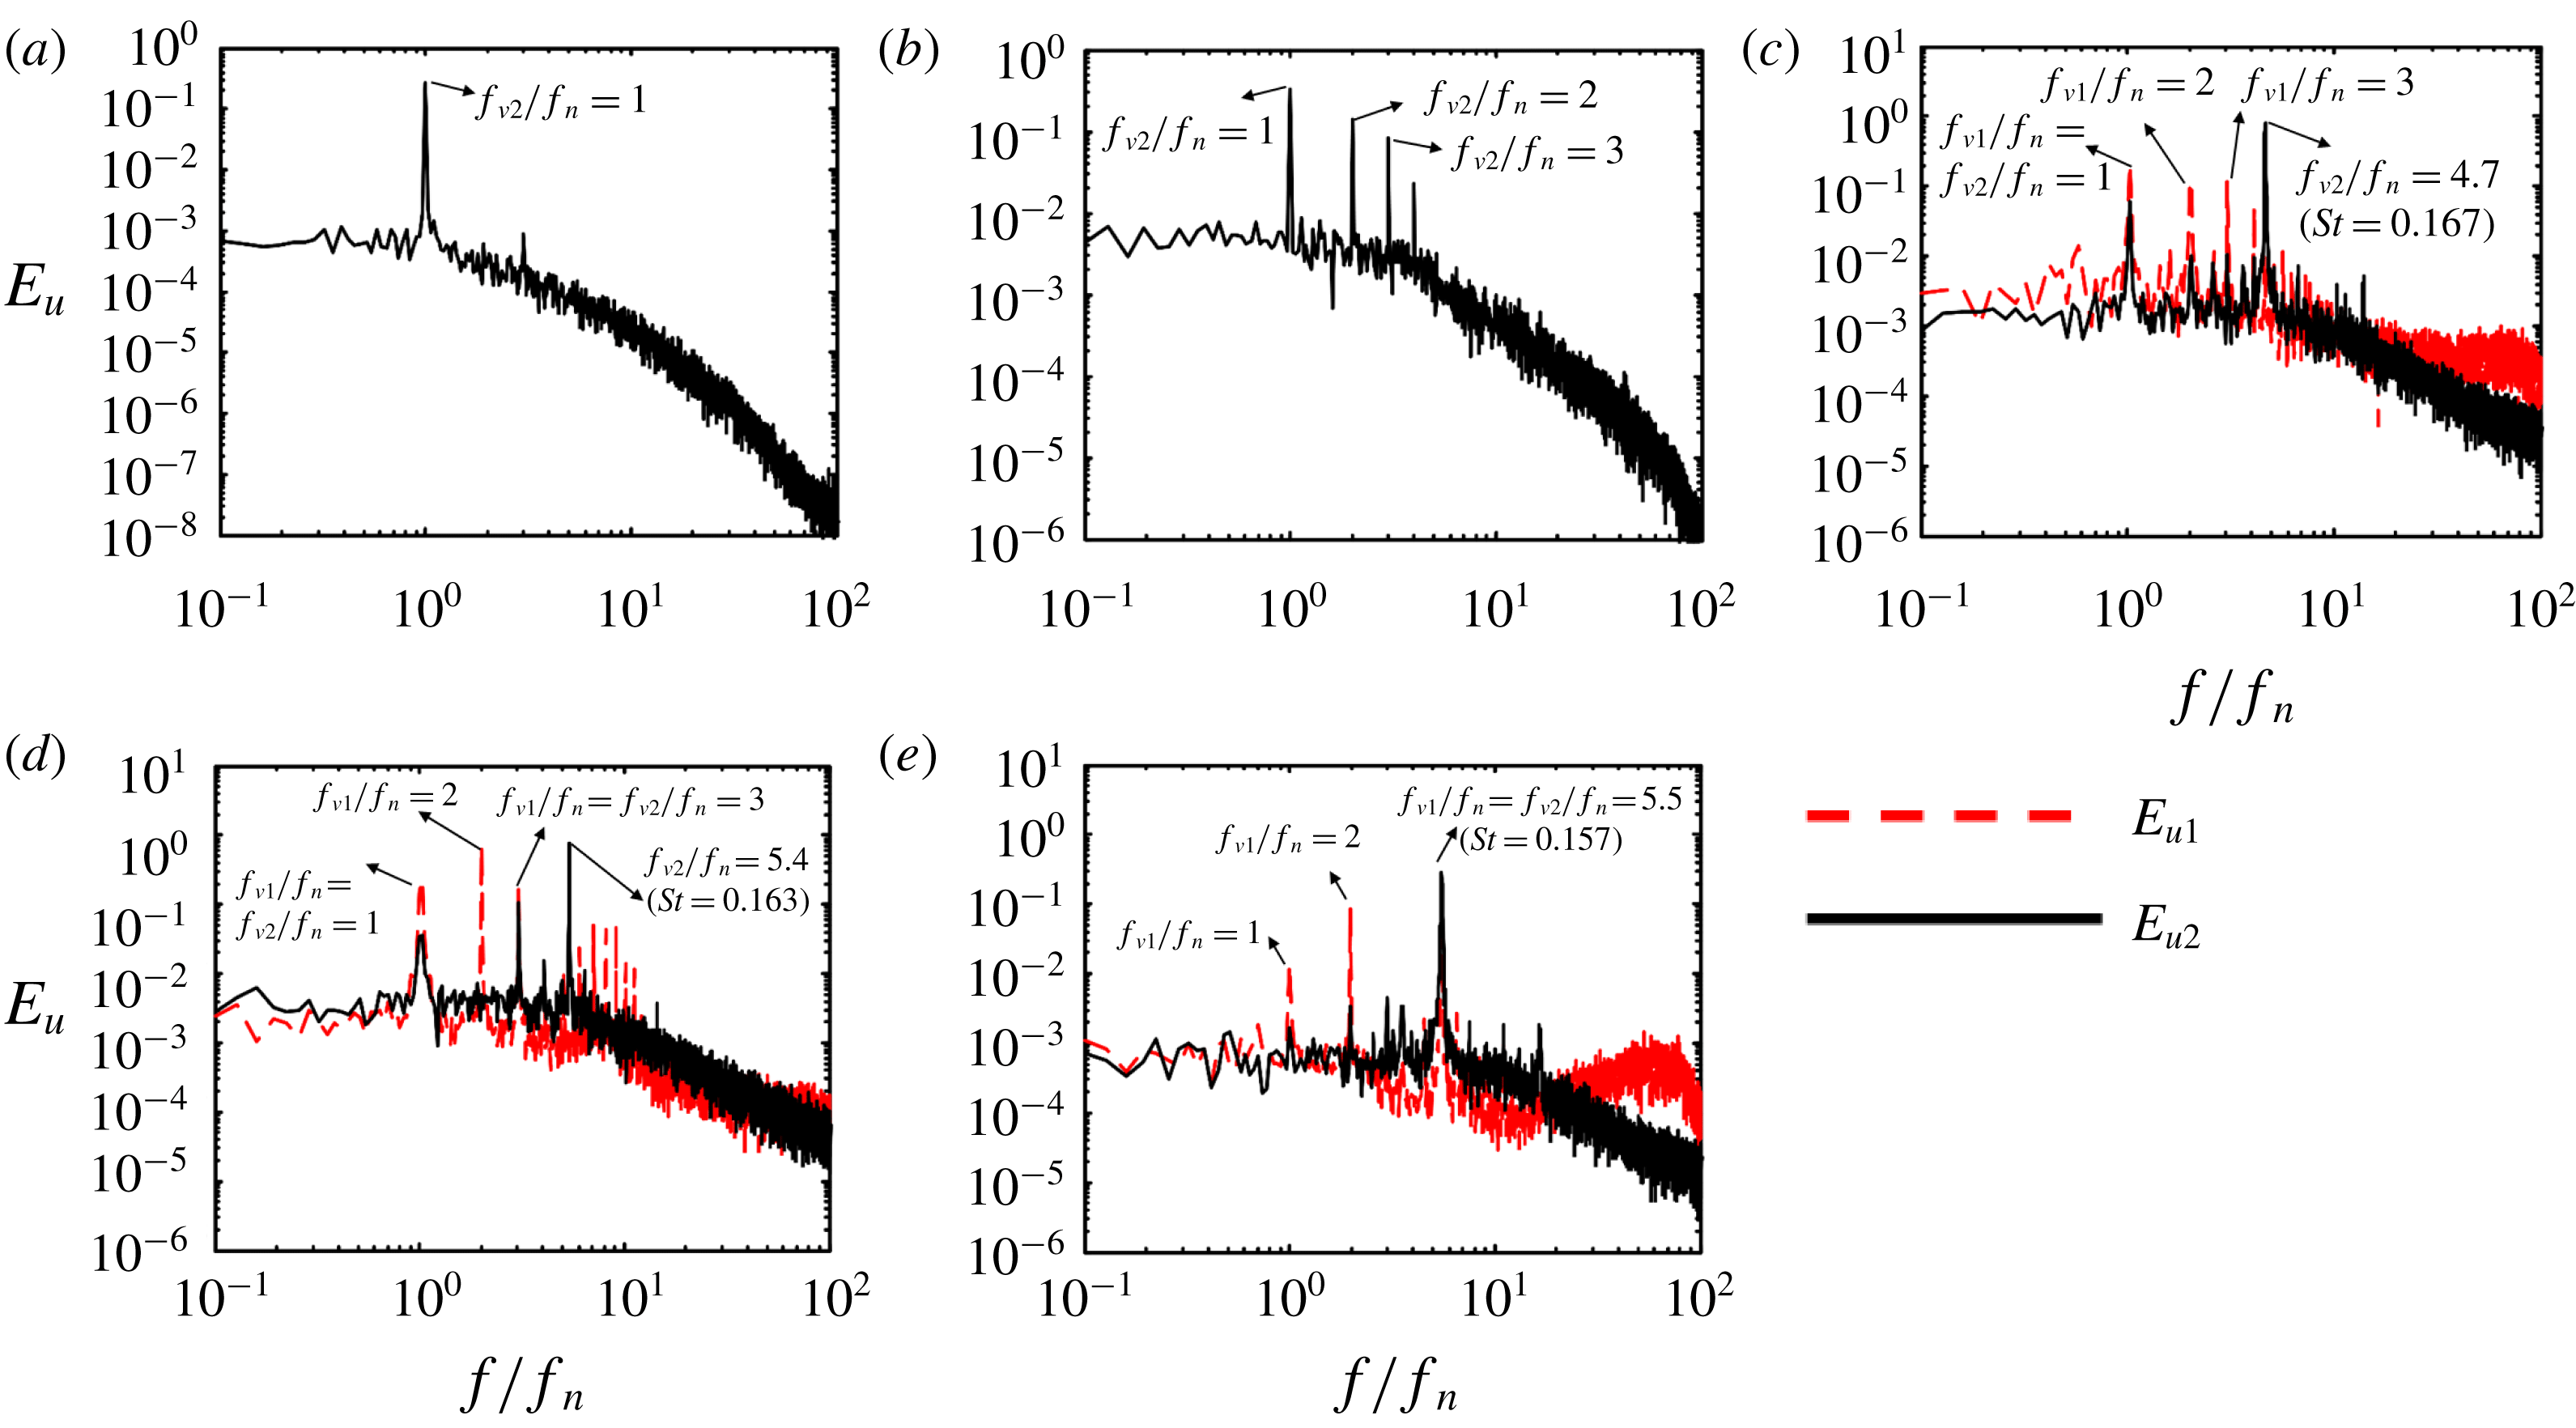
b). The power spectral density functions
 $E_{u2}$
at two representative
 $U_{r}$
for
 $L/D=1.5$
are presented in figure 6(a,b), where
 $U_{r}=5.1$
and 11.3 correspond to the VE and the lock-in of vortex shedding with the second harmonic of
 $f_{n}$
, respectively. The occurrence of a less pronounced peak at
 $3f_{n}$
at
 $U_{r}=11.3$
(figure 6
b) will be discussed later in §§ 6.1 and 6.2. In the wake of two tandem stationary cylinders, Alam (Reference Alam2014) noted that the second harmonic of the shedding frequency appears in the fluctuating lift force if the upstream-cylinder-generated shear layers reattach alternately on the downstream cylinder, with the reattached shear layer going on the same side. On the other hand, the third harmonic may occur for the shear layer reattachment largely on the opposite side of the downstream cylinder. In their investigation on the wake of two tandem cylinders
 $(L/D=1.25)$
where the upstream cylinder is free to vibrate and the downstream is stationary, Bokaian & Geoola (Reference Bokaian and Geoola1984b
) observed that the vortex shedding frequency is locked with the vibration frequency during the galloping motion at
 $U_{r}=9{-}35$
, which is similar to the lock-in for VE rather than the galloping instability of an isolated non-circular cylinder. However, they did not capture the lock-in of vortex shedding with a higher harmonic of the vibration frequency, as found here.
Variation in
 $f_{v}/f_{n}$
(
 $f_{v1}/f_{n}$
and
 $f_{v2}/f_{n}$
) with
 $U_{r}$
at (a)
 $L/D=1.2$
, (b) 1.5, (c) 2.0, (d) 2.5, (e) 3.0 and (f) 4.0.

Power spectral density function
 $E_{u}$
(
 $E_{u1}$
and
 $E_{u2}$
) for (a)
 $L/D=1.5$
,
 $U_{r}=5.1$
, (b)
 $L/D=1.5$
,
 $U_{r}=11.3$
, (c)
 $L/D=2.0$
,
 $U_{r}=28.2$
, (d)
 $L/D=2.0$
,
 $U_{r}=33.2$
and (e)
 $L/D=2.5$
,
 $U_{r}=35.0$
.

At
 $L/D=2.0$
(figure 5
c), VE takes place over a broader
 $U_{r}$
range,
 $5.3\leqslant U_{r}\leqslant 9.1$
, where both
 $f_{v1}$
and
 $f_{v2}$
are locked with
 $f_{n}$
. The absence of vibration up to
 $U_{r}=21$
(figure 4
c) corresponds to continuously increased
 $f_{v1}$
and
 $f_{v2}$
that follow the natural Strouhal number
 $St\approx 0.16$
, i.e.
 $f_{v1}/f_{n}=f_{v2}/f_{n}=St\times U_{r}$
. At
 $U_{r}>21$
, the galloping vibration emerges, as shown in figure 4(c), and
 $f_{v2}$
continues to follow
 $St\approx 0.16$
, along with vortex shedding locked with
 $3f_{n}$
for
 $U_{r}>33$
where
 $A_{d}^{\ast }>A_{u}^{\ast }$
(figure 4
c) and with
 $f_{v1}=2f_{n}$
and
 $3f_{n}$
(figure 5
c), as can be seen in
 $E_{u}$
at
 $U_{r}=28.2$
and 33.2 (figure 6
c,d). At
 $L/D=2.5$
and 3.0 (figure 5
d,e), the lock-in phenomenon occurs over
 $U_{r}=6.5{-}7.2$
. Given
 $U_{r}>21.5$
,
 $f_{v1}/f_{n}=f_{v2}/f_{n}=St\times U_{r}$
, where
 $St\approx 0.15{-}0.16$
, another peak occurs at
 $f_{v1}/f_{n}=2$
. A typical example is given in figure 6(e) at
 $U_{r}=35.0$
. At
 $L/D=4.0$
(figure 5
f) and 6.0 (not shown), both
 $f_{v1}$
and
 $f_{v2}$
increase after the lock-in (
 $f_{v1}/f_{n}=f_{v2}/f_{n}=St\times U_{r}$
with
 $St\approx 0.2$
) at
 $U_{r}=5.1{-}5.6$
. The observation suggests that the influence of the downstream cylinder on the upstream cylinder is weak and the upstream cylinder acts more like a single cylinder.
In summary, in the case of galloping vibration in Regime I (
 $L/D=1.2$
and 1.5), vortex shedding from the downstream cylinder is locked with the harmonics of the vibration frequency (i.e.
 $f_{v2}/f_{n}=2$
and 3); that is, the natural vortex shedding frequency disappears. Regime III (
 $L/D=2.5$
and 3.0) is characterized by the lock-in phenomenon with
 $f_{v1}/f_{n}=2$
and natural vortex shedding, where
 $f_{v1}/f_{n}=f_{v2}/f_{n}=St\times U_{r}(St\approx 0.15{-}0.16)$
, while regime II
 $(L/D=2.0)$
has the mixed characteristics of both regimes I and III. In Regime IV
 $(L/D=4.0{-}6.0)$
, there is no lock-in observed and
 $f_{v1}/f_{n}=f_{v2}/f_{n}=St\times U_{r}(St\approx 0.2)$
.
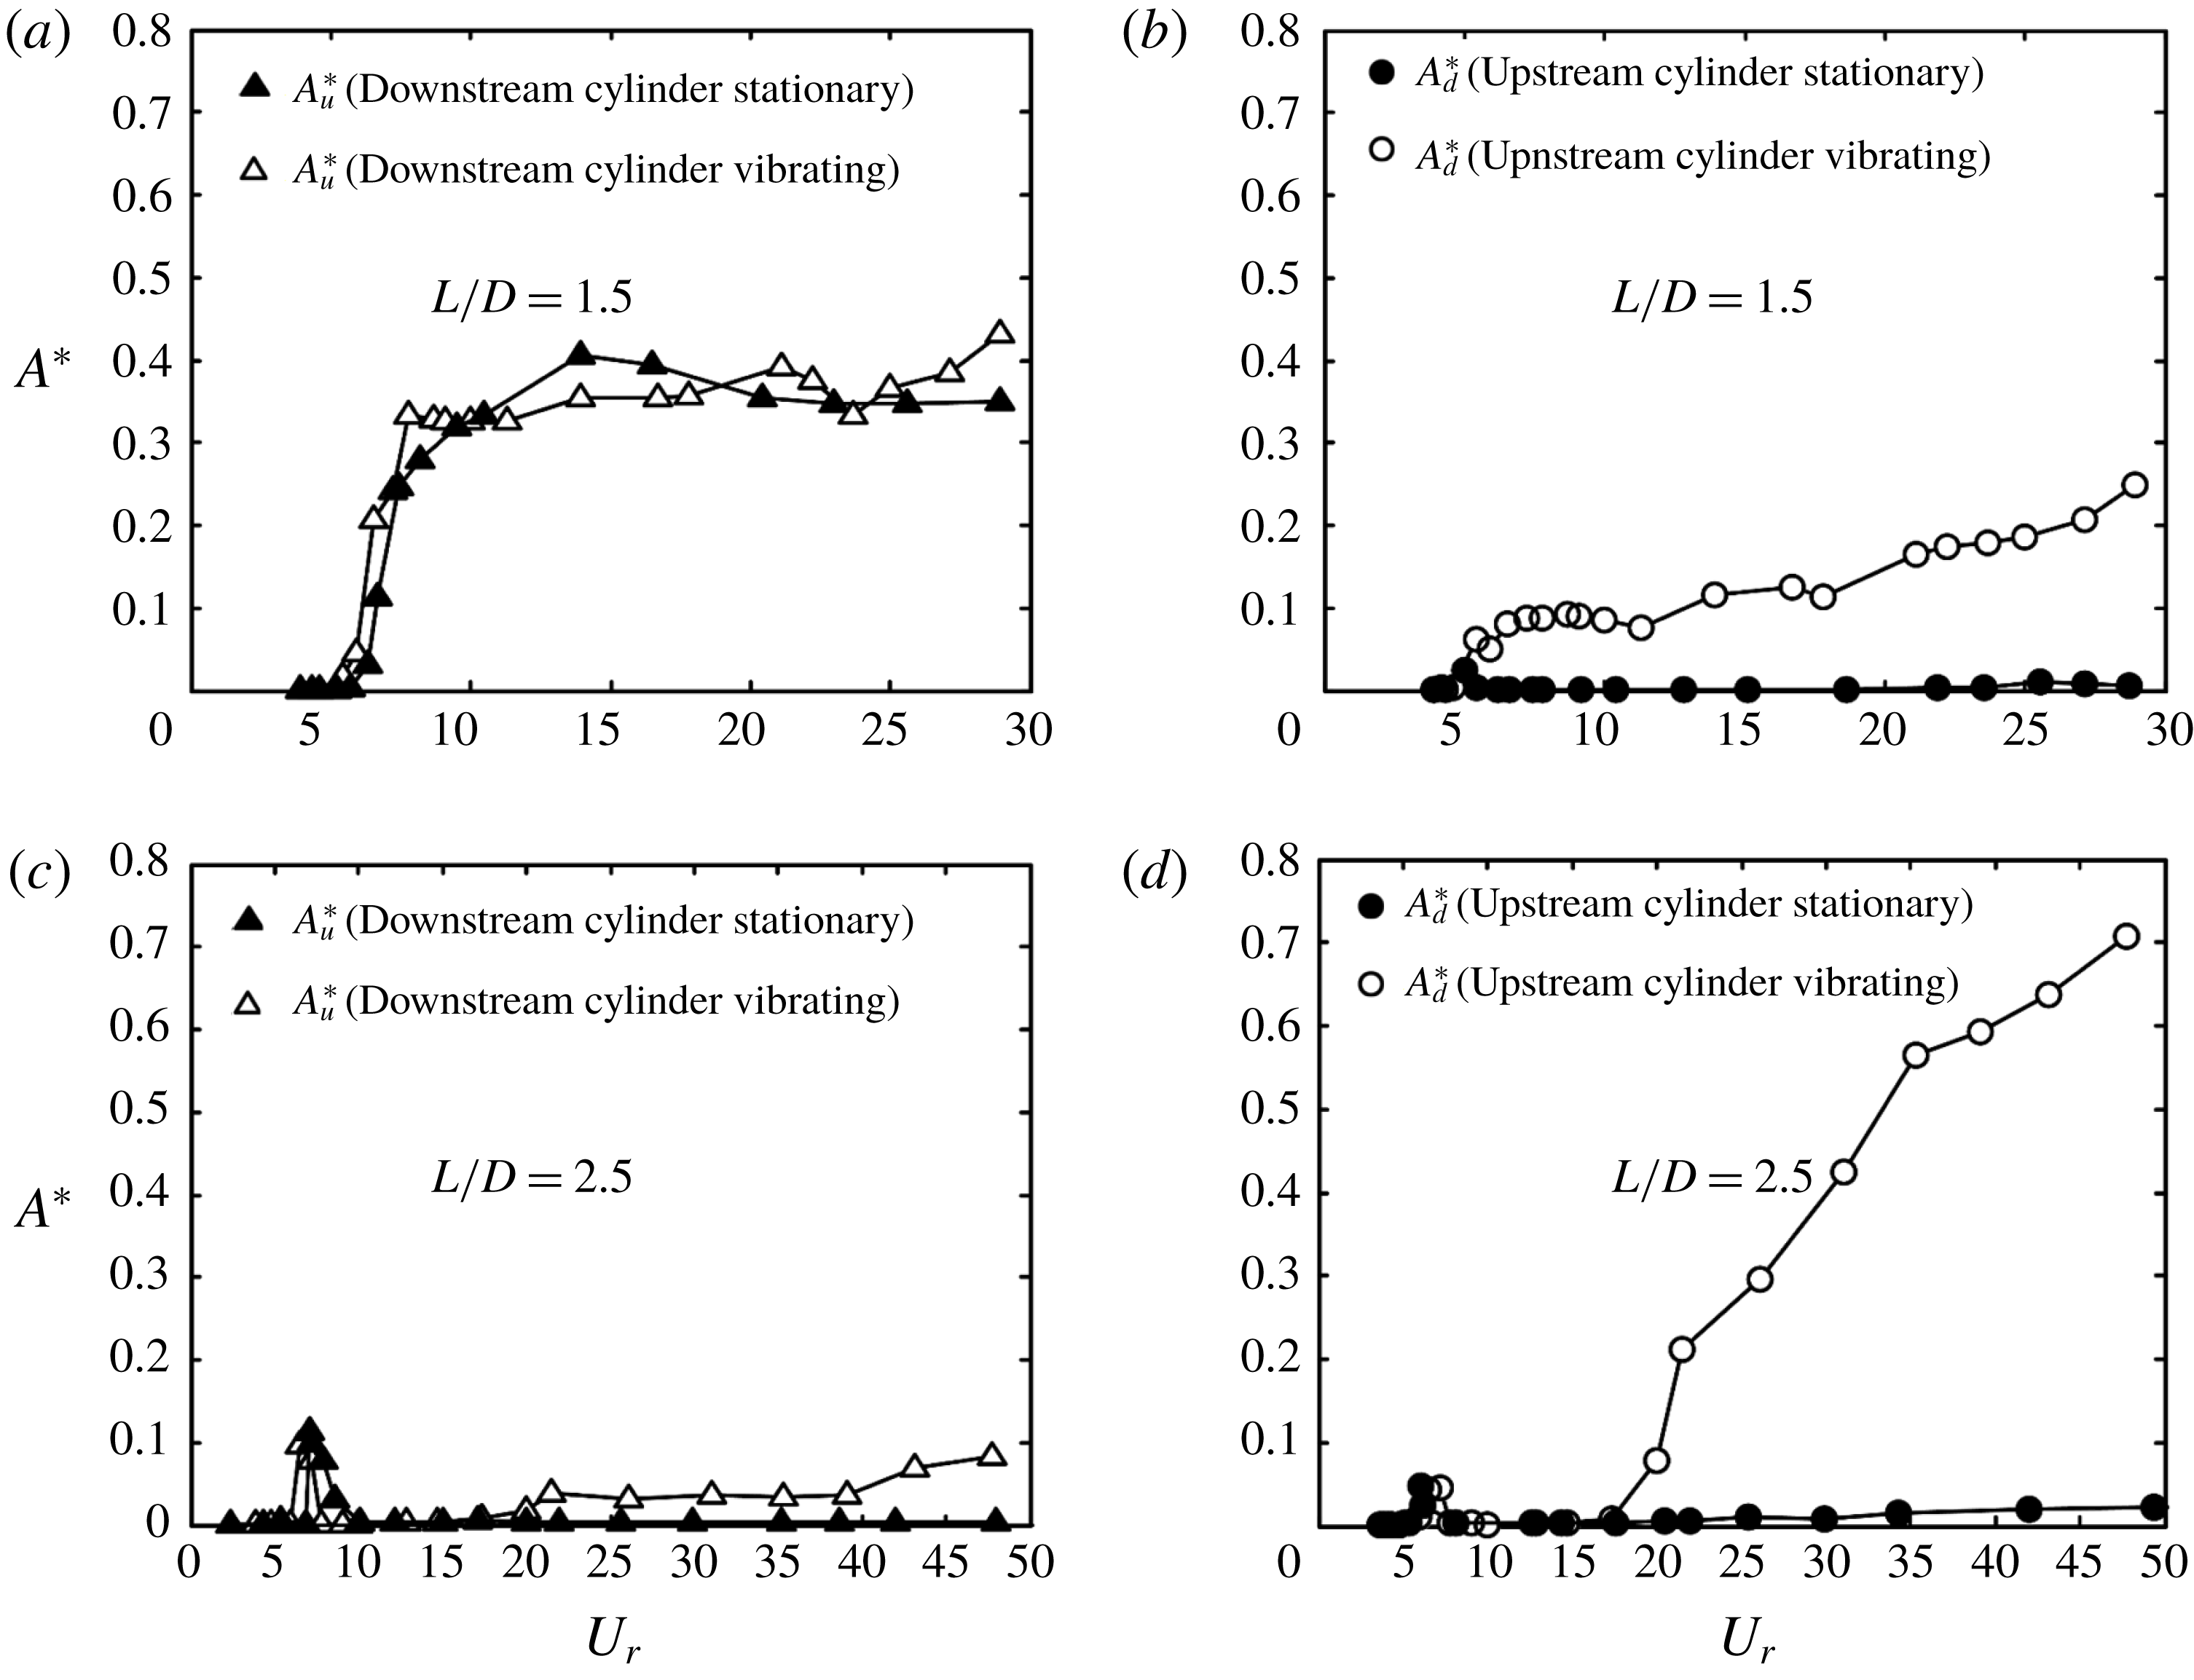
(a,c) Dependence of the upstream cylinder vibration response on the initial state of the downstream cylinder. (b,d) Dependence of the downstream cylinder vibration response on the initial state of the upstream cylinder.

5 Role of the neighbouring cylinder’s initial state
The vibration of a cylinder may be dependent on the initial states (spring-mounted or stationary) of the other cylinder. The impact of the initial state of a cylinder on the other cylinder’s vibration is examined for regimes I
 $(L/D=1.5)$
and III
 $(L/D=2.5)$
, where
 $A_{u}^{\ast }>A_{d}^{\ast }$
and
 $A_{u}^{\ast }<A_{d}^{\ast }$
, respectively. Figure 7(a) compares the dependences of
 $A_{u}^{\ast }$
on
 $U_{r}$
at
 $L/D=1.5$
when the downstream cylinder is spring-mounted (open triangle symbol) or stationary (solid triangle symbol), respectively. Note that the cylinder vibration is directly induced by the flow from the quiescent state without any external perturbation. It is clear that
 $A_{u}^{\ast }$
varies little from the vibrating downstream cylinder to the stationary cylinder, implying that the upstream cylinder vibration is independent of the downstream cylinder’s initial state. It has been well established that galloping does not occur for an isolated circular cylinder. The observation from figure 7(a) further suggests that a downstream cylinder is essentially required to excite the galloping vibration of the upstream cylinder, no matter whether the downstream cylinder is fixed or elastically mounted. On the other hand, the initial state of the upstream cylinder has a pronounced impact on the downstream cylinder (figure 7
b). When the upstream cylinder is stationary,
 $A_{d}^{\ast }$
is suppressed for all
 $U_{r}$
and the galloping vibration completely disappears, though the VE vibration is discernible and a tiny peak occurs at
 $U_{r}\approx 5$
. The observation suggests that the upstream cylinder state has a small effect on the VE vibration of the downstream cylinder but may completely suppress the galloping vibration. It may be further inferred that the relatively small amplitude vibration of the downstream cylinder must be induced by the high-amplitude vibration of the upstream cylinder (figure 4
b). In regime III
 $(L/D=2.5)$
, the stationary downstream cylinder leads to
 $A_{u}^{\ast }\approx 0$
, and the stationary upstream cylinder reduces
 $A_{d}^{\ast }$
to a very low level (figure 7
c,d). It may be further inferred, based on figure 7(d), that a small-amplitude vibration of the upstream cylinder can dramatically enhance vibration of the downstream cylinder. It is clear that the effect of the initial states of the upstream cylinder on the downstream cylinder vibration is different from one regime to another. The dependence of a cylinder’s vibration on the state (spring-mounted or stationary) of the other cylinder can be compared, to some extent, with the classical hysteresis observed in the VE of a single circular cylinder (Prasanth, Premchandran & Mittal Reference Prasanth, Premchandran and Mittal2011; Singh & Mittal Reference Singh and Mittal2005). By increasing and decreasing
 $Re$
, different vibration responses in the VE regime were observed, indicative of hysteresis. That is, there are two solutions of the vibration response at a given
 $Re$
, depending on whether
 $Re$
increases or decreases. On the other hand, the cylinder vibration at a given
 $Re$
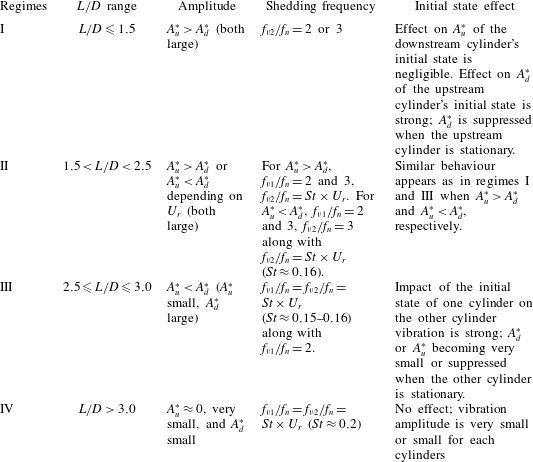
is dependent on whether the other cylinder is vibrating or stationary. Table 1 summarizes the major features in each regime when the galloping vibration of the cylinders occurs.
Summary of features in each regime during galloping vibration.

6 Galloping mechanism in Regime I
6.1 Flow structure
The flow structure is examined at
 $L/D=1.5$
and
 $U_{r}=11.3$
in order to understand the large galloping vibration of the upstream cylinder. Using the
 $Y^{\prime }$
signal as a reference for phase, we calculated the phase-averaged vorticity contours (figure 8
a–h), where each period
 $T$
of the cylinder oscillation is divided equally into eight instants/phases and each bin consists of 64 images. The PIV images were captured separately over
 $x^{\prime }/D=0{-}1.5$
and 1.5–7. Figure 8 shows one complete view window from
 $x^{\prime }/D=0{-}1.5$
and 1.5–7. In both cases, the
 $Y^{\prime }$
and
 $Y$
signals were also simultaneously captured, facilitating connection of the structural vibration and flow behaviours. The correspondence between the time instants/phases and
 $Y^{\prime }/D$
or
 $Y/D$
is given in figure 8(i). As the laser sheet was shining through from the bottom wall of the test section, the images show two blank strips (white colour) above the cylinders. The thick dashed arrows given above the downstream cylinder represent the flow directions predicted from the lower side of the snapshot at the opposite phase. For example, the qualitative feature of the shear layer behaviour on the upper side (white area) of the downstream cylinder at instants (
 $b$
) and (
 $c$
) can be viewed on the lower side at instants (
 $f$
) and (
 $g$
), respectively, when the upstream cylinder reaches the highest position for the former and the lowest for the latter.
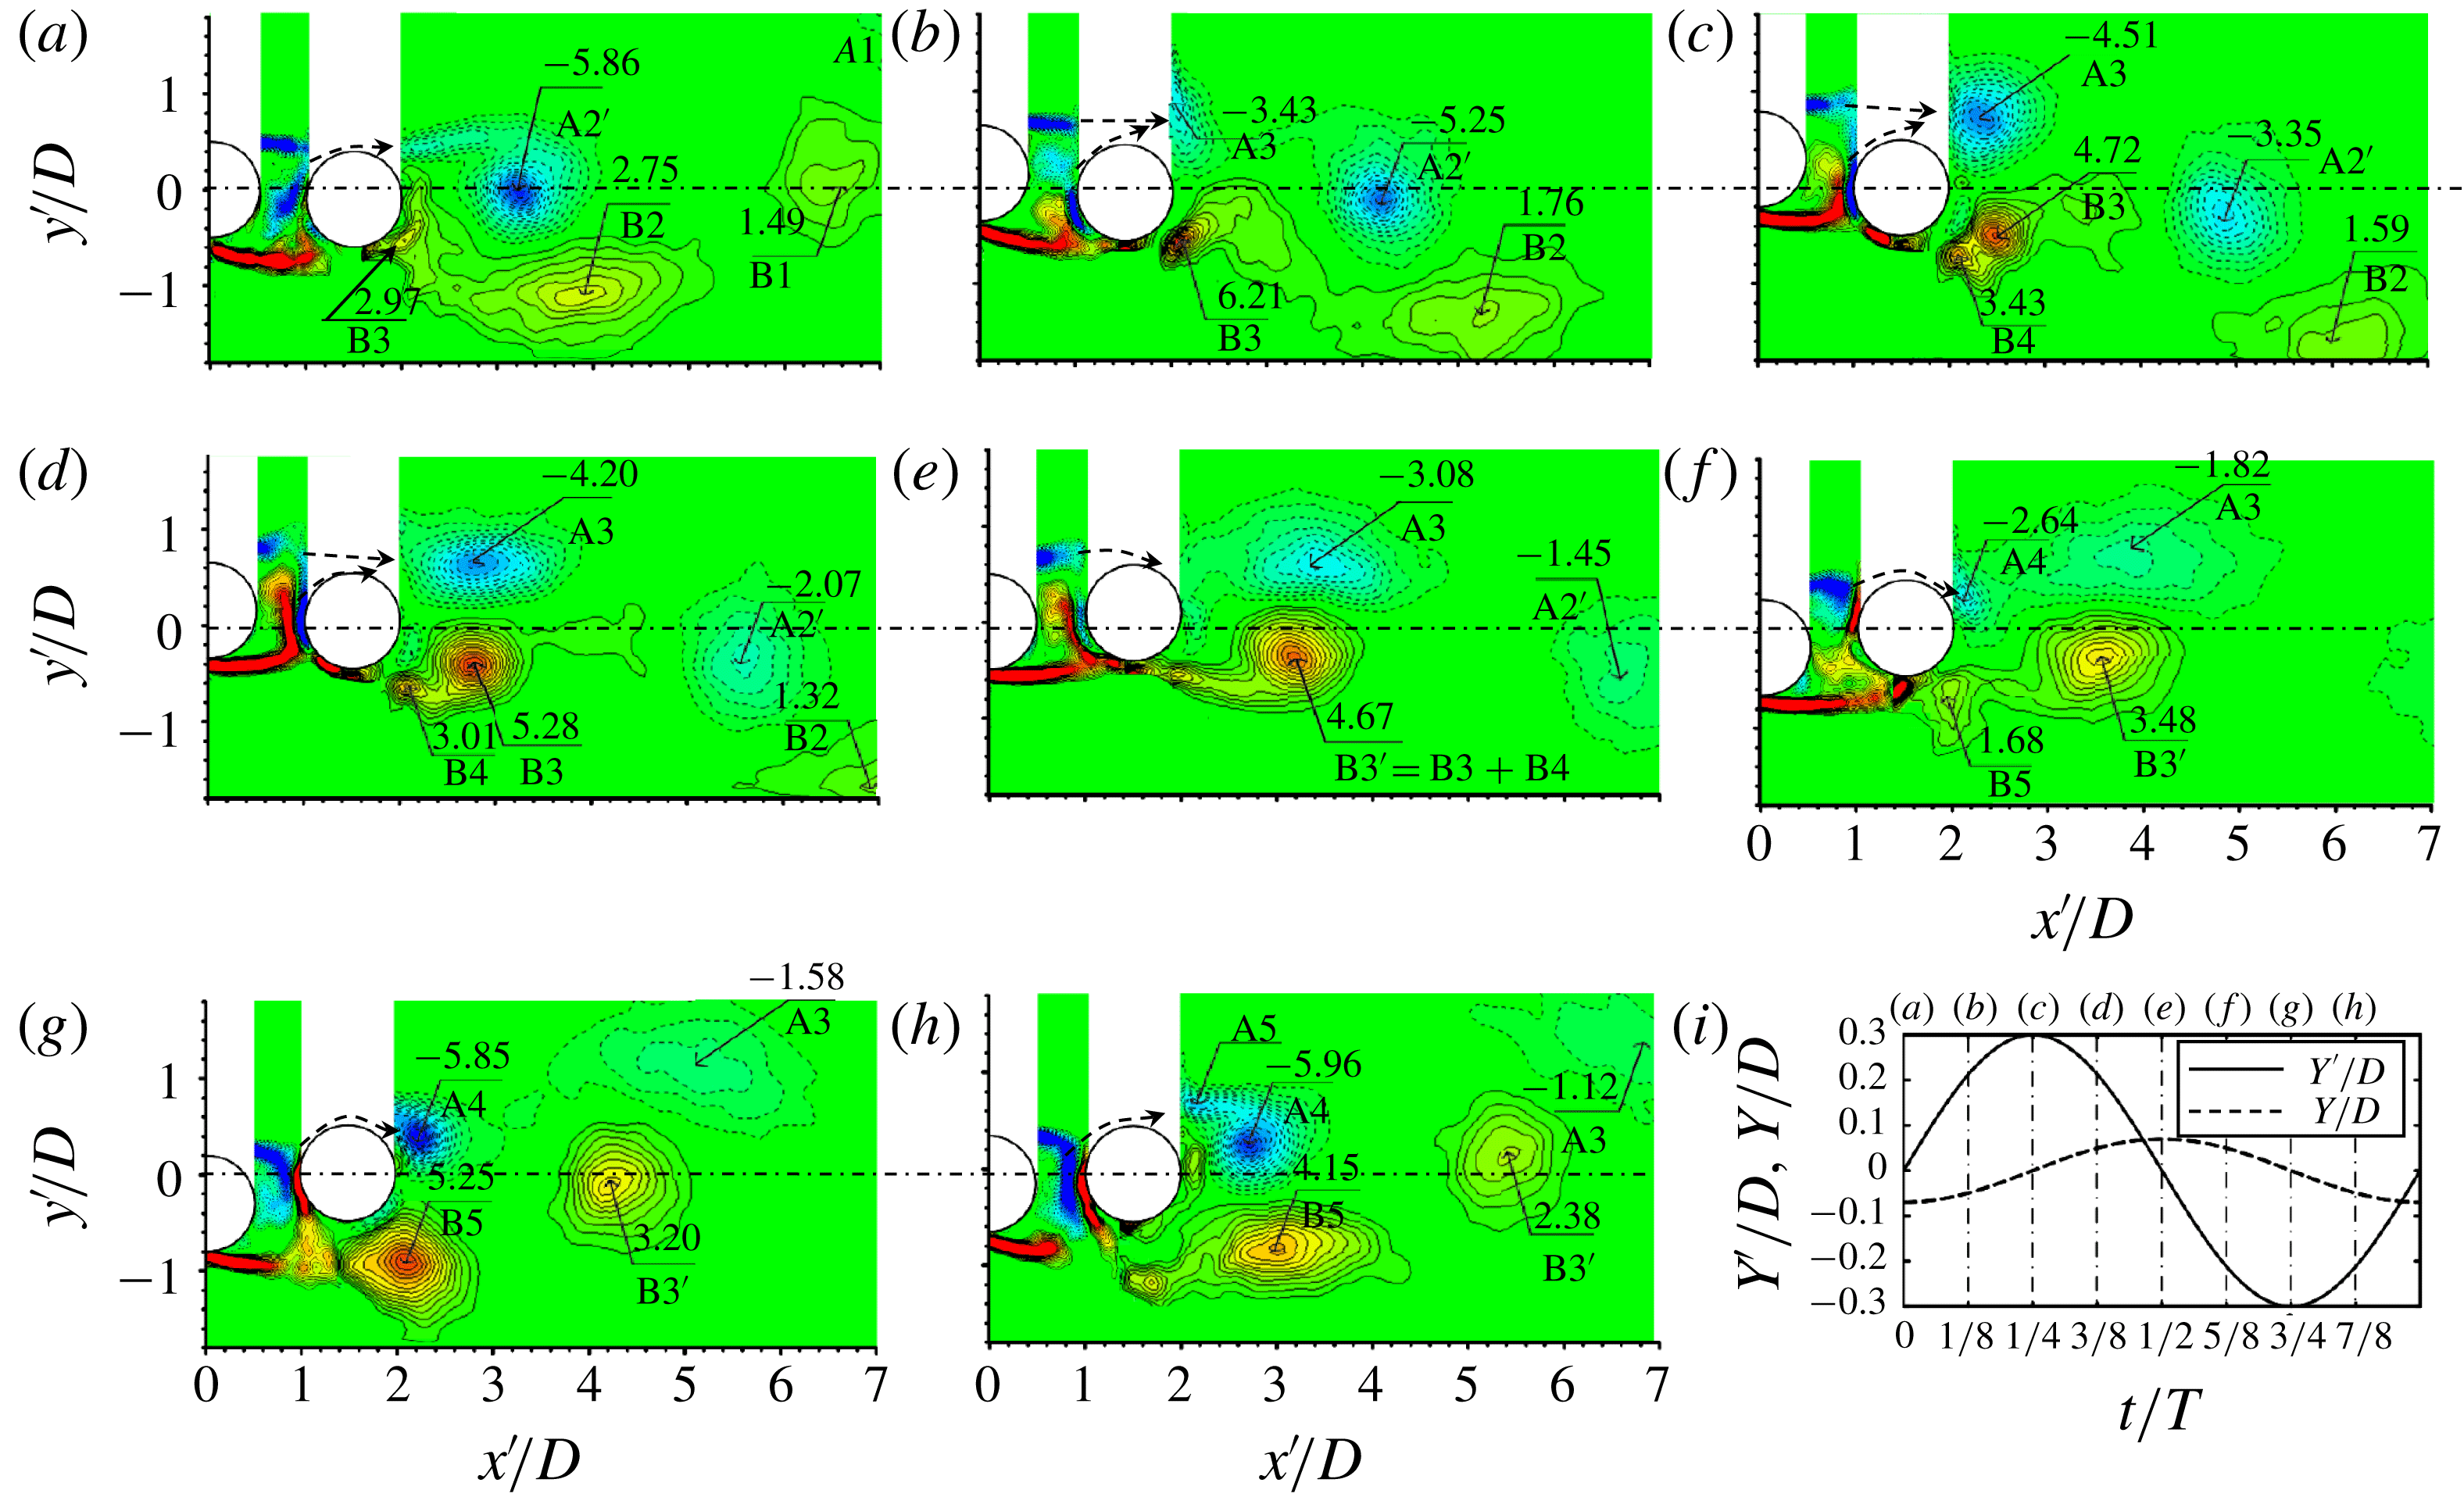
(a–h) Phase-averaged vorticity
 $\unicode[STIX]{x1D714}_{z}^{\ast }\,(=\unicode[STIX]{x1D714}_{z}D/U_{\infty })$
contours in one vibration cycle. Solid and dotted contour lines stand for positive and negative vorticities, respectively. The contour cutoff levels are
 $\pm 0.4$
and the increment is 0.4. (i) Variations in
 $Y/D$
and
 $Y^{\prime }/D$
where the time instants are specified by the dash-dotted lines corresponding to (a–h).
 $L/D=1.5$
,
 $U_{r}=11.3$
.

The value of
 $t/T=0$
(figure 8
a) refers to the instant when the upstream cylinder crosses the equilibrium position
 $Y^{\prime }/D=0$
at which the downstream cylinder is at the lowest position, both cylinders moving upwards. The upper shear layer around the upstream cylinder reattaches onto the front surface of the downstream cylinder (figure 8
a). The reattached flow runs largely over the front surface of the downstream cylinder. Two vortices B2 and A2
 $^{\prime }$
are shed from the downstream cylinder, and B3 starts to emerge in the lower shear layer. As the upstream cylinder moves upwards (figure 8
b), the reattachment of the lower gap shear layer shifts upstream, feeding B3 with vorticity. The forward part of the reattached shear layer rolls into the gap of the cylinder, close to the base of the upstream cylinder. The upper gap shear layer detaches and generates vortex A3. When the upstream cylinder is at the top position (figure 8
c), the lower gap shear layer reattachment moves to the front surface, resulting in a strong rollup motion very close to the base of the upstream cylinder. The strong rollup motion may contribute to the large amplitude of vibration for the upstream cylinder. A small vortex B4 originates from the lower side reattached shear layer. Vortex A3 grows from instant (
 $b$
) to (
 $c$
). From instants (
 $c$
) and (
 $d$
), when the upstream cylinder moves downwards, the lower gap shear layer remains reattached. Vortex B3 grows in both size and vorticity concentration, originally acquiring its vorticity from the reattached shear layer and also acquiring vorticity from B4. As a result, B3 and B4 merge at instant (
 $e$
), forming B3
 $^{\prime }$
(
 $=$
B3
 $+$
B4). Vortex A3, formed above the centreline, leads B3
 $^{\prime }$
. As the upstream cylinder moves further downwards (figure 8
f), the upper shear layer reattaches on the upper-front surface of the downstream cylinder, and two new vortices A4 and B5 emerge, largely due to reattached and detached shear layers. Both A4 and B5 grow rapidly between instants (
 $f$
) and (
 $g$
) (figure 8
g). At instant (
 $h$
), the reattached shear layer results in a small vortex A5 that accompanies A4. Similarly to the merging of B3 and B4, both A4 and A5 merge and form a single vortex as A2
 $^{\prime }$
in figure 8(a).
A total of six vortices (A3, B3, B4, A4, B5 and A5) are formed during one cycle of the cylinder oscillation, where B3 and A4 originate from the shear layers reattaching on the rear side (
 $\unicode[STIX]{x1D703}=|90^{\circ }{-}120^{\circ }|$
, measured from the nominal front stagnation point) surface and merge with B4 and A5, respectively. The latter two vortices are generated during the reattachment shifting from the rear side to the front surface. Apparently, the wake downstream is characterized by four vortices, i.e. A3, B3
 $^{\prime }$
(
 $=$
B3
 $+$
B4), A2
 $^{\prime }$
(
 $=$
A4
 $+$
A5) and B5, which account for the second-harmonic lock-in,
 $f_{v2}/f_{n}=2.0$
. Interestingly, vortices A2
 $^{\prime }$
and B3
 $^{\prime }$
originating from the reattached shear layer gradually move towards the centreline and even cross it, showing up on the other side of the wake, while A3 and B5 stay on the same side, never crossing the centreline. It will be shown later that the vortices A3 and B5 that never cross the centreline persist further downstream, while A2
 $^{\prime }$
and B3
 $^{\prime }$
, that have crossed the centreline, are short-lived. It may be concluded that the reattachment and detachment of the gap shear layers contribute to the second-harmonic lock-in, and the violent vibration of the upstream cylinder may be connected to the reattached shear layer rollup motion very close to the base of the upstream cylinder.
6.2 Flow structure evolution
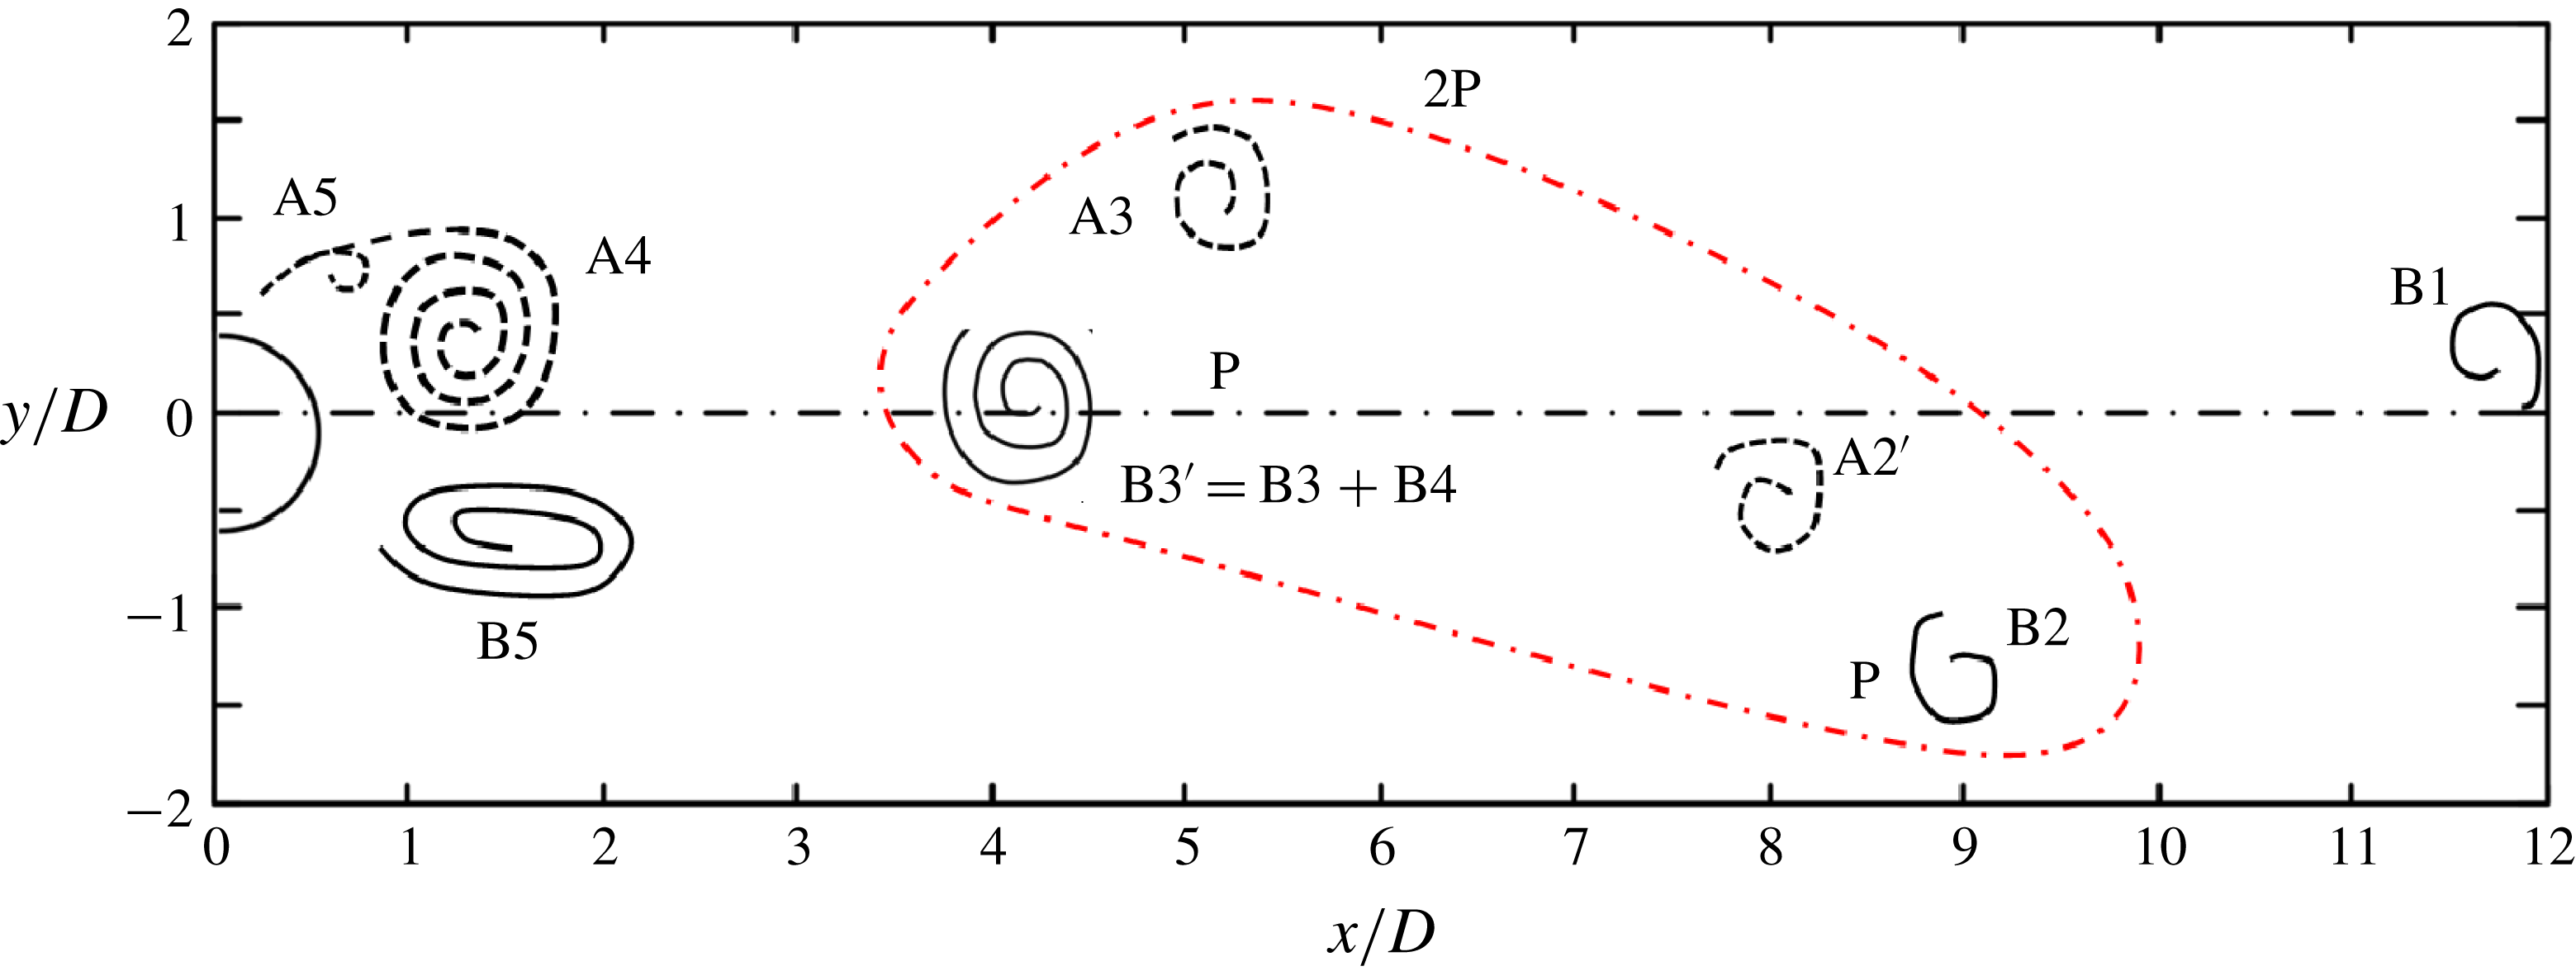
A summary sketch is given in figure 9 to illustrate the vortex evolution over
 $x/D=0{-}12$
. The cylinder position corresponds to instant (
 $h$
) and the vortices are placed in the wake based on their positions in figure 8(a–h). The streamwise separations between vortices B5 and B3
 $^{\prime }$
and between B3
 $^{\prime }$
and A3 are approximately
 $2.6D$
and
 $1.0D$
, respectively, as estimated from figure 8(h). Similarly, the streamwise distances between A3 and A2
 $^{\prime }$
, between A2
 $^{\prime }$
and B2, and between B2 and B1 are
 $2.8D$
,
 $1.0D$
and
 $2.8D$
, respectively, obtained from figures 8(e), 8(c) and 8(a) in view of the observation that the convection velocity of vortices changes little beyond
 $x/D=5.5$
(Lin & Hsieh Reference Lin and Hsieh2003; Alam & Zhou Reference Alam and Zhou2007). The vortices A3 and B3
 $^{\prime }$
, close to each other, may be considered to be one pair. So are A2
 $^{\prime }$
and B2. It is noted that the signs of the vortices in the wake follow the pattern of positive (B2)
 $\rightarrow$
negative (A2
 $^{\prime }$
)
 $\rightarrow$
negative (A3)
 $\rightarrow$
positive (B3
 $^{\prime }$
). The orientation of the vortices is similar to the 2P wake mode for the vortex-induced vibration of a single cylinder (Williamson & Roshko Reference Williamson and Roshko1988). The difference is that, for the single cylinder, the vortex stretching and splitting process appears to be fundamental to the 2P wake formation mode (Govardhan & Williamson Reference Govardhan and Williamson2000), where one vortex stretches and then splits into two vortices, one staying on the same side while the other crosses the centreline. The latter is called an inverted vortex. The inverted vortices were characterized by their relative weakness and decayed more rapidly than those that never crossed the centreline. On the other hand, for the two-cylinder case, there is no evidence for vortex stretching and splitting during the vortex evolution. Rather, vortex merging takes place, producing B3
 $^{\prime }$
and A2
 $^{\prime }$
, and the 2P mode is produced via the evolution of six vortices.
Sketch of the vortex street behind the cylinders, following figure 8. P stands for a vortex pair. The red dashed-dotted line encircles the vortices shed in one oscillation cycle.

6.3 Pressure distribution around vibrating cylinders
The phase-averaged pressure coefficient
 $\langle C_{P}\rangle$
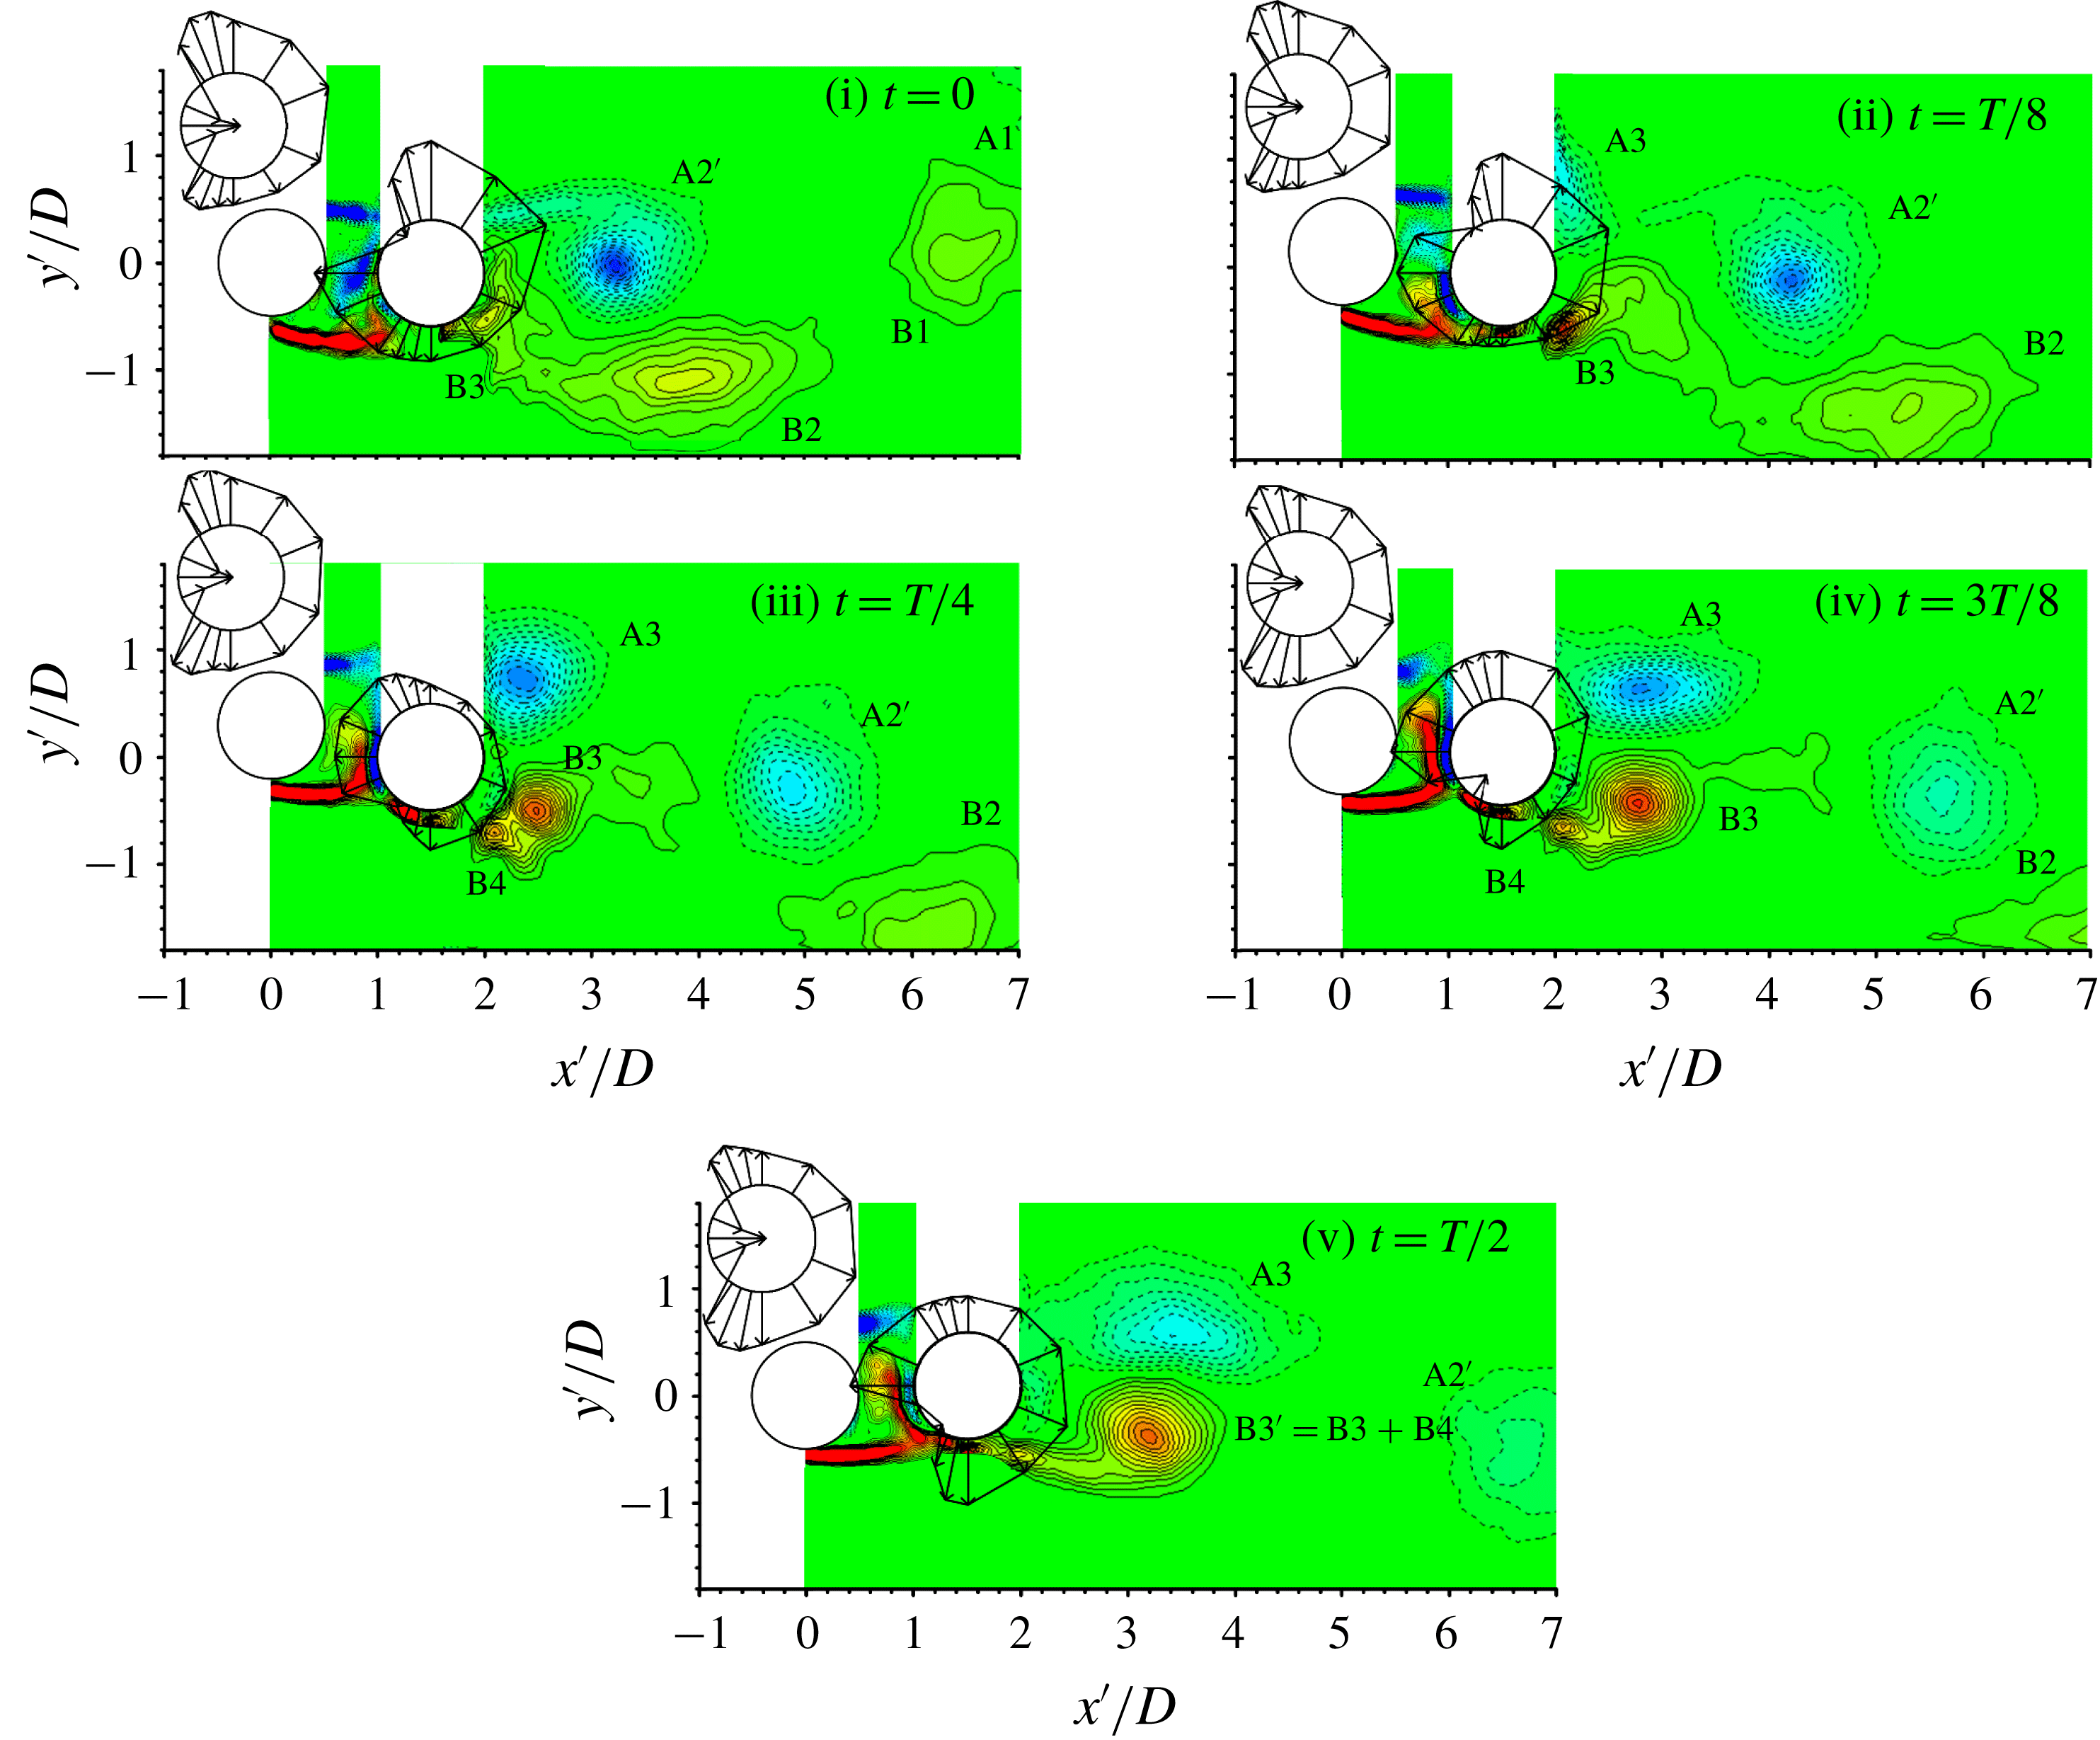
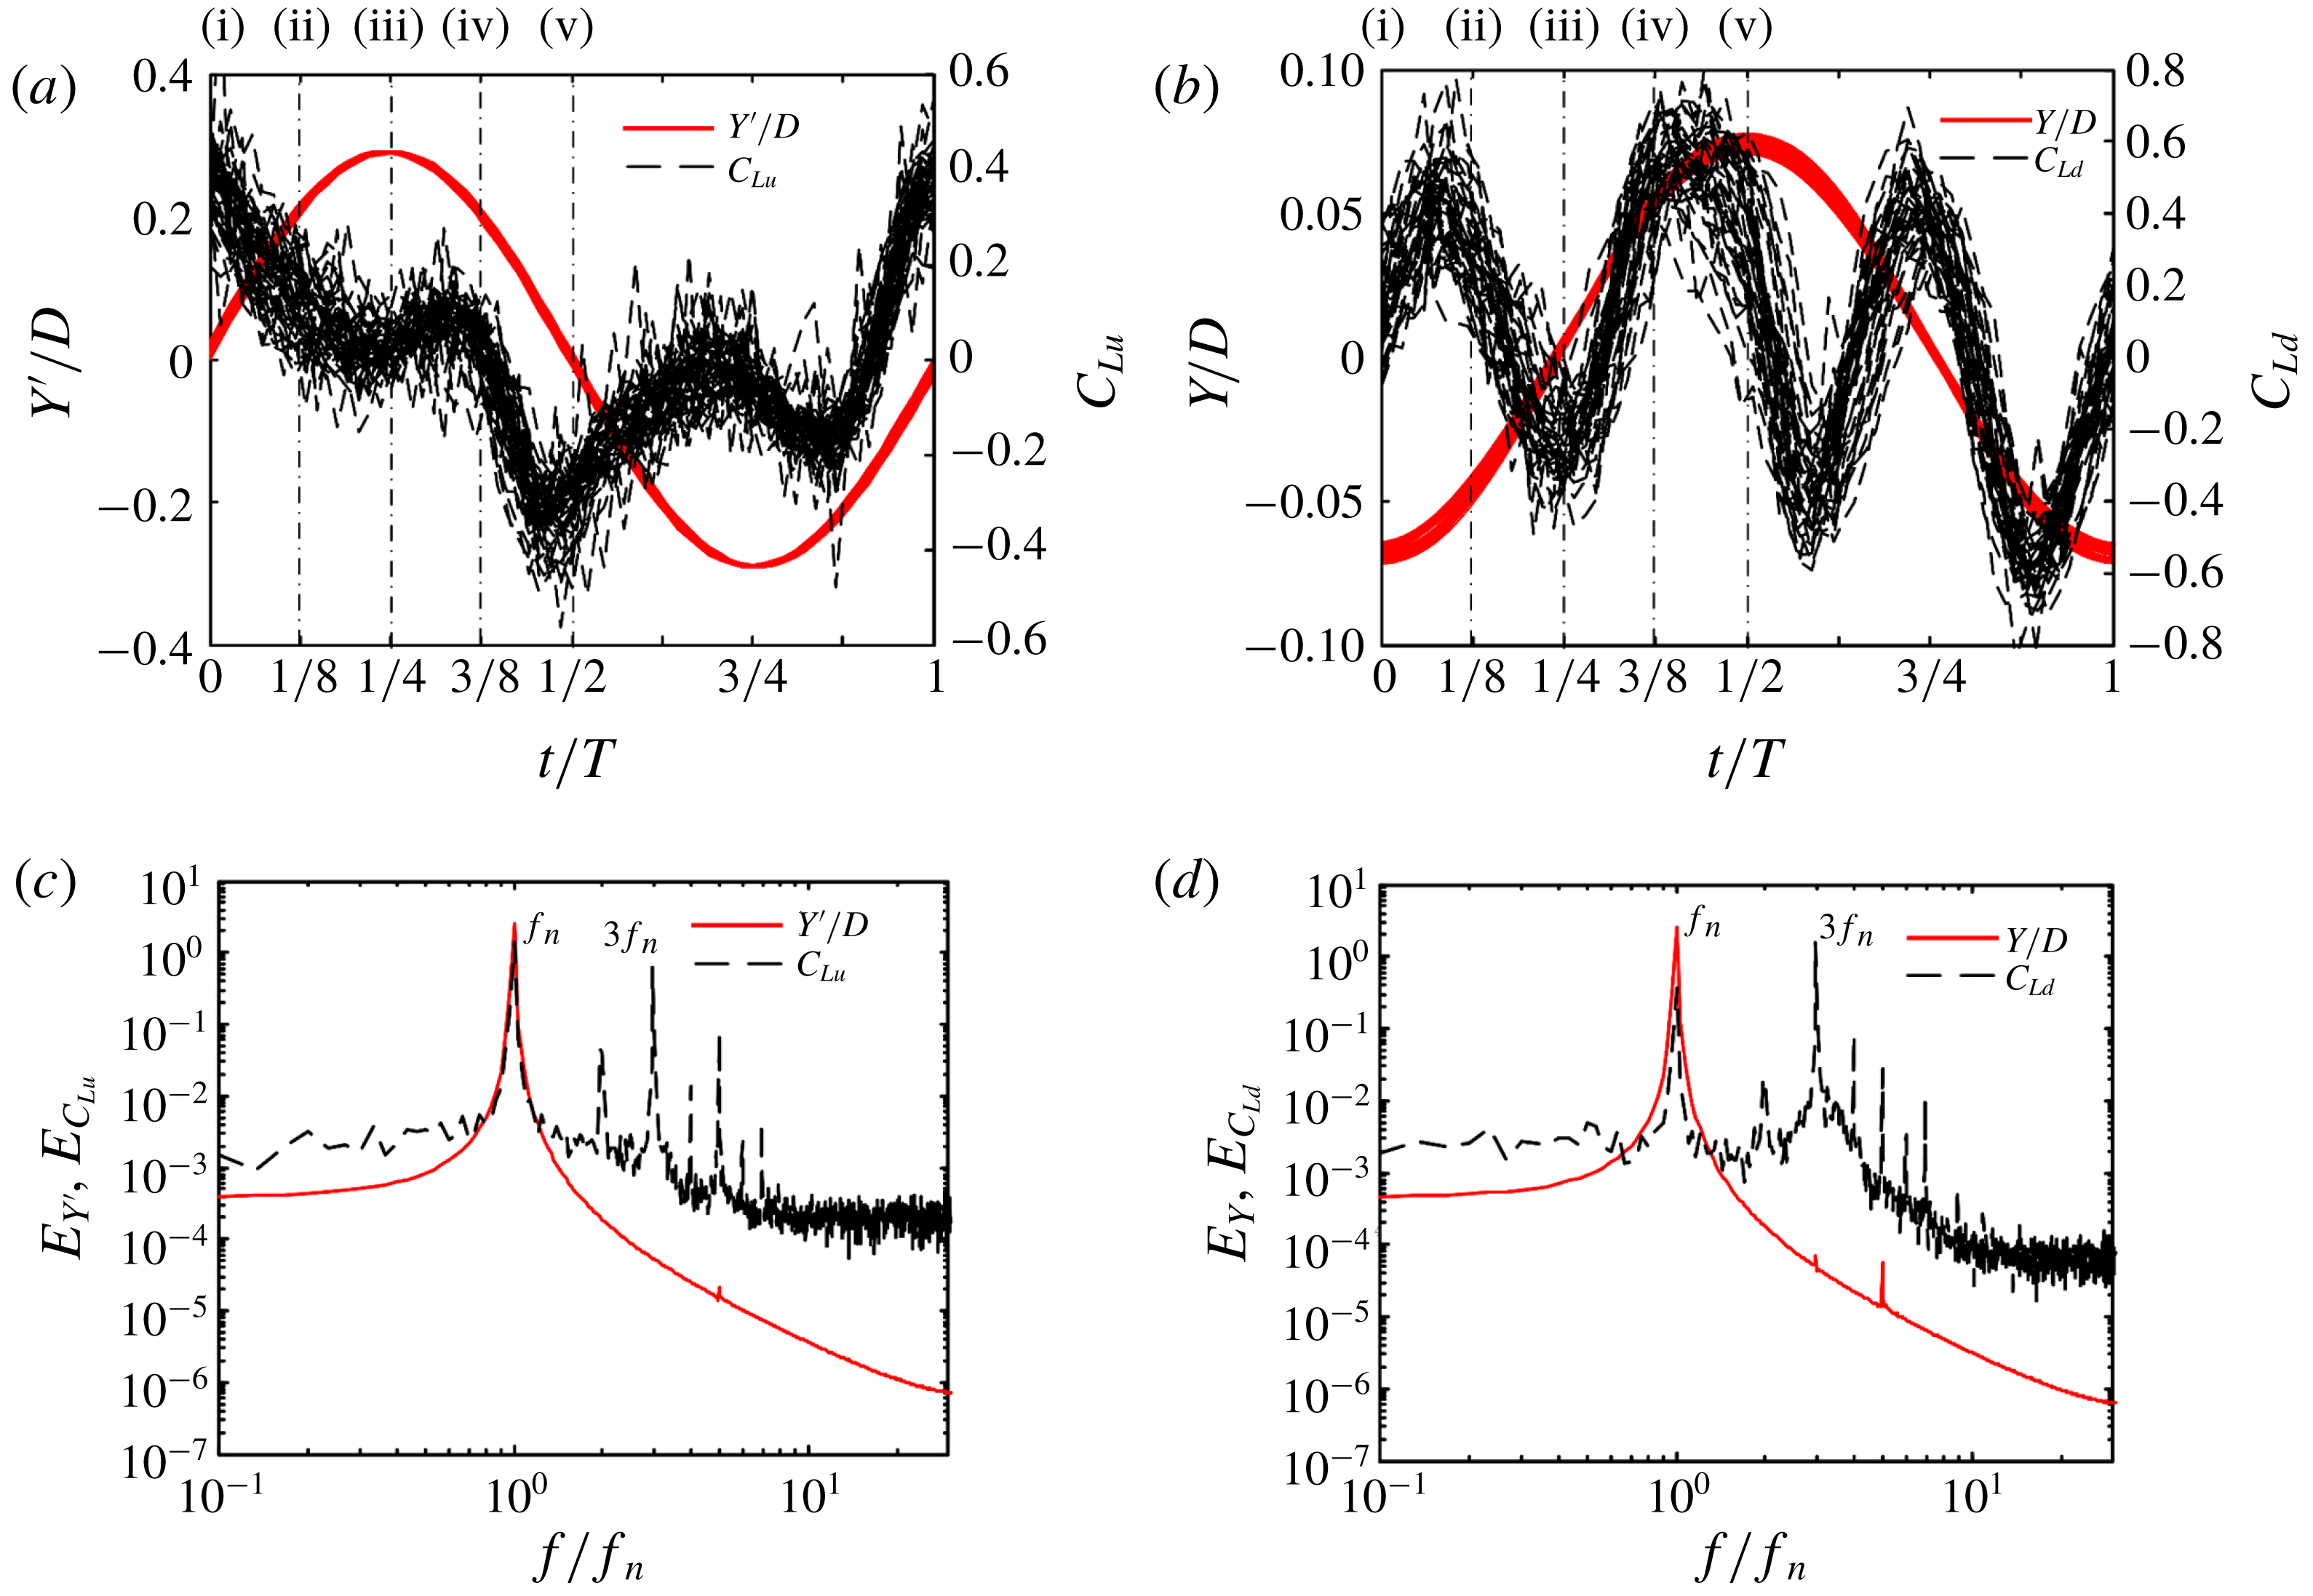
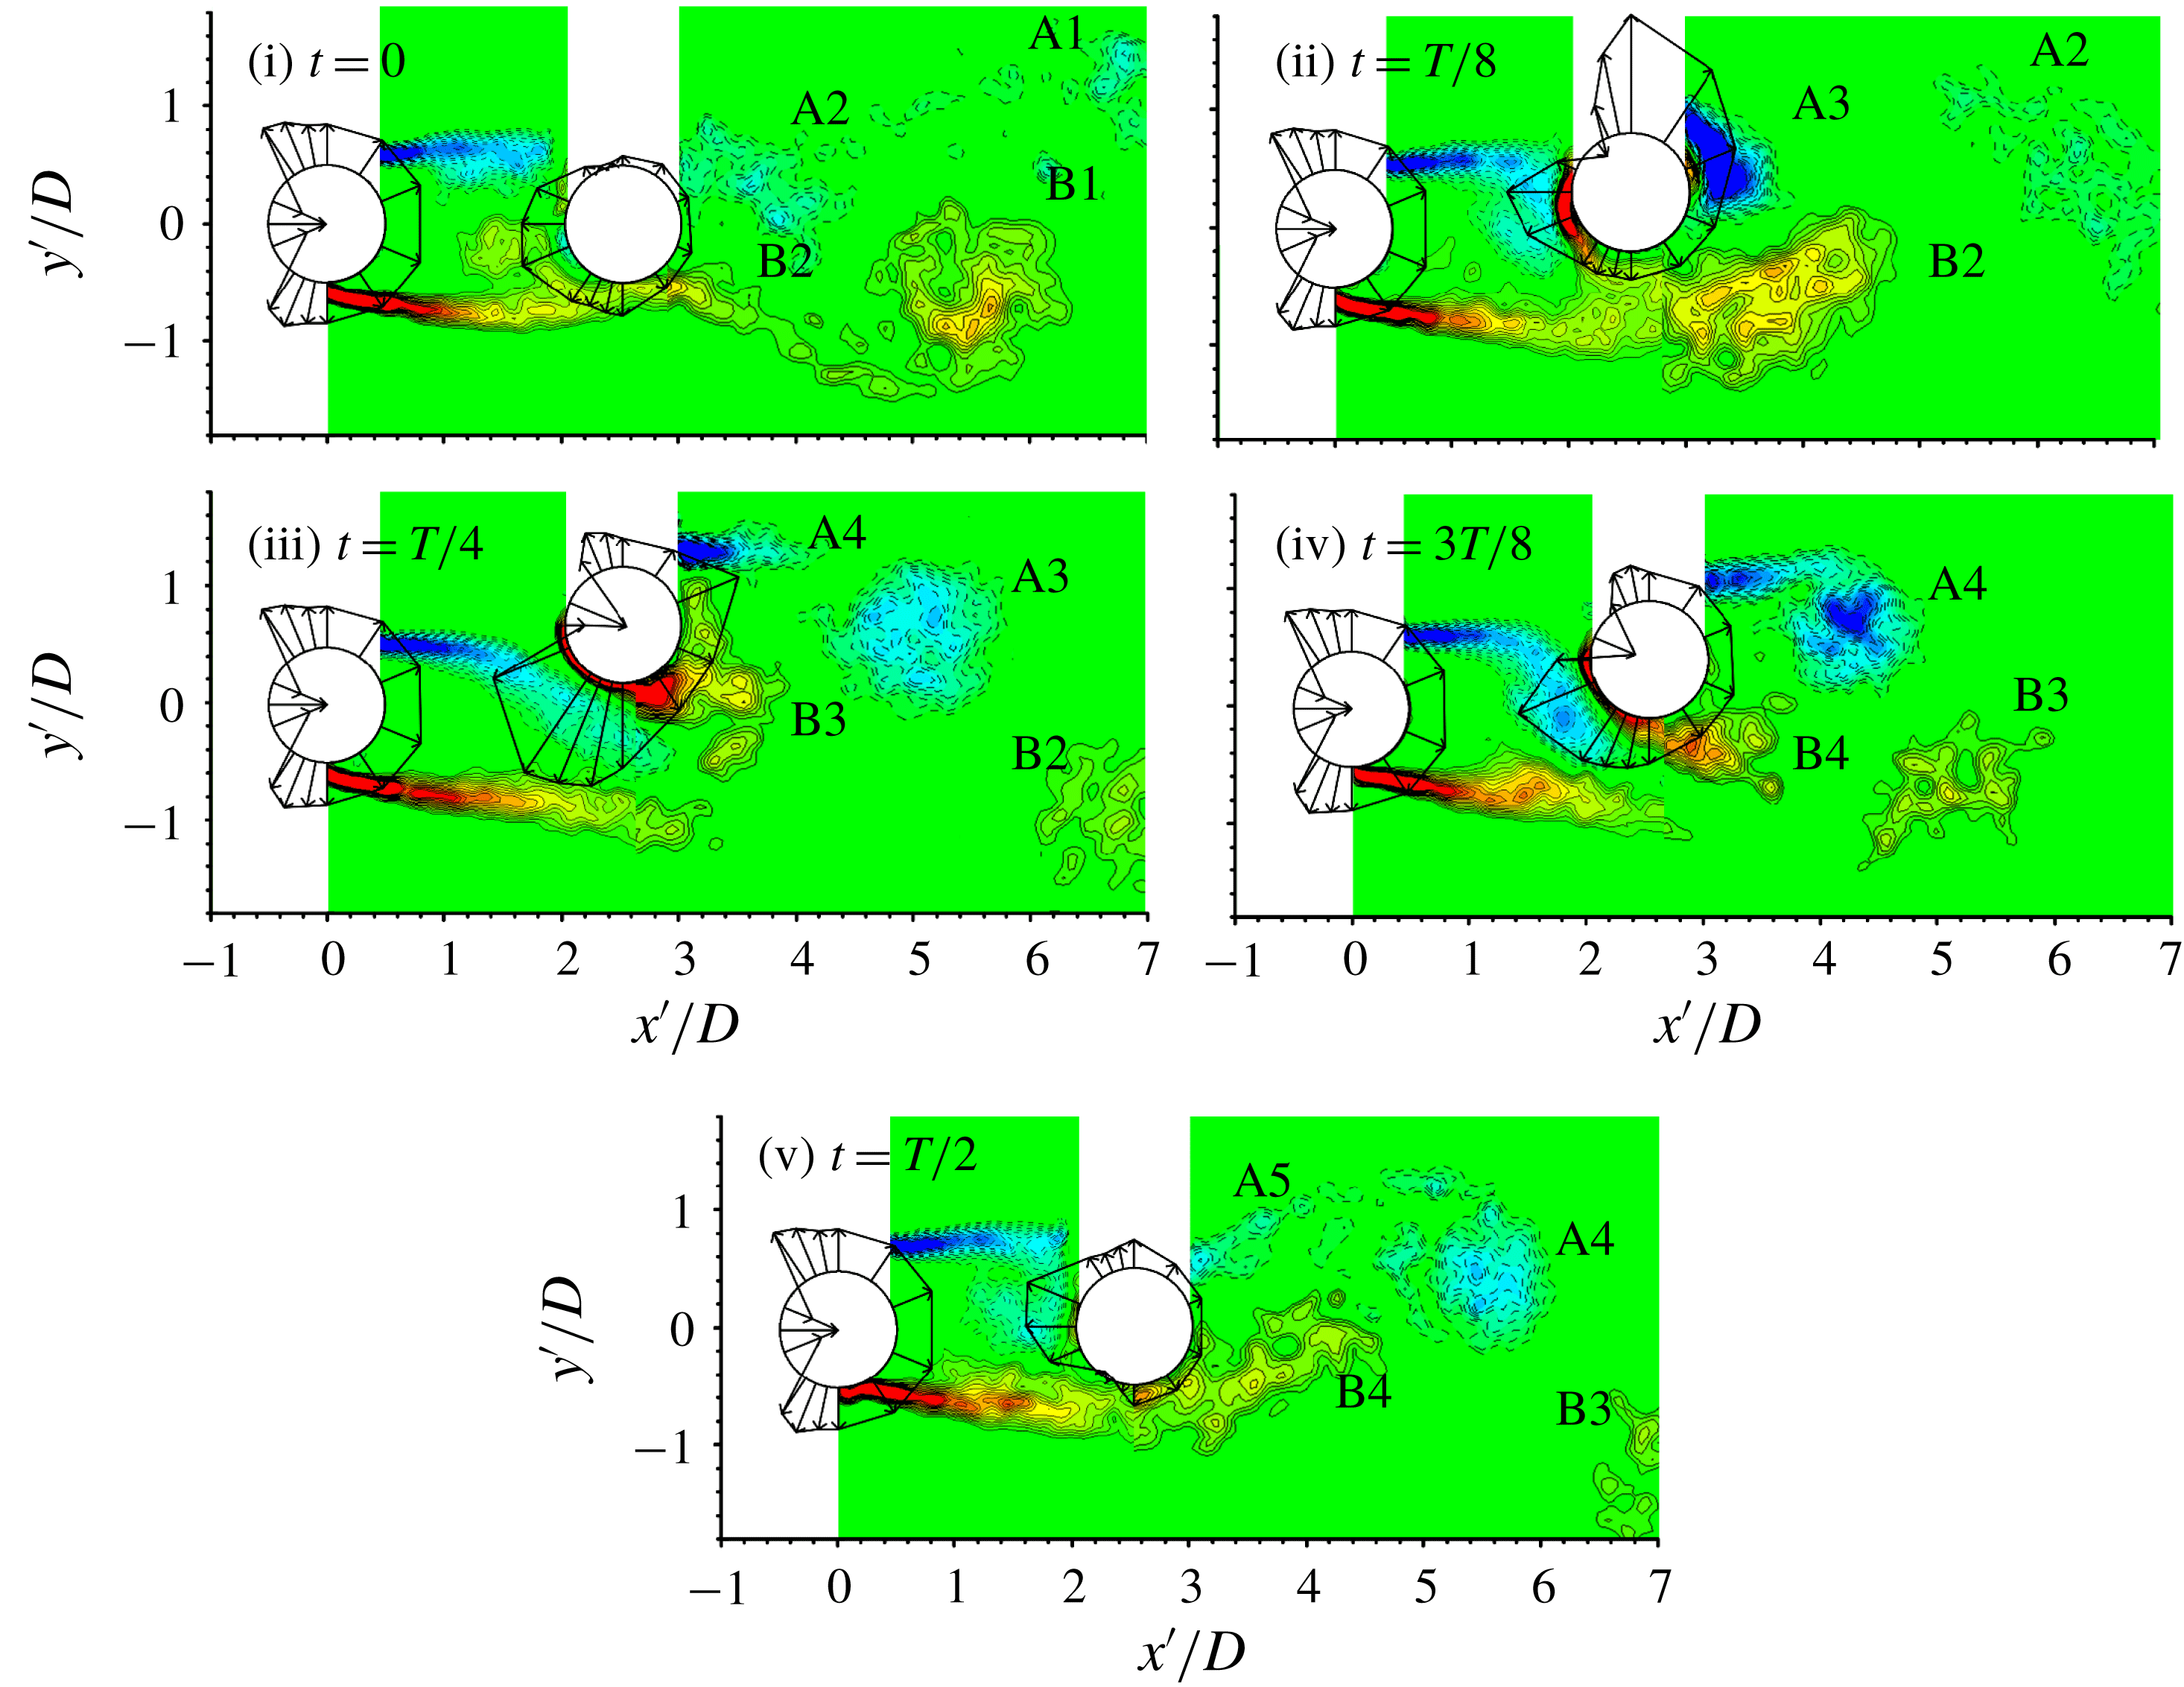
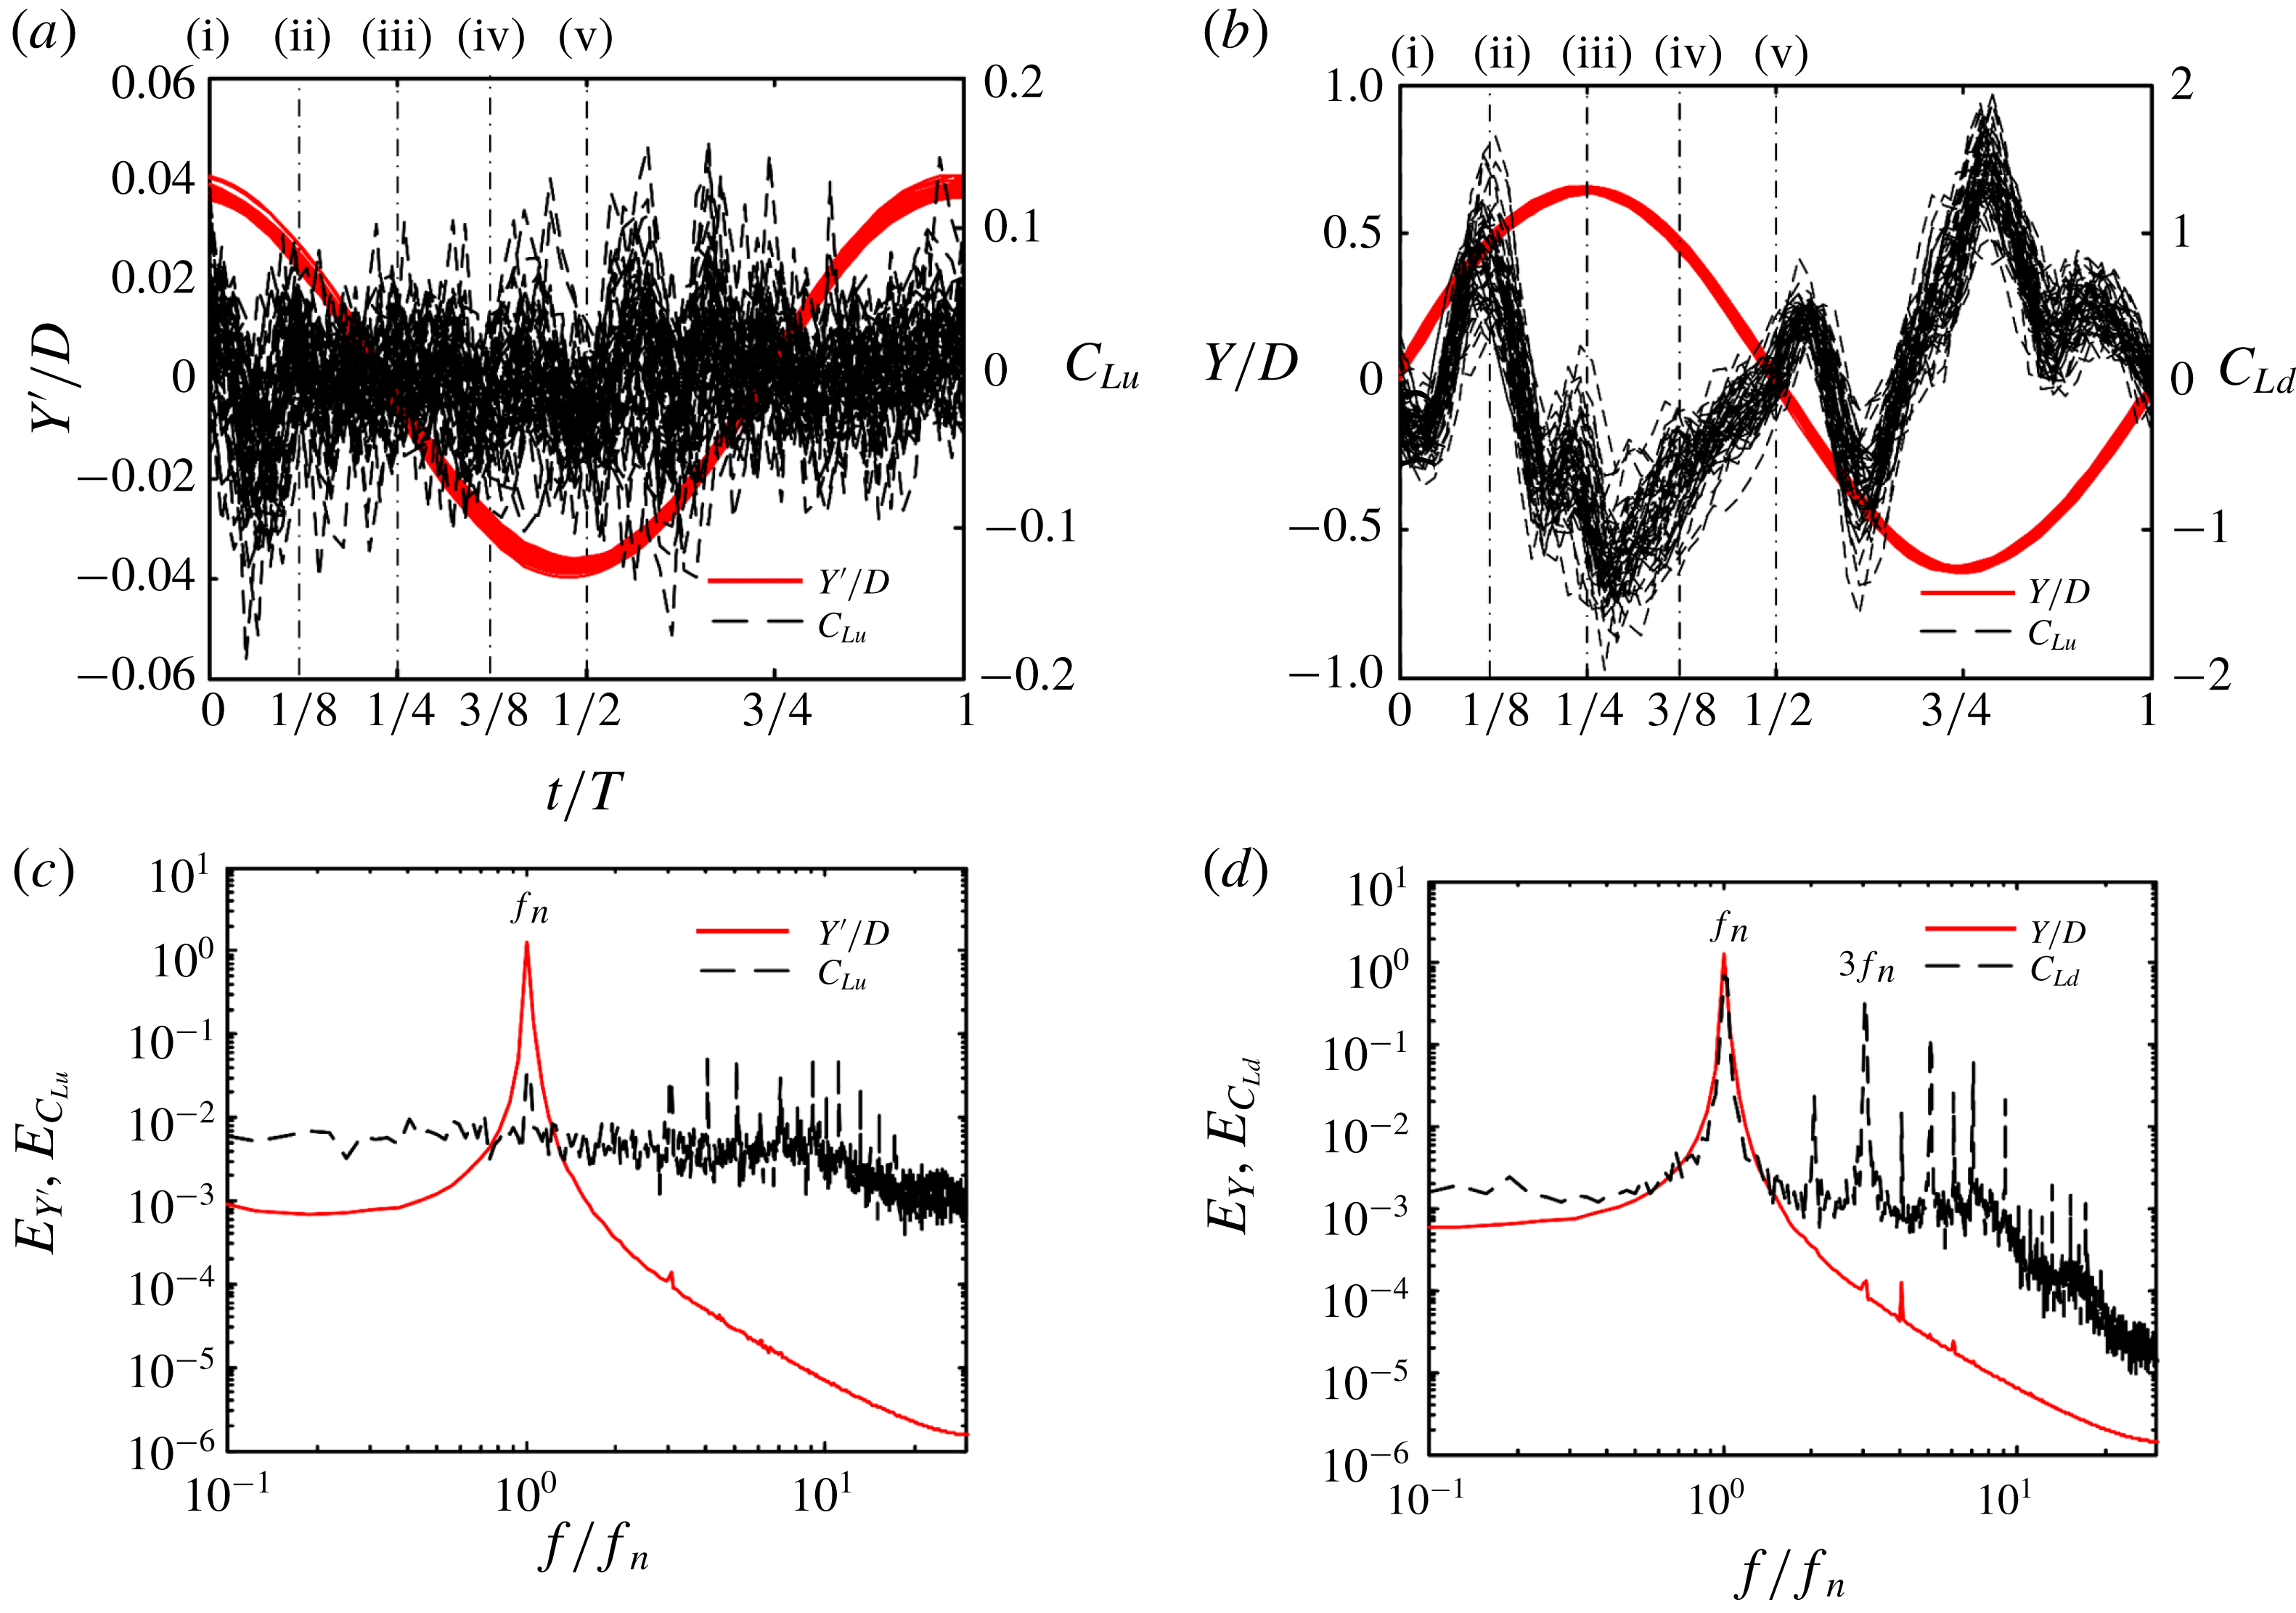
distributions around both cylinders are superimposed with the phase-averaged vorticity structures to explore the vibration mechanism, as shown in figure 10 (for instants i–v). Figure 11(a,b) shows the superimposed plots (50 cycles) of the cylinder displacement and lift force coefficient (
 $C_{Lu}$
for the upstream cylinder and
 $C_{Ld}$
for the downstream) in one oscillation cycle as a function of
 $t/T$
.
Phase-averaged vorticity contours and pressure coefficient
 $\langle C_{P}\rangle$
around cylinders in one half-cycle of the cylinder oscillation for instants (i)–(v). The contour cutoff levels are
 $\pm 0.4$
and the increment is 0.4.
 $L/D=1.5$
.
 $A_{u}^{\ast }=0.3$
and
 $A_{d}^{\ast }=0.07$
.

Superimposed plots (50 cycles) of displacement and lift force variations. (a)
 $Y^{\prime }/D$
and
 $C_{Lu}$
, and (b)
 $Y/D$
and
 $C_{Ld}$
. Power spectral density functions (c)
 $E_{Y^{\prime }}$
and
 $E_{C_{Lu}}$
, and (d)
 $E_{Y}$
and
 $E_{C_{Ld}}$
. The instants marked above the figures represent the instants of the snapshots in figure 10.
 $L/D=1.5$
.
 $A_{u}^{\ast }=0.3$
and
 $A_{d}^{\ast }=0.07$
.

At instant (i) in figure 10, the upper shear layer separated from the upstream cylinder reattaches onto the front-side surface of the downstream cylinder, leading to a maximum
 $\langle C_{P}\rangle \,(=0.175)$
at
 $\unicode[STIX]{x1D703}=56.25^{\circ }$
. Part of the reattached flow passes over the upper-side surface of the downstream cylinder and the other part impinges upon the front surface, both causing negative pressure on the surfaces in contact. As a result,
 $C_{Ld}$
on the downstream cylinder is above 0 (
 ${\approx}0{-}0.04$
, figure 11
b). For the upstream cylinder, the stagnation point occurs at
 $\unicode[STIX]{x1D703}=0^{\circ }$
, where
 $\langle C_{P}\rangle \approx 1$
. Due to the rollup of the upper shear layer in the gap, the negative pressure around the upper-rear surface of the upstream cylinder is associated with a larger magnitude than that around the lower-rear surface, resulting in a positive
 $C_{Lu}$
(figure 11
a). Shear layer separation or growth is accompanied by a higher velocity and a lower pressure (Nishimura & Taniike Reference Nishimura and Taniike2001; Alam Reference Alam2016). Similarly, the rollup of the upper gap shear layer may cause more negative pressure on the upstream cylinder than that of the lower shear layer. As the upstream cylinder moves upwards at instant (ii), the lower gap shear layer also rolls up with more negative pressure on the lower surface and less negative pressure on the upper surface. The
 $C_{Lu}$
thus decreases, though remaining above 0 (figure 11
a). When the upstream cylinder reaches the top and then moves down (instants iii and iv), the rollup of the lower gap shear layer, moving closer to the base of the upstream cylinder, generates pronouncedly negative pressure on the lower-rear surface. The value of
 $C_{Lu}$
is around 0 at instants (iii) and (iv). The pressure on the lower-rear surface becomes even more negative at instant (v) due to the strong rollup of the lower gap shear layer, along with less negative pressure on the upper-rear surface, giving rise to a highly negative
 $C_{Lu}$
(figure 11
a). On the whole, the rollup of the gap shear layers, largely affecting the pressure distribution on the side and rear surfaces of the upstream cylinder, contributes to the large vibration of the upstream cylinder. As the gap shear layer rollup near the base region of the upstream cylinder is connected to the upstream cylinder oscillation, not to vortex shedding behind the downstream cylinder, the upstream cylinder vibration does not stop or alter when the downstream cylinder is stationary (figure 7
a).
The phase-averaged velocity vectors at instants (i)
 $t=0$
and (v)
 $t=T/2$
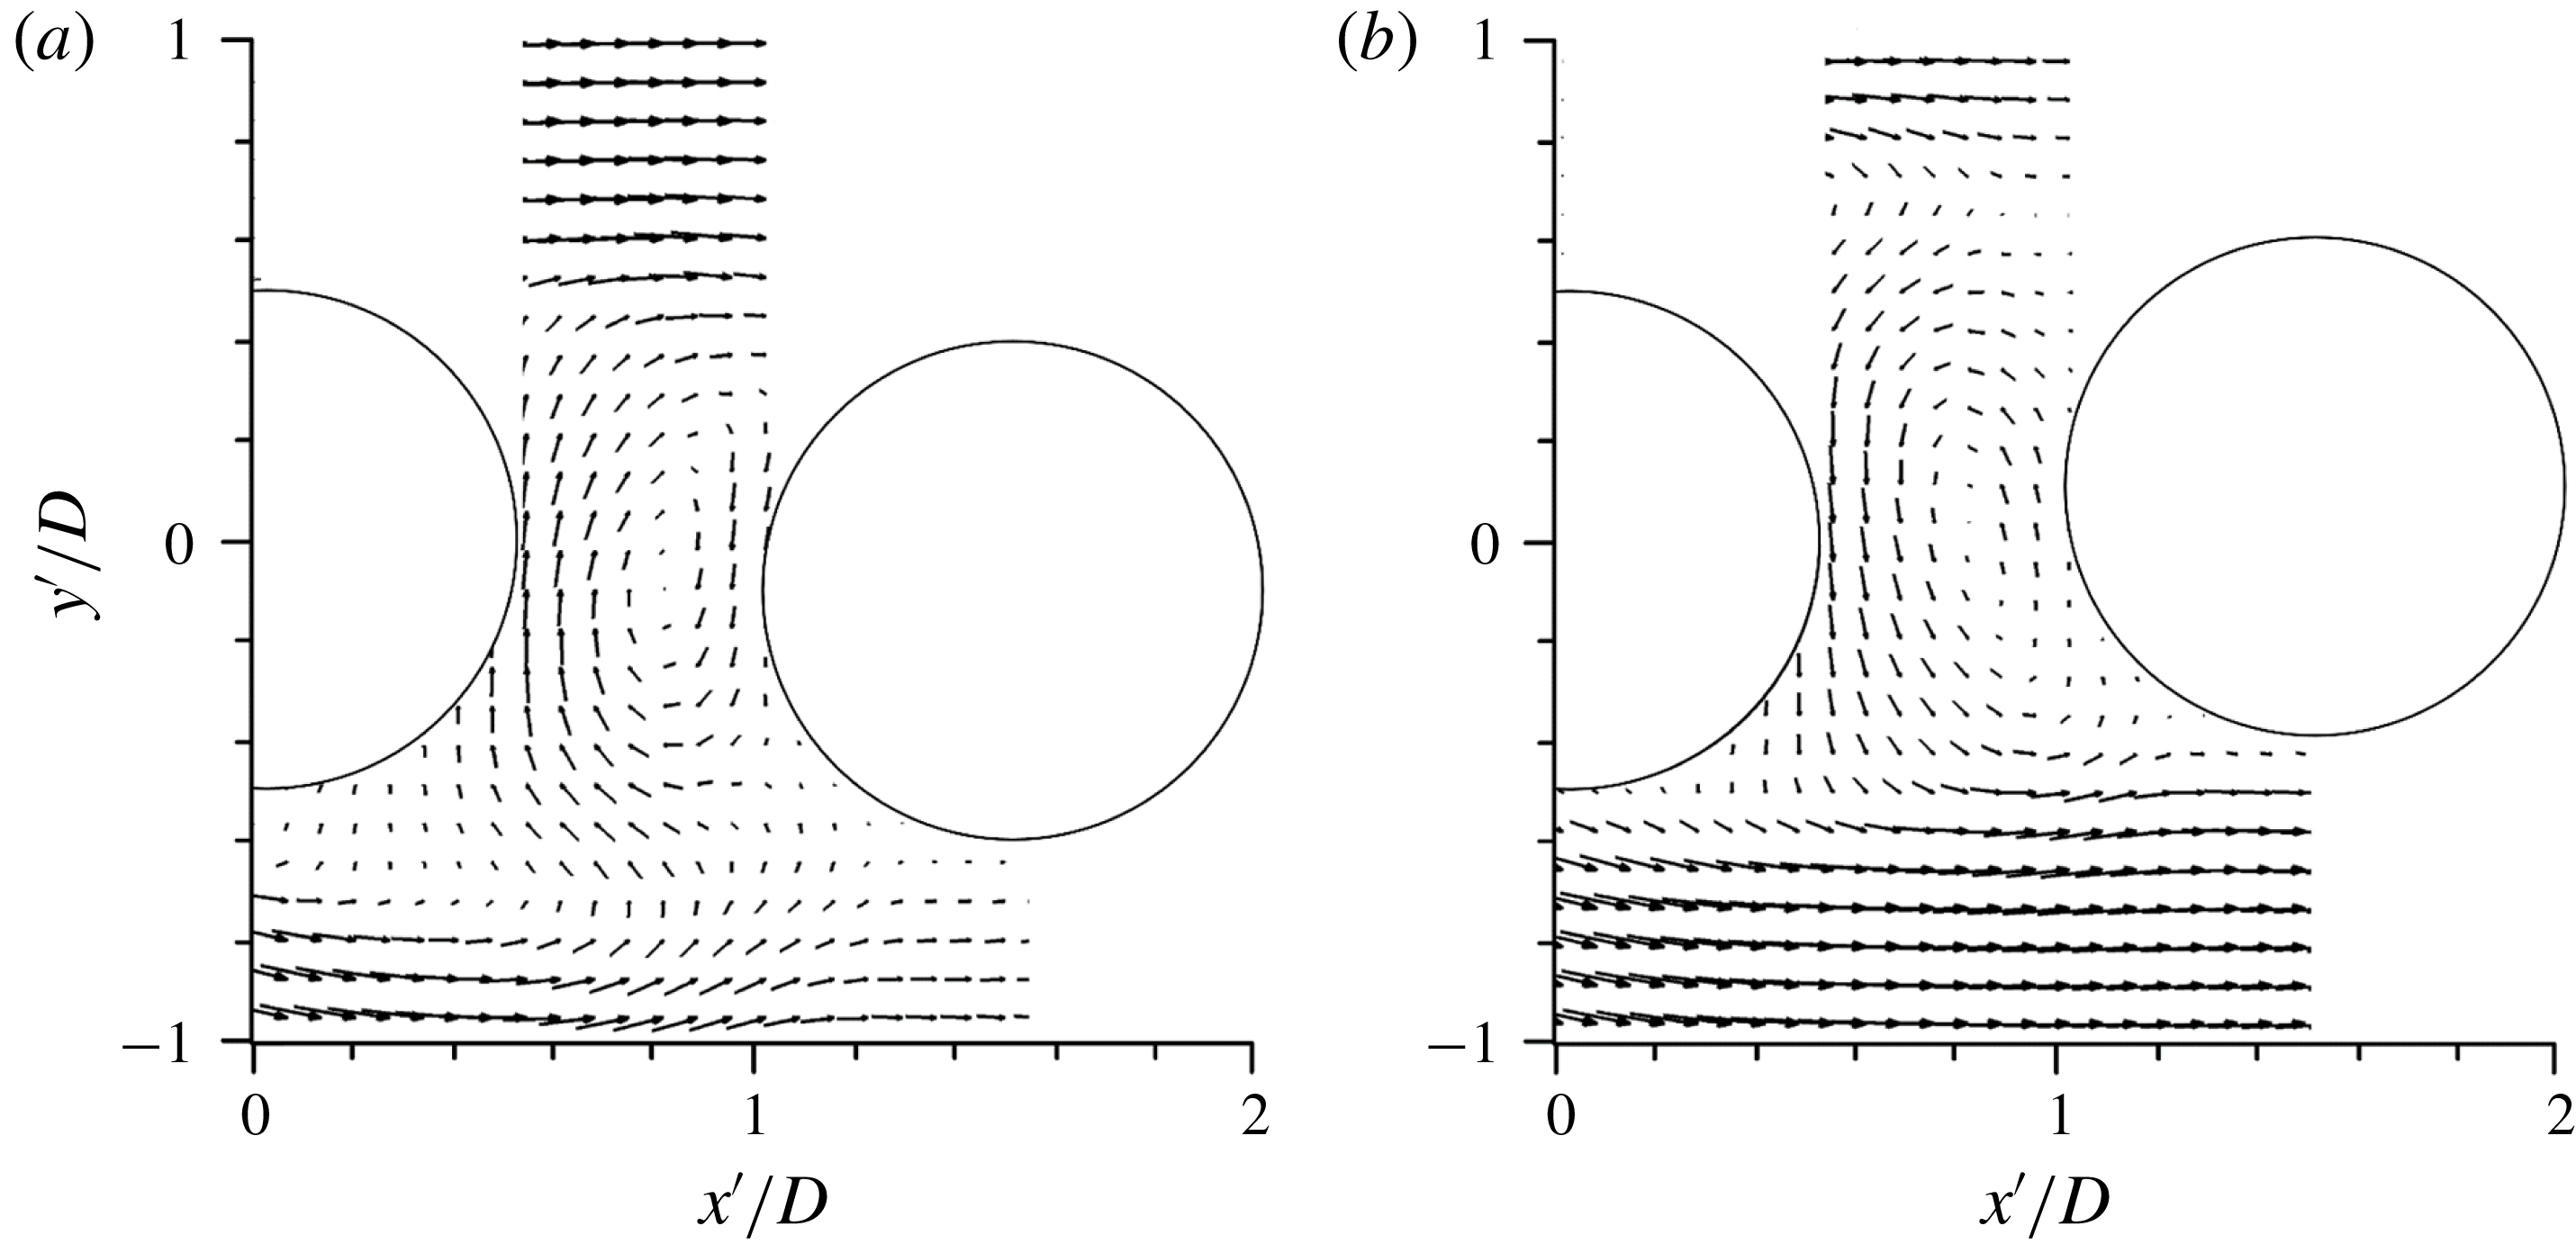
of figure 10 are presented in figure 12 to show clearly how the flow behaves in the gap. As shown at instant (i) in figure 10 at
 $t=0$
, the upper shear layer separated from the upstream cylinder reattaches onto the front surface of the downstream cylinder. Part of the reattached flow passes over the upper-side surface of the downstream cylinder and the other part impinges upon the front surface (figure 10, instant i), with a strong flow running downwards over the front surface (figure 12
a). A clockwise recirculation thus forms between the cylinders. The impinging flow corresponds to the negative pressure on the front surface (figures 10, instant i, 12
a). Similarly, at
 $t=T/2$
, where the lower shear layer is reattached (figure 10, instant v), the recirculation bubble is anticlockwise (figure 12
b), causing the negative pressure on the front surface (figure 10, instant v).
Phase-averaged velocity vectors at instants (a) instant (i)
 $t=0$
and (b) instant (v)
 $t=T/2$
in figure 10.
 $L/D=1.5$
.
 $A_{u}^{\ast }=0.3$
and
 $A_{d}^{\ast }=0.07$
.

The pressure pattern of the downstream cylinder seems more complicated. Due to the reattachment of the lower gap shear layer on the lower surface of the downstream cylinder, the maximum pressure occurs at
 $\unicode[STIX]{x1D703}=303.8^{\circ }$
, where
 $\langle C_{P}\rangle =-0.13$
, 0.48, and 0.13 for instants (iii), (iv) and (v), respectively. The value of
 $C_{Ld}$
is highly negative at instant (iii) but becomes highly positive at instant (iv), dropping slightly at instant (v) (figure 11
b). The complicated pressure pattern on the downstream cylinder arises from the interactions of the downstream cylinder with the gap shear layers as well as its own vortex shedding. The power spectral density functions
 $E_{Y^{\prime }}$
of
 $Y^{\prime }$
and
 $E_{C_{Lu}}$
of
 $C_{Lu}$
are presented in figures 11(c) and 11(d) for the upstream and downstream cylinders, respectively. Both
 $E_{Y^{\prime }}$
and
 $E_{Y}$
are characterized by one predominant peak at
 $f_{n}$
, while
 $C_{Lu}$
displays one more pronounced peak at
 $3f_{n}$
(figure 11
c). On the other hand, the pronounced peak at
 $3f_{n}$
in
 $E_{C_{Ld}}$
of
 $C_{Ld}$
on the downstream cylinder (figure 11
d) overwhelms that at
 $f_{n}$
. Obviously, the peak at
 $f_{n}$
is linked to the cylinder oscillation at
 $f_{n}$
and that at
 $3f_{n}$
is connected to the shedding of six vortices in one cycle of the cylinder oscillation, as explained in figure 8. Overall,
 $C_{Lu}$
is dominated by the oscillation frequency (
 $=f_{n}$
) (figure 11
a,c) that is connected with the rollup of the shear layers, though the fluctuation at
 $3f_{n}$
is obviously captured in
 $C_{Ld}$
(figure 11
b,d), which is linked to the shedding of six vortices in one cycle of the cylinder oscillation. Interestingly, although the maximum value of
 $C_{Ld}$
(
 ${\approx}$
0.8) is larger than that of
 $C_{Lu}$
(
 ${\approx}$
0.6), the amplitude of
 $Y^{\prime }/D$
(
 ${\approx}0.3$
) is much bigger than the amplitude of
 $Y/D$
(
 ${\approx}0.07$
) (figure 11
a,b). The large vibration of the upstream cylinder will be elaborated in the next section in terms of energy transfer from the flow to the upstream cylinder.
6.4 Work done
Whether a vibration is sustainable depends on the energy transfer between the flow and cylinder, which is subsequently linked to the way vortices are separated from the cylinder. It is important to understand the work done on the upstream cylinder by
 $C_{Lu}$
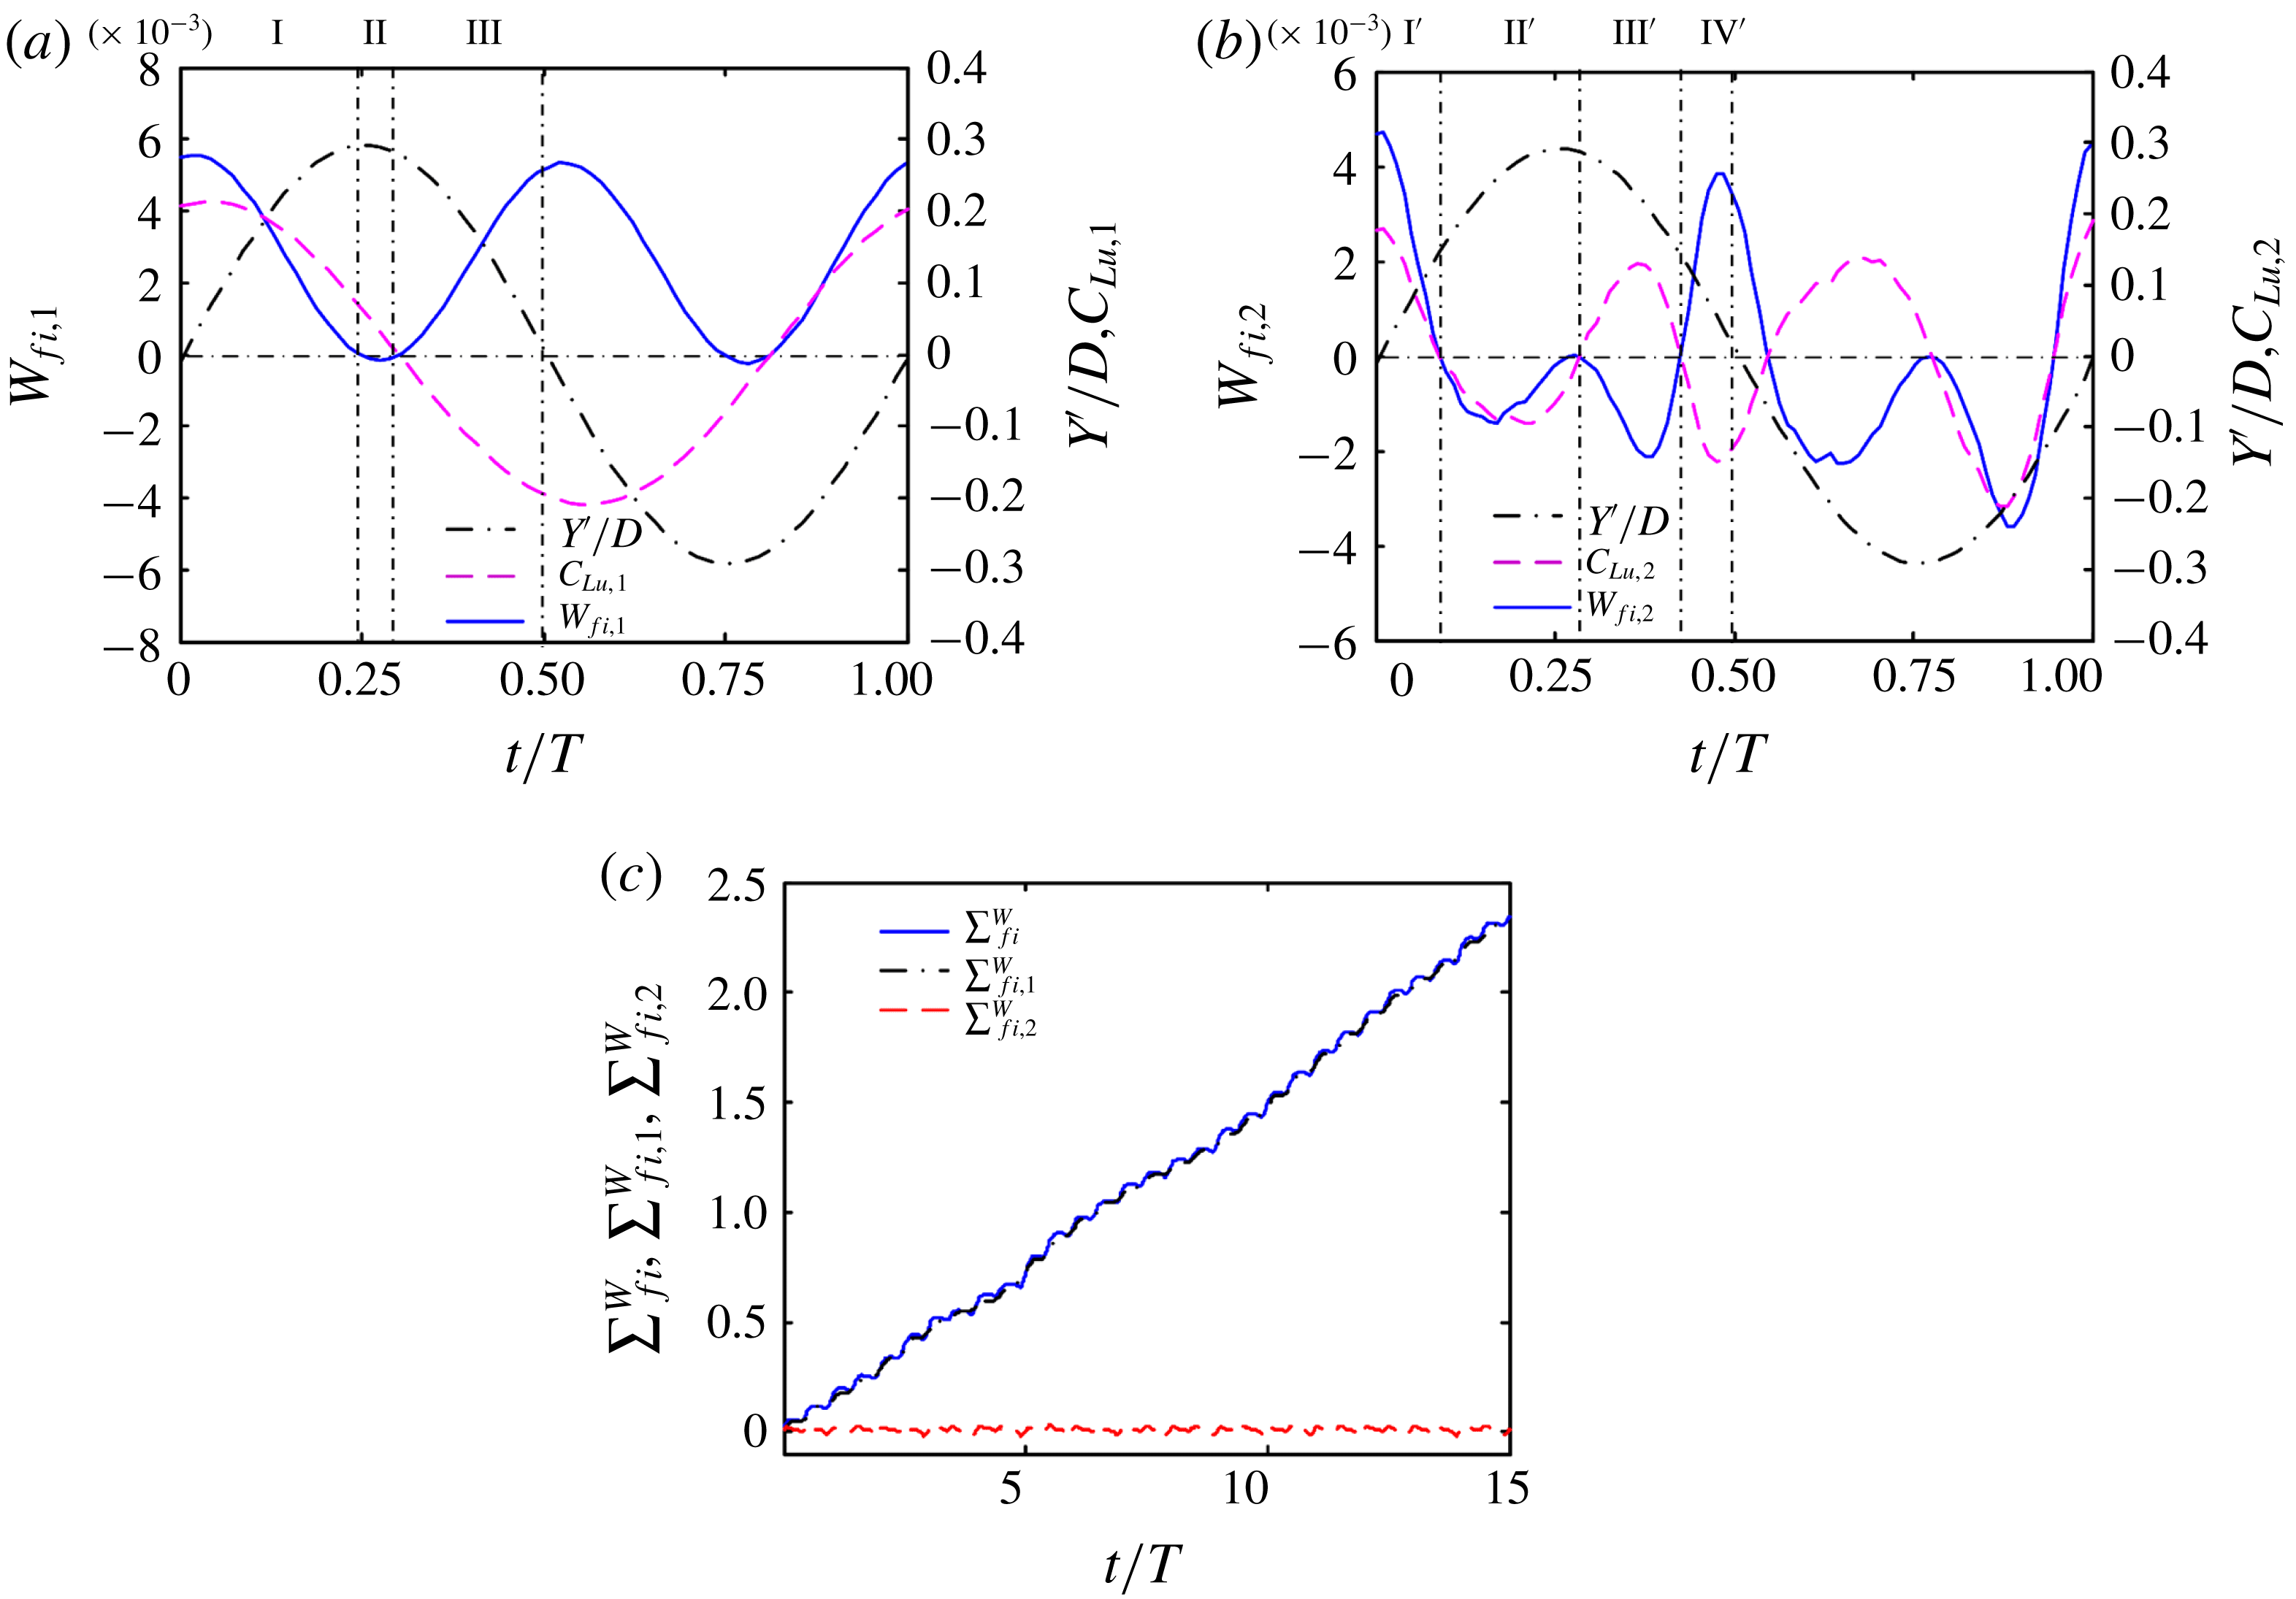
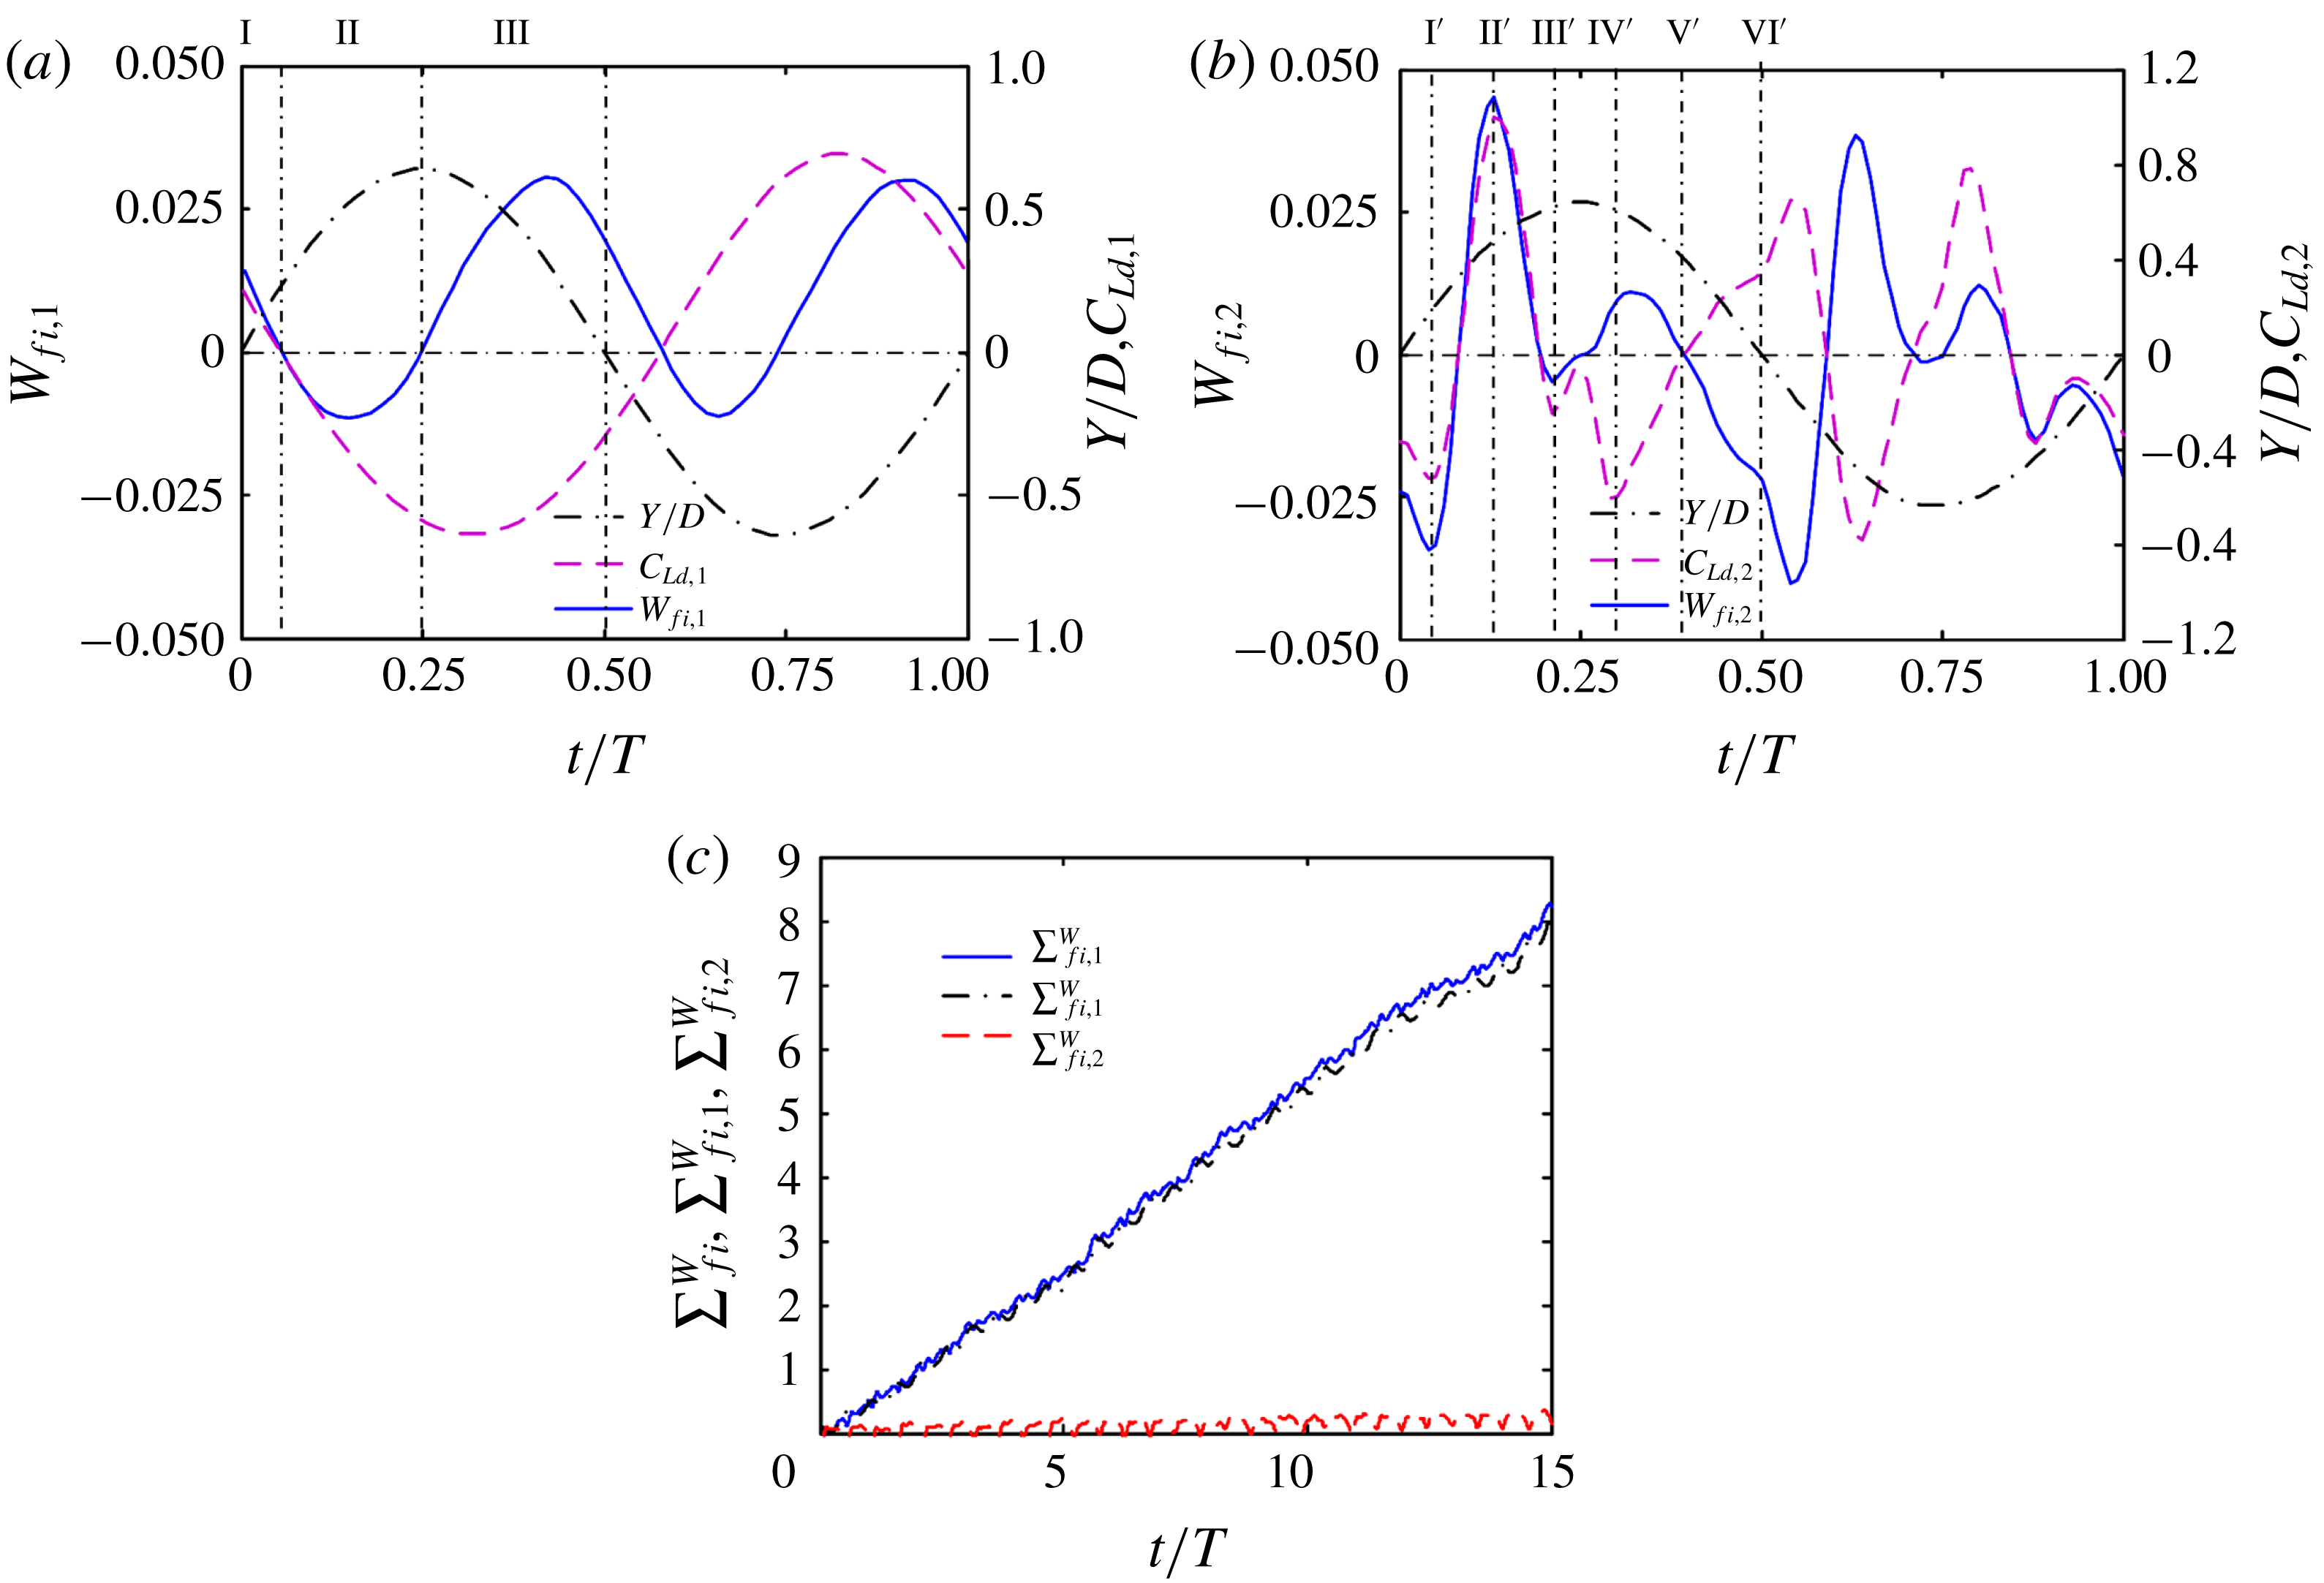
during its vibration. Figure 13(a,b) presents the temporal evolution of instantaneous work done for the upstream cylinder,
 $W_{fi}\,(=C_{Lu}\times d(Y^{\prime }/D))$
in one cycle of oscillation, where subscripts 1 and 2 denote
 $C_{Lu}$
containing the oscillation frequency and vortex shedding frequency components, respectively. More specifically,
 $C_{Lu,1}$
is the 20 Hz low-pass-filtered
 $C_{Lu}$
, and
 $C_{Lu,2}=C_{Lu}-C_{Lu,1}$
. Note that
 $C_{Lu}$
is first low-pass-filtered at
 $4f_{n}$
, which is larger than the vortex shedding frequency to exclude the high-frequency noise. As discussed before, the violent vibration of the upstream cylinder may be connected to the reattached shear layer rollup near the base of the upstream cylinder, the rollup frequency being the oscillation frequency. Thus,
 $W_{fi,1}\,(=C_{Lu,1}\times d(Y^{\prime }/D))$
can be considered as the work done by the gap shear layers and
 $W_{fi,2}\,(=C_{Lu,2}\times d(Y^{\prime }/D))$
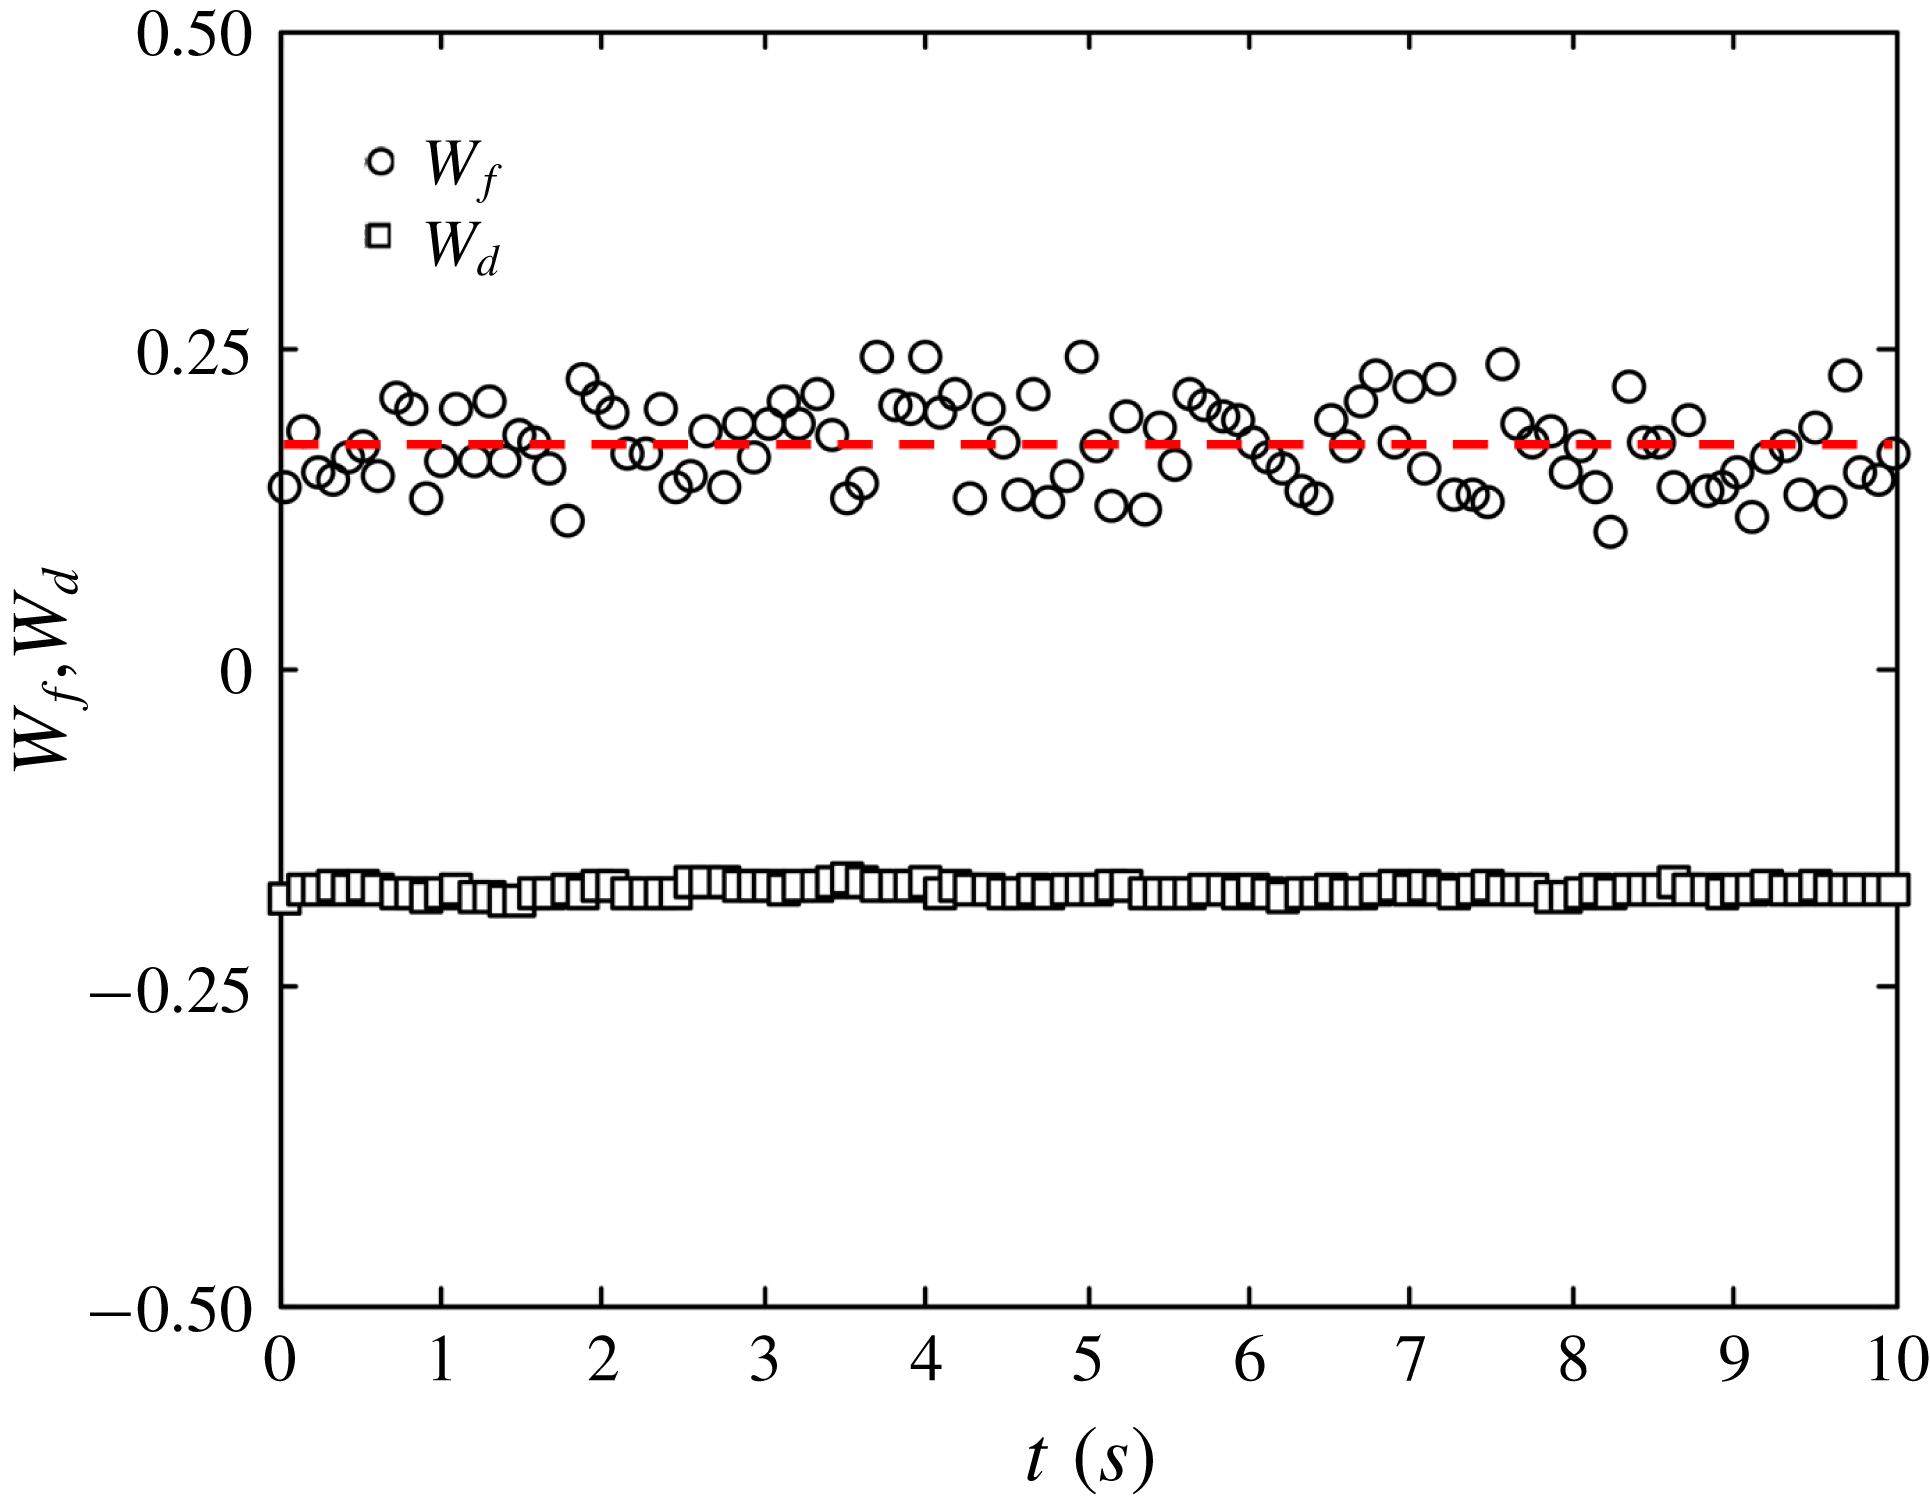
as the work done by vortices shed during the cylinder oscillation. Positive and negative work done indicate the flow acting to excite and dampen the vibration, respectively. In other words, positive work done means the cylinder receives energy from the flow, while the energy transfer is opposite given negative work done.
(a,b) Time histories of
 $Y^{\prime }/D$
,
 $C_{Lu}$
and
 $W_{fi}$
in one cycle of the upstream cylinder vibration. (c) Variations in
 $\sum W_{fi}$
,
 $\sum W_{fi,1}$
, and
 $\sum W_{fi,2}$
in fifteen cycles. The subscripts 1 and 2 denote the
 $C_{Lu}$
or
 $W_{fi,}$
containing the oscillation frequency and vortex shedding frequency components, respectively.
 $L/D=1.5$
.
 $A_{u}^{\ast }=0.3$
and
 $A_{d}^{\ast }=0.07$
.

As presented in figure 13(a),
 $C_{Lu,1}$
increases slightly, reaching a maximum value at
 $t/T=0.04$
, and then decreases to approximately 0.07 as the upstream cylinder increases from
 $Y^{\prime }/D=0$
to 0.3 (maximum). The positive
 $W_{fi,1}$
increases first for
 $t/T=0{-}0.02$
 $(Y^{\prime }/D=0{-}0.02)$
and then decreases until
 $t/T=0.25$
(process I, marked at the top of figure 13
a). The cylinder absorbs the largest amount of energy at
 $t/T=0.02$
, where the reattachment, rollup and separation of the upper shear layer in the gap take place to generate the positive
 $C_{Lu,1}$
(figures 10 instant i, 13
a). With an increase in
 $Y^{\prime }/D$
, the cylinder receives less energy because the upper gap shear layer is detached from the downstream cylinder, resulting in less circulation in the gap (figure 10ii, iii) and decreasing
 $C_{Lu,1}$
(figure 13
a). When the cylinder moves downwards from the top to
 $Y^{\prime }/D=0.28$
,
 $W_{fi,1}$
becomes negative, just below zero, for a short duration (process II). Then,
 $W_{fi,1}$
becomes positive again and increases as the cylinder continues drop downwards to the centreline (process III). Obviously, the reattachment, rollup and separation of the lower shear layer take place now in the gap, generating negative
 $C_{Lu,1}$
to drive the cylinder in the same direction. As such,
 $W_{fi,1}$
increases until the cylinder reaches its centreline
 $(Y^{\prime }/D=0)$
position. The work done or
 $W_{fi,1}$
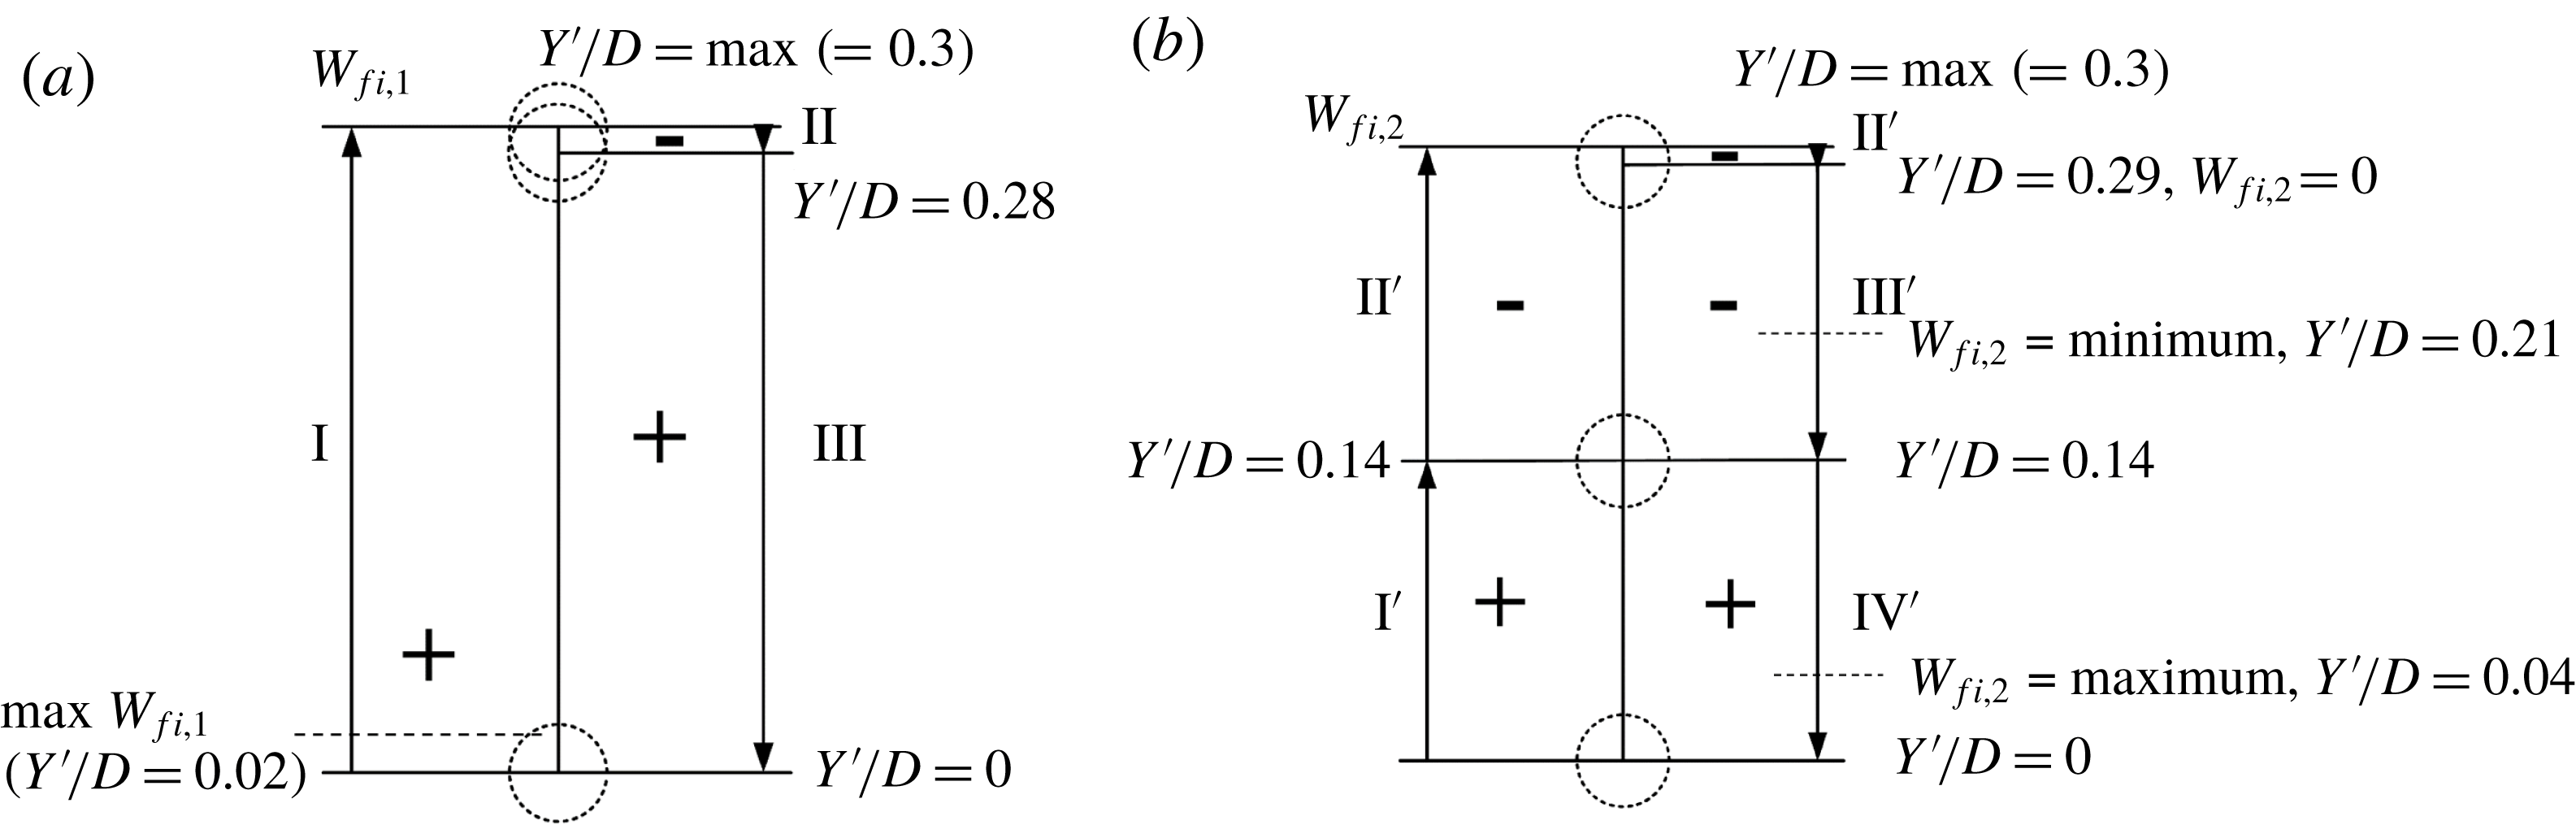
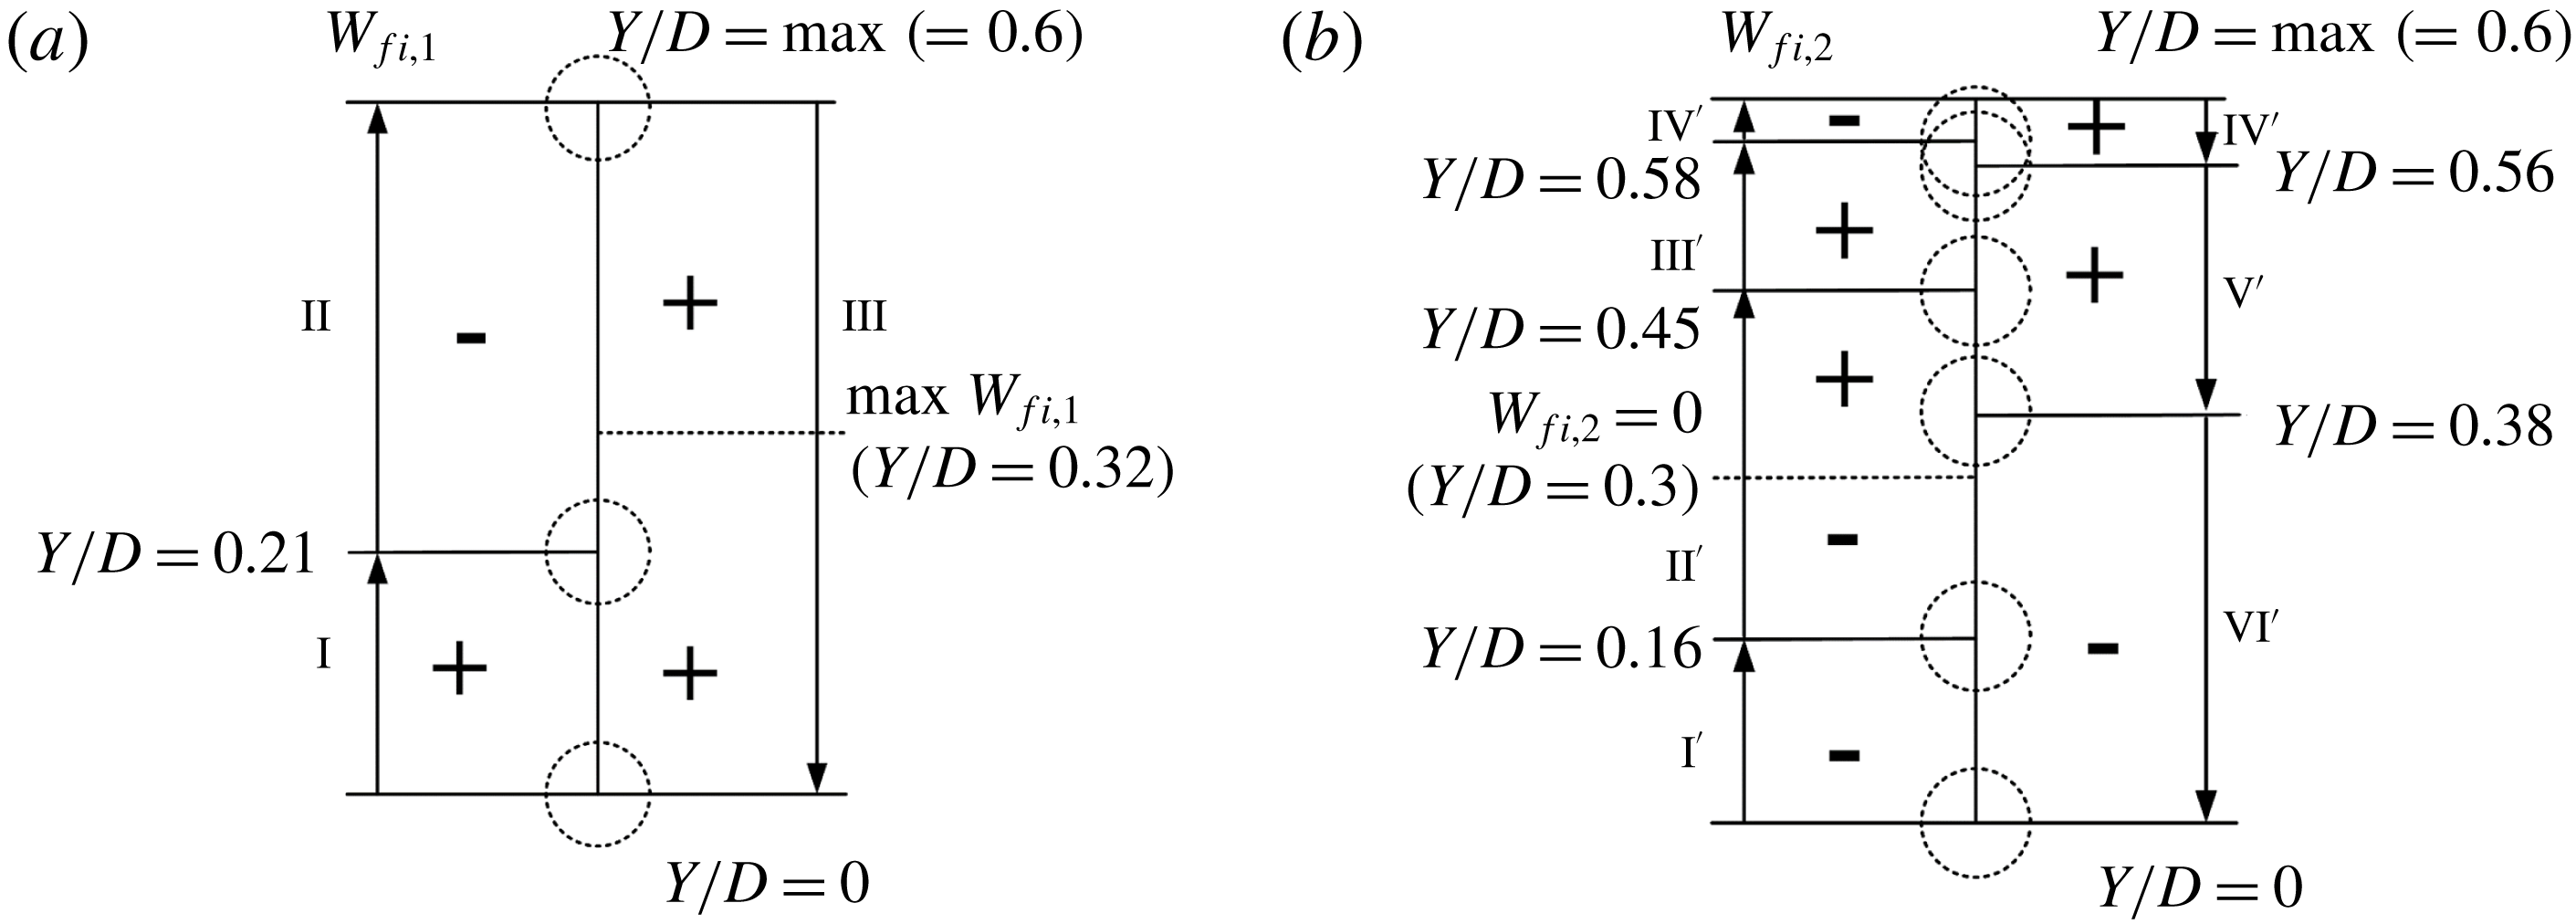
is summarized in figure 14(a). The cylinder receives energy from the flow when moving upwards to the maximum
 $Y^{\prime }/D$
(process I). As the cylinder moves from the top to
 $Y^{\prime }/D=0.28$
, the work done is negative, slightly below zero. As the cylinder moves downwards from
 $Y^{\prime }/D=0.28$
to
 $Y^{\prime }/D=0$
,
 $W_{fi,1}$
becomes positive again. The observation suggests that the rollup of the gap shear layers around the rear surface of the upstream cylinder contributes to the positive work done from the flow to the cylinder for almost the entire process, supporting the vibration. The upstream cylinder vibration may also be affected by vortex shedding from the downstream cylinder as the two cylinders are closely separated. The time-averaged value of
 $W_{fi,1}$
is positive, indicating that the vibration may be sustained with the cylinder absorbing energy at
 $f_{n}$
.
Sketch for the signs of work done in one half-cycle of the upstream cylinder oscillation (a)
 $W_{fi,1}$
, (b)
 $W_{fi,2}$
.
 $L/D=1.5$
.
 $A_{u}^{\ast }=0.3$
and
 $A_{d}^{\ast }=0.07$
.

As to
 $W_{fi,2}$
, four processes can be identified for one half-cycle of oscillation, as indicated at the top of figure 13(b). There are approximately three oscillations of
 $C_{Lu,2}$
in one period of the cylinder vibration, suggesting the fluctuation in
 $C_{Lu,2}$
is connected to the six vortices shed in one vibration cycle, as described above. Naturally, the reattachment may make the fluctuating period of
 $C_{Lu,2}$
non-uniform. The largest energy absorbed by the cylinder occurs at
 $Y^{\prime }/D=0$
, where the shedding of vortex A2
 $^{\prime }$
makes
 $C_{Lu,2}$
positive (figure 10, instant i). When the cylinder moves upwards to
 $Y^{\prime }/D=0.14$
, both
 $C_{Lu,2}$
and
 $W_{fi,2}$
drop to 0 (process I
 $^{\prime }$
). The growth of vortex B3 (figure 10, instants i and ii) is linked to the decay of
 $C_{Lu,2}$
as well as
 $W_{fi,2}$
. With the cylinder continuing to move to the top and then goes down slightly to
 $Y^{\prime }/D=0.29$
, the negative
 $C_{Lu,2}$
dwindles and then augments; so does
 $W_{fi,2}$
(process II
 $^{\prime }$
). The growth of B3 generates negative lift resisting the upward motion (figure 10, instants ii and iii), which is responsible for the further decrease in
 $W_{fi,2}$
in the first half of process II
 $^{\prime }$
. On the other hand,
 $W_{fi,2}$
increases in the second half of process II
 $^{\prime }$
because of the growth and shedding of A3 (figure 10, instant iii). The
 $C_{Lu,2}$
that arises to its maximum then diminishes, while the negative
 $W_{fi,2}$
decreases and then increases when the cylinder shifts to
 $Y^{\prime }/D=0.14$
(process III
 $^{\prime }$
). The process involves the growth and amalgamation of B3 and B4. In process IV
 $^{\prime }$
, where
 $C_{Lu,2}$
becomes negative and drives the cylinder in the same direction,
 $W_{fi,2}$
goes up rapidly from 0, and the shedding of B3
 $^{\prime }$
contributes to the work done. The work done or
 $W_{fi,2}$
is summarized in figure 14(b). The
 $W_{fi,2}$
is positive when the cylinder is near the centreline but becomes negative when the cylinder is away from the cylinder. In other words, positive
 $W_{fi,2}$
is associated with vortices A2
 $^{\prime }$
and B3
 $^{\prime }$
, while the most negative
 $W_{fi,2}$
results from A3 with the cylinder moving from the top (figures 10, instants ii and iv; 13
b, 14
b). This explains why A3 persists downstream and A2
 $^{\prime }$
and B3
 $^{\prime }$
diminish more rapidly than A3 (figure 9).
The cumulative work
 $\sum W_{fi}\,(=\sum C_{Lu}\times d(Y^{\prime }/D))$
in fifteen cycles is presented in figure 13(c) to understand how
 $W_{fi,1}$
and
 $W_{fi,2}$
contribute to sustaining of the cylinder vibration. Obviously,
 $\sum W_{fi,1}$
for fifteen cycles is approximately 2.3 at
 $t/T=15$
, essentially the same as
 $\sum W_{fi}$
since
 $\sum W_{fi,2}\approx 0$
. The observation indicates that energy transferred from the flow to the cylinder to compensate the energy dissipation by fluid–structure system damping is largely contributed from
 $\sum W_{fi,1}$
, rather than
 $\sum W_{fi,2}$
.
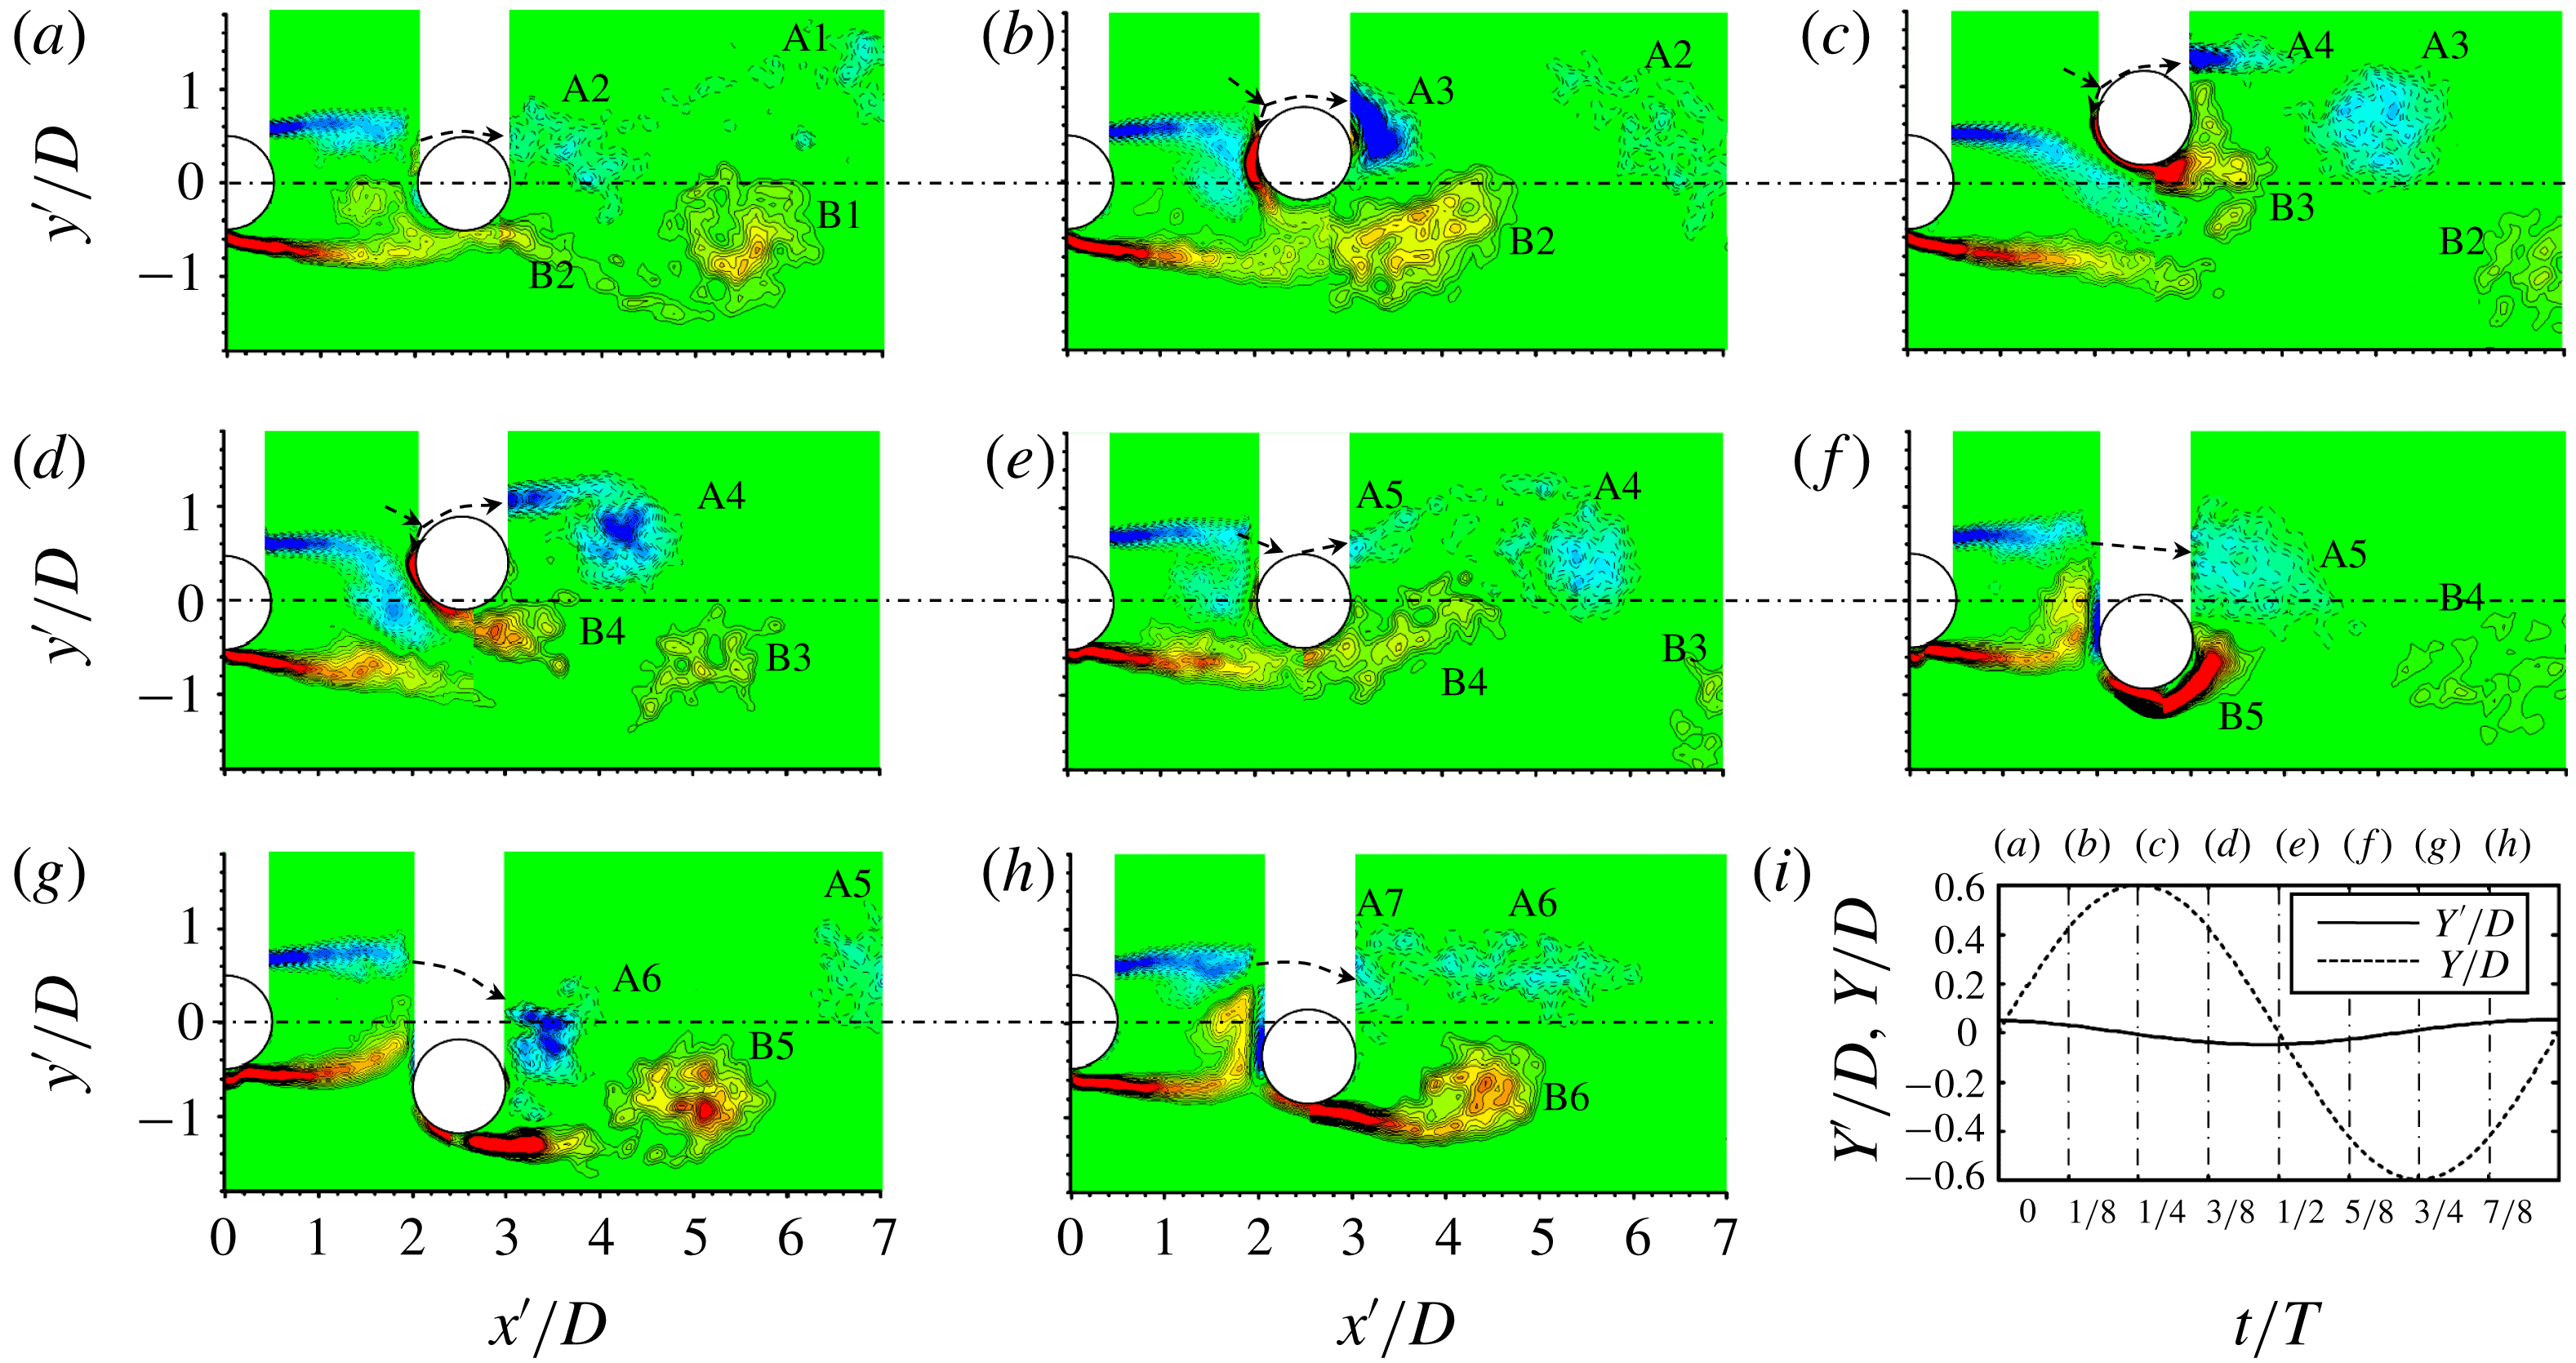
(a–h) Phase-averaged vorticity
 $\unicode[STIX]{x1D714}_{z}^{\ast }\,(=\unicode[STIX]{x1D714}_{z}D/U_{\infty })$
contours in one oscillation cycle. Solid and dotted contour lines stand for positive and negative vorticities. The contour cutoff levels are
 $\pm 0.4$
and the increment is 0.4. (i) Variations in
 $Y/D$
and
 $Y^{\prime }/D$
, where the time instants are specified by the dash-dotted lines corresponding to (a–h).
 $L/D=2.5$
,
 $U_{r}=35$
.

7 Galloping mechanism in Regime III
7.1 Flow structure
The phase-averaged vorticity contours are presented in figure 15 for one period of structural vibration at
 $L/D=2.5$
and
 $U_{r}=35$
with a view to understanding why
 $A_{u}^{\ast }<A_{d}^{\ast }$
in regime III. The phase-averaged process is done using the
 $Y$
signal as a reference. At
 $t=0$
(
 $Y/D=0$
and
 $Y^{\prime }/D=0.04$
), both cylinders are close to the centreline. The two gap shear layers reattach on the downstream cylinder (figure 15
a). The lateral separation of the upper shear layer from the wake centreline
 $(y^{\prime }/D=0)$
is, however, smaller than that of the lower shear layer. Part of the lower reattached shear layer starts its rollup on the front surface of the downstream cylinder. Vortex shedding from the downstream cylinder occurs largely from the upper side, vortex A2 appearing larger in size than vortex B2. As the downstream cylinder moves upwards (figure 15
b), the upper shear layer rolls up on the front surface, and a new vortex A3 originates from the shear layer over the upper side of the downstream cylinder, not from the gap shear layer and not directly interacting with the gap shear layer or gap vortices. Due to the upward movement of the cylinder, a shear layer with positive (anticlockwise, red colour) vorticity emerges on the front surface and joins the lower shear layer from the upstream cylinder, both contributing to the generation of vortex B2 (figure 15
b). When
 $Y/D$
is large enough (figure 15
c), the upper gap shear layer swerves downwards without reattachment and interacts with vortex B3 generated by the lower shear layer of the downstream cylinder. Both gap shear layers contribute vorticity to B3. B3 is thus not so well structured as A3. Another vortex A4 grows from the upper shear layer, again not directly interacting with the gap shear layers. Though each cylinder has two distinct shear layers, the shear layers around the downstream cylinder roll up very near the cylinder, while those around the upstream cylinder reattach on, detach from, or roll up, depending on
 $Y/D$
, around the downstream cylinder, which leads to the shear layer swerving from one side to the other. The downward movement of the cylinder causes rollup of the upper gap shear layer very close to the downstream cylinder (figure 15
d). When the cylinder moves back to
 $Y/D=0$
(figure 15
e), both gap shear layers reattach and part of the upper shear layer rolls up on the front surface. The ensuing flow structure is a mirror image of that in figure 15(a). Similarly, the flow structures in figure 15(f–h) are mirror images of those in figure 15(b–d), respectively, which enable us to recover the vorticity structure on the upper side (masked area) of the downstream cylinder.
The vortices shed from the downstream cylinder are inclined downwards at instants (
 $a$
) and (
 $b$
) when the cylinder moves upwards. Vortex shedding appears almost symmetric at instant (
 $c$
), at which the cylinder velocity is zero (maximum
 $Y/D$
). As the cylinder moves downwards from instant (
 $c$
) to (
 $g$
), vortex shedding from the downstream cylinder is deflected upwards. The maximum deflection occurs at instants (
 $a$
) and (
 $e$
) when the cylinder velocity is maximum. A total of eleven vortices are formed in one cycle of the cylinder oscillation (A2–A7 and B2–B6), accounting for
 $f_{v2}/f_{n}\approx 5.5$
(figure 5
d). There are two types of vortex generated in the wake: interacting and non-interacting with the gap shear layers. The latter type includes A3, A4, B5 and B6, which are well structured and decay slowly, formed when the cylinder is away from the centreline (instants
 $b$
,
 $c$
,
 $f$
–
 $h$
). The other vortices (A2, A5, A6, A7, B2, B3 and B4) interact with the gap shear layers and decay rather rapidly. They receive vorticity from the gap shear layers during their generation.
It is also noted that the two gap shear layers pass over the lower and upper sides of the downstream cylinder at the maximum and minimum
 $Y/D$
(figure 15
c,g), respectively. Obviously, the alternating reattachment and switching of the two gap shear layers from one side to the other follow the cylinder oscillation, and the switching frequency is synchronized with the cylinder oscillation. The rollup and impingement of the gap shear layers occur around the downstream cylinder, away from the upstream cylinder, which explains why
 $A_{d}^{\ast }>A_{u}^{\ast }$
. As the switch of the gap shear layers is connected to the downstream cylinder oscillation, the upstream cylinder vibration stops when the downstream cylinder is stationary (figure 7
c).
7.2 Pressure distribution around vibrating cylinders
Figure 16 presents the distributions of the phase-averaged pressure coefficient
 $\langle C_{P}\rangle$
around both cylinders, along with phase-averaged vorticity contours for five instants (i) to (v). The
 $\langle C_{P}\rangle$
distribution on the surface of the upstream cylinder does not change much from instant (i) to (v). The
 $\langle C_{P}\rangle$
of the upstream cylinder decreases from the maximum (1.0) at
 $\unicode[STIX]{x1D703}=0^{\circ }$
(stagnation point) to the minimum
 $({\approx}-1)$
at
 $\unicode[STIX]{x1D703}=56.25^{\circ }$
, but changes little on the rear surface. The distribution is similar to the time-averaged pressure distribution on the upstream cylinder at
 $L/D=2.2$
and
 $Re=6.5\times 10^{4}$
for two tandem fixed cylinders (Alam et al.
Reference Alam, Moriya, Takai and Sakamoto2003). As shown in figure 17(a),
 $C_{Lu}$
varies in a small range (from
 $-0.18$
to 0.18) in line with the small change in the
 $\langle C_{P}\rangle$
distribution at different instants (figure 16). The value of
 $Y^{\prime }/D$
is periodic
 $(f_{n}=1/T)$
; yet
 $C_{Lu}$
is obviously chaotic, containing multiple frequencies (figure 17
a). On the other hand,
 $\langle C_{P}\rangle$
around the downstream cylinder surface at instant (i) is negative; its maximum
 $(\langle C_{P}\rangle \approx -0.07)$
occurring at
 $\unicode[STIX]{x1D703}\approx 67.5^{\circ }$
. The rollup of the lower reattached shear layer on the front surface of the downstream cylinder gives rise to a negative pressure at
 $\unicode[STIX]{x1D703}=-60^{\circ }{-}0^{\circ }$
and
 $\langle C_{P}\rangle \approx -0.60{-}-0.87$
(instant i), leading to
 $C_{Ld}$
slightly lower than zero (figure 17
b). At instant (ii) where the cylinder is away from the centreline, the negative pressure on the front surface results from the rollup of the upper gap shear layer and from the boundary layer generated with positive vorticity. The boundary layer on the upper side, its separation and following strong rollup motion produce a pronouncedly negative pressure on the side surface, with a maximum magnitude of 2.02 at
 $\unicode[STIX]{x1D703}=90^{\circ }$
. The corresponding positive
 $C_{Ld}$
is maximum. The
 $C_{Ld}$
initially decreases from instant (i) to (ii), followed by a rapid increase to the maximum. While the mild decrease is connected to the growth in B2, the rapid increase is attributed to the upper boundary layer and strong rollup motion of A3 near the cylinder surface. From instant (ii) to (iii), the pressure pattern changes markedly, the pronouncedly negative pressure shifting from the upper side to the lower (minimum
 $\langle C_{P}\rangle \approx -2.05$
at
 $\unicode[STIX]{x1D703}\approx 303.8^{\circ }$
). Two factors account for this change. One is the upper gap shear layer of positive vorticity flows over the lower side, and the other is the formation of the boundary layer with strong vorticity on the lower side (instant iii). Couder & Basdevant (Reference Couder and Basdevant1986) demonstrate experimentally and numerically that the convective behaviours of two oppositely signed vortices may give rise to an increase in flow velocity at their interface. It is thus expected that the increased velocity over the lower side also contributes to the negative pressure. Note that instant (iii) corresponds to a kink (small peak) between the maximum and minimum
 $C_{Ld}$
(figure 17
b). The kink results from the formation of vortex A4 on the upper side. With the cylinder moving towards the centreline from instant (iii) to (iv), the maximum magnitude of the negative pressure region shifts from the lower side surface to the front surface, essentially ascribed to the change in the upper gap shear layer rollup (instants iii–v). Interestingly, it is the interaction between the gap shear layers and the downstream cylinder that is the primary cause of the change in the pressure distribution over the front and side surfaces during the cylinder motion.
Phase-averaged vorticity contours and pressure coefficient
 $\langle C_{P}\rangle$
around cylinders in one half-cycle of the cylinder oscillation (instants i–v). The contour cutoff levels are
 $\pm 0.4$
and the increment is 0.4.
 $L/D=2.5$
,
 $A_{d}^{\ast }=0.6$
.

Superimposed plots (50 cycles) of displacement and lift force variations. (a)
 $Y^{\prime }/D$
and
 $C_{Lu}$
, and (b)
 $Y/D$
and
 $C_{Ld}$
. Power spectral density functions (c)
 $E_{Y^{\prime }}$
and
 $E_{C_{Lu}}$
, and (d)
 $E_{Y}$
and
 $E_{C_{Ld}}$
. The instants marked above the figures represent the instants of the snapshots in figure 16.
 $L/D=2.5$
,
 $A_{d}^{\ast }=0.6$
.

At
 $L/D=2.5$
(figure 17
c,d),
 $E_{Y^{\prime }}$
clearly displays one peak at
 $f_{n,}$
, and the peak at
 $f_{n}$
in
 $E_{C_{Lu}}$
is not so pronounced as at
 $L/D=1.5$
(figure 11
c), suggesting that the small-amplitude vibration of the upstream cylinder is largely induced by the vibration of the downstream cylinder. As such, when the downstream cylinder is fixed, the vibration of the upstream cylinder, albeit small, is suppressed (figure 7
c). The
 $E_{C_{Ld}}$
shows two predominant peaks at
 $f_{n}$
and
 $3f_{n,}$
, respectively (figure 17
d), the former is more pronounced than the latter. There are also other superharmonic peaks in both
 $E_{C_{Lu}}$
and
 $E_{C_{Ld}}$
, which are perhaps linked to the strong interactions between the shear layers, separated from the upstream cylinder, and the downstream cylinder.
7.3 Work done
Figure 18(a,b) presents the temporal evolution of instantaneous work of the downstream cylinder,
 $W_{fi}\,(=C_{Ld}\times d(Y/D))$
in one cycle of oscillation, where subscripts 1 and 2 denote the components of
 $C_{Ld}$
associated with the cylinder oscillation and vortex shedding frequencies, respectively. As in regime I (§ 6.4),
 $C_{Ld,1}$
is 20 Hz low-pass-filtered
 $C_{Ld}$
and then
 $C_{Ld,2}=C_{Ld}{-}C_{Ld,1}$
. Note that
 $C_{Ld}$
is first low-pass filtered at
 $6f_{n}$
, which is higher than the vortex shedding frequency. As noted earlier, the gap shear layers switch from one side to the other at a frequency equal to the cylinder vibration frequency. Therefore,
 $W_{fi,1}\,(=C_{Ld,1}\times d(Y/D))$
can be considered as the work done by the gap shear layer switch and
 $W_{fi,2}\,(=C_{Ld,2}\times d(Y/D))$
as the work done by vortices shed during the cylinder oscillation.
Time histories of
 $Y/D$
,
 $C_{Ld}$
and
 $W_{fi}$
in one cycle: (a)
 $C_{Ld,1}$
and
 $W_{fi,1}$
and (b)
 $C_{Ld,2}$
and
 $W_{fi,2}$
. (c) Variations in
 $\sum W_{fi}$
,
 $\sum W_{fi,1}$
and
 $\sum W_{fi,2}$
in fifteen cycles.
 $L/D=2.5$
,
 $A_{d}^{\ast }=0.6$
.

As shown in figure 18(a),
 $C_{Ld,1}$
decreases to zero as the cylinder moves upwards from
 $Y/D=0$
to 0.21, resulting in a positive but decreasing
 $W_{fi,1}$
(process I, marked at the top of figure 18
a). As the cylinder continues its upward movement till the top position, where
 $d(Y/D)=0$
,
 $W_{fi,1}$
becomes negative (process II). Next, as the cylinder moves downwards from the top,
 $W_{fi,1}$
remains positive and reaches its maximum during this quarter of the period (process III). Evidently, there is hysteresis in the half-cycle of oscillation due to a phase lag between
 $C_{Ld,1}$
and
 $Y/D$
, which results from the interaction between the gap shear layers and the downstream cylinder, as observed in the temporal evolution of the flow structure in figures 15 and 16. The work done is summarized in figure 19(a). While the cylinder moves upwards from
 $Y/D=0$
to
 $Y/D=0.21$
, the work done is positive and the cylinder absorbs energy from the flow (process I) where the shear layer reattachment switches from the lower side to the upper side (figure 16, instants i and ii). From
 $Y/D=0.21$
to its maximum, the work done is negative and energy is transferred from the vibrating cylinder to the flow, due to the separation of the upper gap shear layer from the downstream cylinder (figure 16, instants ii and iii). On the other hand, when moving from the highest position to
 $Y/D=0$
, the cylinder absorbs energy from the flow for the entire process III, and the maximum energy transfer occurs at
 $Y/D=0.32$
. Interestingly, in process III, the upper gap shear layer reattaches and the reattachment point shifts from the lower side to the upper side, resulting in energy transfer from the flow to the cylinder (figure 16, instants iii–v). The observation suggests that the shear layer reattachment, detachment and switch act to sustain the cylinder vibration.
Sketch for the signs of work done in one half-cycle of the downstream cylinder oscillation. (a)
 $W_{fi,1}$
and (b)
 $W_{fi,2}$
.
 $L/D=2.5$
,
 $A_{d}^{\ast }=0.6$
.

Consider the work done by vortices (figure 18
b). As
 $C_{Ld,2}$
decreases due to the growth in vortex B2, the negative
 $W_{fi,2}$
experiences a small decrease (process I
 $^{\prime }$
). Afterwards,
 $C_{Ld,2}$
rises rapidly, which is connected to the strong rollup motion of vortex A3 near the cylinder surface. As a result,
 $W_{fi,2}$
goes up rapidly from a negative value to its maximum (process II
 $^{\prime }$
). Both
 $C_{Ld,2}$
and
 $W_{fi,2}$
decline promptly (process III
 $^{\prime }$
) due to the growth of vortex B3 (figure 16, instant iii). Then,
 $W_{fi,2}$
is rising from negative to positive (process IV
 $^{\prime }$
), resulting from the formation of vortex A4 on the upper side (figure 16, instants iii and iv). This is followed by the decreasing
 $W_{fi,2}$
from positive to negative (processes V
 $^{\prime }$
and VI
 $^{\prime }$
), as a consequence of the growing vortices B4 and A5 (figure 16iv, v). The work done is summarized in figure 19(b). As the cylinder is on its upward movement, B2 gains energy, at least partially, from the cylinder during the entire process I
 $^{\prime }$
. Then, A3 gains energy first from the cylinder before the cylinder reaches
 $Y/D=0.3$
, but transfers energy to the cylinder afterwards (process II
 $^{\prime }$
). After that, B3 delivers energy to the cylinder during process III
 $^{\prime }$
. This is followed by the occurrence of A4, which absorbs energy partially from the cylinder before getting the top, and the positive work is done as the cylinder goes down (process IV
 $^{\prime }$
). Finally, vortex B4 transfers energy to the cylinder (process V
 $^{\prime }$
) and A5 absorbs energy instead (process VI
 $^{\prime }$
). Positive
 $W_{fi,2}$
means energy transfer from vortices to the cylinder and vice versa. The negative
 $W_{fi,2}$
feeds B2 (figure 16ii) and A5 (figures 16v, 15
f) with energy, resulting in their growth in size, but also accelerate the breakup of the vortices due to their intense interaction with the gap shear layers. The strong interactions between B3 (or B4) and the gap shear layers produce a positive
 $W_{fi,2}$
, resulting in shattered vortices B3 and B4 (figure 15
d–f). Moreover, the negative
 $W_{fi,2}$
during processes (III
 $^{\prime }$
) and (IV
 $^{\prime }$
) may be responsible for the well structured vortices A3 and A4, which do not appear to interact with the gap shear layers and decay less rapidly in the wake than the others.
The cumulative work
 $\sum W_{fi}\,(=\sum C_{L}\times d(Y/D))$
for fifteen cycles of the cylinder oscillation is presented in figure 18(c) to gain insight into how
 $W_{fi,1}$
and
 $W_{fi,2}$
contribute to the cylinder vibration. Evidently, after the fifteenth cycle,
 $\sum W_{fi,1}$
is approximately 8.1 at
 $t/T=15$
, a little smaller than
 $\sum W_{fi}\,({\approx}8.3)$
, while
 $\sum W_{fi,2}$
is approximately 0.2, much smaller than
 $\sum W_{fi}$
or
 $\sum W_{fi,1}$
. The observation indicates that the energy transferred from the flow to the cylinder is largely contributed from
 $\sum W_{fi,1}$
, rather than from
 $\sum W_{fi,2}$
, which is related to vortex shedding.
Finally, it is useful to check the balance between the energy dissipated by the structural damping and the energy transferred from the fluid to the cylinder. The energy
 $W_{f}$
transferred from the fluid to the cylinder motion for each cycle of the oscillation is given by
 $W_{f}=\unicode[STIX]{x03C0}F_{L0}Y_{0}\sin \unicode[STIX]{x1D719}$
, where
 $Y_{0}$
is the amplitude of the cylinder oscillation,
 $F_{L0}$
is the amplitude of the lift force, and
 $\unicode[STIX]{x1D719}$
is the phase shift between the lift force and cylinder displacement. The energy dissipated by the structural damping is given by
 $W_{d}=-\unicode[STIX]{x03C0}c\unicode[STIX]{x1D714}Y_{0}^{2}$
, where
 $c$
is the structural damping and
 $\unicode[STIX]{x1D714}=2\unicode[STIX]{x03C0}f_{osc}$
(
 $f_{osc}$
is the oscillation frequency). The force associated with the fundamental frequency of the cylinder oscillation contributes most to the total force, while the components of other frequencies make a negligible net contribution to the energy transfer between the fluid and the structure (Qin et al.
Reference Qin, Alam and Zhou2017). Figure 20 presents the time histories of
 $W_{f}$
and
 $W_{d}$
for the downstream cylinder at
 $L/D=2.5$
and
 $A_{d}^{\ast }=0.6$
. It is evident that
 $W_{f}\approx -W_{d}$
or
 $W_{f}+W_{d}\approx 0$
– that is, the energy transferred from fluid to structure is equal to the energy dissipated by structural damping. While
 $W_{d}$
closely hovers around the mean (dashed line),
 $W_{f}$
is almost constant, because
 $F_{L0}$
was not as constant as
 $Y_{0}$
(figure 17
b).
Time histories of
 $W_{f}$
and
 $W_{d}$
for the downstream cylinder,
 $L/D=2.5$
,
 $A_{d}^{\ast }=0.6$
. The dashed line represents the time mean
 $W_{f}$
.

8 Discussion
Previous studies on the FIV of two tandem cylinders have mostly been conducted at small
 $m^{\ast }\unicode[STIX]{x1D701}$
values (
 ${<}0.13$
). The present
 $m^{\ast }\unicode[STIX]{x1D701}$
(
 $=$
0.58) is rather high, thus resulting in rather different results, albeit with similarities in some aspects. The vibrations of two elastically mounted tandem cylinders were mostly conducted at relatively large
 $L/D$
, typically at
 $L/D\geqslant 3.0{-}4.0$
; for example, at
 $L/D=5.5$
by Mittal & Kumar (Reference Mittal and Kumar2001) and Prasanth & Mittal (Reference Prasanth and Mittal2009a
,Reference Prasanth and Mittal
b
). Such a large
 $L/D$
leads to vortex shedding from the upstream cylinder, forming vortices in the gap. The values of
 $m^{\ast }\unicode[STIX]{x1D701}$
in Mittal & Kumar (Reference Mittal and Kumar2001) and Prasanth & Mittal (Reference Prasanth and Mittal2009a
,Reference Prasanth and Mittal
b
) were 0.000495 and 0 (
 $m^{\ast }=10$
and
 $\unicode[STIX]{x1D701}=0$
), respectively. As the upstream cylinder behaved like an isolated cylinder, the downstream cylinder, excited by the gap vortices, experienced a large-amplitude vibration over a wide range of
 $U_{r}$
. Huera-Huarte & Bearman (Reference Huera-Huarte and Bearman2011) and Huera-Huarte & Gharib (Reference Huera-Huarte and Gharib2011) conducted experiments on the FIV of two tandem cylinders for
 $L/D=2.0{-}8.0$
and
 $m^{\ast }\unicode[STIX]{x1D701}=0.043$
, while Papaioannou et al. (Reference Papaioannou, Yue, Triantafyllou and Karniadakis2008) numerically studied the influence of
 $L/D$
on the FIV of two tandem cylinders for
 $L/D=2.5$
, 3.5 and 5, with
 $m^{\ast }\unicode[STIX]{x1D701}=0.127$
. Vortex shedding in the gap occurred for
 $L/D\geqslant 3.0$
(Huera-Huarte & Bearman Reference Huera-Huarte and Bearman2011; Huera-Huarte & Gharib Reference Huera-Huarte and Gharib2011) and
 $L/D=3.5$
and 5 (Papaioannou et al.
Reference Papaioannou, Yue, Triantafyllou and Karniadakis2008). Again, the large-amplitude vibration of the downstream cylinder was ascribed to the interaction between the gap vortices and the downstream cylinder. Presently, at
 $L/D>3.0$
in Regime IV, the upstream cylinder response resembles that previously observed; however, the downstream cylinder behaves rather differently. Because of the large
 $m^{\ast }\unicode[STIX]{x1D701}\,(=0.58)$
, the vortices shed from the upstream cylinder are not enough to excite the large-amplitude vibration of the downstream cylinder.
Previous studies gave little attention to small
 $L/D\,({\leqslant}3.0)$
, where the upstream cylinder shear layer interaction with the downstream cylinder may act as the main excitation source of the galloping vibration. At
 $L/D=2.5$
, Papaioannou et al. (Reference Papaioannou, Yue, Triantafyllou and Karniadakis2008) observed the large-amplitude response of the downstream cylinder at high
 $U_{r}$
beyond the VE regime, where the shear layers separated from the upstream cylinder reattached on the downstream cylinder. The large-amplitude vibration was simply ascribed to the shielding effect of the upstream cylinder. Zdravkovich (Reference Zdravkovich1988) and Ruscheweyh & Dielen (Reference Ruscheweyh and Dielen1992) suggested that the gap flow switch can be an excitation mechanism for the vibration of the downstream cylinder placed behind a fixed upstream cylinder. The downstream cylinder did not vibrate when placed inline with the upstream cylinder but did when given an initial displacement of greater than
 $0.2D$
or a flow incidence angle of more than
 $10^{\circ }$
. The vibration or excitation was initiated due to the occurrence of two flow modes, one with a strong gap flow producing a large inward lift force and the other without gap flow (shear–shear layer reattachment) associated with a negligible lift force (Zdravkovich Reference Zdravkovich1988). The gap flow switch resembles, to some extent, the observation in Regime III
 $(A_{u}^{\ast }<A_{d}^{\ast })$
. Our simultaneous measurements of flow field and pressure show the complicated physics of the flow in the gap and around the downstream cylinder, explicitly exhibiting shear layer reattachment, separation and detachment, rather than merely two flow modes obtained from flow visualization in Zdravkovich (Reference Zdravkovich1988) and Ruscheweyh & Dielen (Reference Ruscheweyh and Dielen1992). It is further found that the gap flow switch plays a key role for vibration initiation and amplification of the downstream cylinder. In addition, the vortex formation in the wake is very complicated, including vorticity accumulation from the attached and/or detached shear layers, vorticity accumulation from the neighbouring vortex, vortex merging, vortex inversion, vortex pairing, etc, as discussed in § 6.
Borazjani & Sotiropoulos (Reference Borazjani and Sotiropoulos2009) conducted numerical simulation to investigate the FIV of two elastically mounted tandem cylinders at
 $Re=200$
,
 $L/D=1.5$
,
 $m^{\ast }=2.6$
and
 $\unicode[STIX]{x1D701}=0$
. The condition
 $A_{u}^{\ast }<A_{d}^{\ast }$
occurred at
 $U_{r}\geqslant 7$
beyond the VE range of an isolated cylinder. Presently,
 $A_{u}^{\ast }>A_{d}^{\ast }$
takes place during the galloping vibration at
 $L/D=1.5$
. The difference may arise from their very low
 $Re$
and
 $m^{\ast }\unicode[STIX]{x1D701}=0$
compared with the present
 $Re=4.8\times 10^{3}{-}6.0\times 10^{4}$
and
 $m^{\ast }\unicode[STIX]{x1D701}=0.58$
. We have explained that
 $A_{u}^{\ast }>A_{d}^{\ast }$
(
 $L/D<2$
) is connected to the reattached shear layer rollup (figure 10) very close to the base of the upstream cylinder, which affects the pressure distribution on the side and rear surface of the upstream cylinder. It is worth mentioning that the transition to turbulence in the gap shear layer plays an important role in determining the reattachment position of the shear layers. This transition shifts upstream with increasing
 $Re$
. So does the reattachment position on the downstream cylinder. Alam (Reference Alam2014) found that the shear layers separated from the upstream flowed upstream after reattaching on the downstream cylinder and then reattached onto the rear surface of, or rolls up near the base of, the upstream cylinder for
 $Re>9.7\times 10^{3}$
, where the shear layer reattachment on the downstream cylinder occurs on the front surface. The reattachment on the side surface, occurring at low
 $Re<9.7\times 10^{3}$
, does not produce sufficiently strong reverse flow. This explains why
 $A_{u}^{\ast }>A_{d}^{\ast }$
in the present investigation, opposite to the Borazjani & Sotiropoulos’ (Reference Borazjani and Sotiropoulos2009) observation.
The gap flow mechanism was found to be crucial for sustaining the large vibration of the downstream cylinder, which is to some extent similar to the gap shear layer interaction with the downstream cylinder in Regime III. There are still some differences. As pointed out by Borazjani & Sotiropoulos (Reference Borazjani and Sotiropoulos2009), the passage of the shear layer through the gap region triggers a sequence of very complex vortex-to-vortex and vortex-to-cylinder interactions that dominate the dynamics of the flow, resulting in the large vibration of the downstream cylinder. Furthermore, an initial lateral separation between the two cylinders due to the VE is needed for the two shear layers separated from the upstream cylinder to flow over the same side of the downstream cylinder. It is presently shown in figures 15 and 16 that the shear layer interaction with the downstream cylinder contributes to the downstream cylinder vibration, rather than vortex shedding. At the higher
 $Re\,({>}9.7\times 10^{3})$
of Regime III
 $(A_{u}^{\ast }<A_{d}^{\ast })$
, the lateral separation is not necessarily required to excite the galloping vibration (figure 4
d,e).
At
 $L/D=1.3$
, Kim et al. (Reference Kim, Alam, Sakamoto and Zhou2009) observed the VE as well as the divergent and convergent vibrations on the upstream and downstream cylinders (both circular), respectively. The
 $Re$
ranged from
 $4.4\times 10^{3}$
to
 $7.4\times 10^{4}$
, where the galloping vibrations of both cylinders occurred for
 $Re>1.7\times 10^{4}$
, which is consistent with the discussion above. Bokaian & Geoola (Reference Bokaian and Geoola1984b
) reported, with a stationary downstream cylinder, a divergent galloping vibration on the upstream cylinder
 $(m^{\ast }\unicode[STIX]{x1D701}=0.093)$
at
 $L/D=1.09$
but a convergent galloping vibration at
 $L/D=1.25$
, 1.5 and 1.75. The range of
 $Re$
was between 800 and 5950. Due to a small
 $m^{\ast }\unicode[STIX]{x1D701}$
, combined VE and galloping vibration took place for the upstream cylinder. The VE produced an initial lateral separation, leading to galloping vibration of the upstream cylinder at low
 $Re\,({<}9.7\times 10^{3})$
. The large vibration of the upstream cylinder is as observed presently (
 $A_{u}^{\ast }>A_{d}^{\ast }$
in regime I), but the mechanism has not been elucidated in the literature. The upstream cylinder vibration is connected to the reattached shear layer rollup very close to the base of the upstream cylinder, and the reattachment, detachment, rollup (in the gap) and shedding of the upper and lower gap shear layers take place alternately during the vibration. This rollup mainly affects the pressure distribution on the side and rear surfaces of the upstream cylinder and contributes to the positive work done almost for the entire cycle of oscillation, acting to sustain the vibration. Based on the quasi-steady theory, galloping cannot be generated for an axisymmetric body, e.g. a circular cylinder (Bearman et al.
Reference Bearman, Gartshore, Maull and Parkinson1987). Alam & Meyer (Reference Alam and Meyer2013) provided an explanation on why the upstream cylinder may undergo galloping at a small
 $L/D\,({<}1.6)$
. The gap shear layers connect the two cylinders of small
 $L/D$
, forming a non-circular effective shape for the two-cylinder system. As a consequence, the galloping vibration occurs with the upstream cylinder given the presence of a downstream cylinder.
If the cylinder is submerged in water, the
 $m^{\ast }$
will decrease by an order of 3, while
 $\unicode[STIX]{x1D701}$
may increase by an order of magnitude 1 or 2, compared with that in air (Jauvtis & Williamson Reference Jauvtis and Williamson2004). The FIV response is governed by
 $m^{\ast }\unicode[STIX]{x1D701}$
, not by the individual
 $m^{\ast }$
and
 $\unicode[STIX]{x1D701}$
(Govardhan & Williamson Reference Govardhan and Williamson2006). The vibration amplitude in the VE regime increases exponentially with decreasing
 $m^{\ast }\unicode[STIX]{x1D701}$
(Khalak & Williamson Reference Khalak and Williamson1997). For two elastically mounted tandem cylinders with small
 $m^{\ast }\unicode[STIX]{x1D701}$
, the vibration in the VE regime grows in amplitude, and the VE and galloping are always combined (Borazjani & Sotiropoulos Reference Borazjani and Sotiropoulos2009). Further, the galloping vibration is easily excited at small
 $m^{\ast }\unicode[STIX]{x1D701}$
and thus may appear at relatively large
 $L/D\,({>}3.0)$
(Papaioannou et al.
Reference Papaioannou, Yue, Triantafyllou and Karniadakis2008; Prasanth & Mittal Reference Prasanth and Mittal2009a
,Reference Prasanth and Mittal
b
). As such, the boundaries for different regimes in terms of
 $L/D$
may change. Exploring the effect of varying
 $m^{\ast }\unicode[STIX]{x1D701}$
on the vibrations of the tandem-cylinder system is out of the scope of this study, but the mechanisms of
 $A_{u}^{\ast }<A_{d}^{\ast }$
and
 $A_{u}^{\ast }>A_{d}^{\ast }$
during the galloping vibration at large
 $m^{\ast }\unicode[STIX]{x1D701}$
may help us understand different vibration responses at low
 $m^{\ast }\unicode[STIX]{x1D701}$
.
9 Conclusions
Free vibrations of two tandem circular cylinders are experimentally investigated at
 $L/D=1.2{-}6.0$
, with
 $U_{r}$
changing from 3.8 to 47.8. The investigation leads to answering a number of questions.
The dependence of the vibration and frequency responses on
 $L/D$
can be classified into four regimes based on the characteristics and galloping vibration generation. Regime I occurs at
 $L/D\leqslant 1.5$
, characterized by the galloping vibrations of both cylinders and the vibration amplitude,
 $A_{u}^{\ast }$
, of the upstream cylinder significantly exceeds the amplitude,
 $A_{d}^{\ast }$
, of the downstream cylinder. Furthermore, the shedding frequency during the galloping vibration is locked with the second or third harmonics of
 $f_{n}$
. Regime II corresponds to
 $1.5<L/D<2.5$
, where the galloping vibration is generated with
 $A_{u}^{\ast }>A_{d}^{\ast }$
at a small reduced velocity
 $U_{r}$
but
 $A_{u}^{\ast }<A_{d}^{\ast }$
at a large
 $U_{r}$
. The frequency
 $f_{v1}$
of vortex shedding from the upstream cylinder follows
 $f_{v1}/f_{n}=2$
and 3, while that
 $f_{v2}$
of vortex shedding from the downstream cylinder increases linearly as
 $f_{v2}/f_{n}=St\times U_{r}(St\approx 0.16)$
, along with lock-in at
 $3f_{n}$
when
 $A_{d}^{\ast }>A_{u}^{\ast }$
at a large
 $U_{r}$
. Regime III
 $(2.5\leqslant L/D\leqslant 3.0)$
is characterized by
 $A_{d}^{\ast }>A_{u}^{\ast }$
with
 $f_{v1}/f_{n}=f_{v2}/f_{n}=St\times U_{r}(St\approx 0.15{-}0.16)$
, which is different from that in Regime II, where
 $f_{v1}\neq f_{v2}$
during galloping vibration. Furthermore,
 $f_{v1}/f_{n}=2$
for the upstream cylinder. Regime IV refers to
 $L/D>3.0$
, where vibration is small on the downstream cylinder and even smaller on the upstream cylinder. Both
 $f_{v1}$
and
 $f_{v2}$
follow
 $f_{v1}/f_{n}=f_{v2}/f_{n}=St\times U_{r}$
with
 $St\approx 0.2$
, indicating that the interaction between the cylinders is weak and the upstream cylinder acts more like a single cylinder.
In regime I, the initial state (spring-mounted or fixed) of the downstream cylinder produces a very small or negligible effect on the upstream cylinder vibration, implying that the downstream cylinder vibration does not affect the upstream cylinder vibration although the downstream cylinder is essential for exciting the galloping vibration of the upstream cylinder. However, the initial state of the upstream cylinder substantially affects the vibration of the downstream cylinder.
 $A_{d}^{\ast }$
is suppressed when the upstream cylinder is stationary, while a large-amplitude vibration of the upstream cylinder induces a small-amplitude vibration of the downstream cylinder. The different effects of the two cylinders are connected to the origins of the vibration. While the gap vortices are responsible for the vibration of the upstream cylinder, the alternate reattachment or separation of the shear layers gives rise to the vibration of the downstream cylinder. The alternate reattachment/separation is suppressed when the upstream cylinder is stationary, but the gap vortices are not when the downstream cylinder is stationary. In regime III, the effect of the initial state of one cylinder on the other is very strong.
 $A_{u}^{\ast }$
is suppressed, approaching zero, or
 $A_{d}^{\ast }$
is reduced when the other cylinder is stationary, for the vibrations of both cylinders are linked to the switching of the gap shear layers.
The condition
 $A_{u}^{\ast }>A_{d}^{\ast }$
(
 $L/D<2$
) is connected to the reattached shear layer rolling very close to the base of the upstream cylinder, mainly affecting the pressure distribution on the side and rear surfaces of the upstream cylinder.
 $A_{d}^{\ast }$
is also related to the gap shear layers and the upstream cylinder vibration. The reattachment, detachment, rollup (in the gap) and shedding of the upper and lower gap shear layers become alternatingly involved during the vibrations. The rolling of the gap shear layers around the rear surface of the upstream cylinder contributes to the positive work done in almost the entire cycle of oscillation, sustaining the vibration. A large
 $L/D\,({>}2.0)$
corresponds to
 $A_{u}^{\ast }<A_{d}^{\ast }$
, where the reattachment of the gap shear layer occurs on the front surface of the downstream cylinder, the rolling being away from the upstream cylinder base, which leads to a radical pressure change largely occurring around the downstream cylinder. The gap shear layers depending on
 $Y/D$
reattach on, separate from, or roll around the downstream cylinder, which leads to the shear layers swerving from one side to the other. The shear layer reattachment, separation and switch result in energy transfer from the fluid to the cylinder, sustaining the downstream cylinder vibration.
Two types of vortices are identified in the wake, interacting and non-interacting with the gap shear layers. The interacting vortices result from the interaction of the gap shear layers and downstream cylinder. This type of vortex gains vorticity from the reattached shear layer and does positive work on the cylinder during its growth, and the vortices vanish rather rapidly in the wake. On the other hand, the non-interacting vortices generated from the free shear layers are well structured and decay rather slowly, connected to negative work done on the cylinder.
Acknowledgements
The authors wish to acknowledge support from the National Science Foundation of China (NSFC) through grants 11672096, 91752112 and 91752109 and from the Research Grant Council of Shenzhen Government through grant JCYJ20170811152808282.