


Introduction
The Driftless Area of southwestern Wisconsin escaped direct Pleistocene glaciation, allowing long-term loess and colluvium accumulation, along with paleosol preservation, in selected depositional settings. Typical loess stratigraphy consists of Marine Oxygen Isotope Stage (MIS) 2 Peoria Loess mantling the landscape, with older loess units preserved to a lesser degree as age of the unit increases (Leigh and Knox, Reference Leigh and Knox1994). The most complete stratigraphic sections are typically confined to relatively broad uplands close to the Mississippi River Valley, which has long been presumed to be the source of glaciogenic loess in this landscape (Leigh and Knox, Reference Leigh and Knox1994). Glaciogenic loess in the midwestern United States is believed to originate through glacial grinding of rocks, with the silt delivered to meltwater streams, where it was subsequently deflated from valley floors during low flow and dry seasons. In this model, loess thickness decreases rapidly downwind of valleys that carried significant outwash (Bettis et al., Reference Bettis, Muhs, Roberts and Wintle2003). In addition to glaciogenic loess in the Driftless Area, there is evidence for a significant component of dust that was derived from periglacial landscapes in southeast Minnesota and northeast Iowa (Mason, Reference Mason2015). Discriminating the proportions of glaciogenic and periglacial sourced loess has not been attempted and at present is likely not possible. In the Driftless Area, loess thickness on uplands decreases rapidly east of the Mississippi Valley, and slopes descending from uplands often contain only a thin veneer of Peoria Loess overlying sandy or rocky colluvium or even resting directly on bedrock. Loess and soil stratigraphy in Wisconsin uses the stratigraphic framework of the Illinois State Geological Survey (Wilman and Frye, Reference Willman and Frye1970; Hansel and Johnson, Reference Hansel and Johnson1986; Curry et al., Reference Curry, Grimley and McKay2011), but defines loess units as members within the Kieler Formation (Knox et al., Reference Knox, Leigh, Jacobs, Mason and Attig2011). Following this scheme, we use the term geosol for major buried soils that have been stratigraphically formalized and can be mapped at some scale, and the more generic term paleosol for buried soils that have not been formalized pedostratigraphically.
Paleosols occur in the loess deposits and include the Farmdale Geosol in the Roxana Member, which accumulated during MIS 3. In the Driftless Area, the Farmdale Geosol developed syndepositionally as the Roxana Member was accumulating, and radiocarbon ages indicate the accumulation and carbonate leaching occurred from >55 to 27 ka (Leigh and Knox, Reference Leigh and Knox1993). In some instances, the Roxana Member and Farmdale Soil aggraded on the Sangamon Geosol as an overthickened A horizon or A and E horizon. The underlying Sangamon Geosol occurs commonly in the loess stratigraphic sequence and is formed in Loveland Member loess. No radiometric or isotopic ages have been determined for the Sangamon Geosol or Loveland Member in the Driftless Area, but long-standing regional correlations of the degree of pedogenic expression of the paleosol indicates the Loveland Loess was deposited during MIS 6 and the Sangamon Geosol formed during the last interglacial period, through MIS 5 and 4 (Follmer, Reference Follmer1983; Jacobs et al., Reference Jacobs, Knox and Mason1997; Curry et al., Reference Curry, Grimley and McKay2011; Markewich et al., Reference Markewich, Wysocki, Pavich and Rutledge2011). Paleosols older than the last interglacial period are encountered very infrequently in the Driftless Area. Leigh and Knox (Reference Leigh and Knox1994) described a weakly developed paleosol formed in a loess unit they named the Wyalusing Member beneath the Loveland Member. This pedogenically altered loess occurred in 5 of 61 stratigraphic sections described from the Driftless Area and is tentatively interpreted as a basal couplet of the Loveland Member that was deposited early during MIS 6 as the ice sheet grew.
The oldest and most continuous sediment-paleosol sequence in the Driftless Area was found on an interfluve nested beneath the uplands 50 km west of the Mississippi River Valley in the upper Kickapoo River Valley near the unincorporated hamlet of Oil City (Jacobs and Knox, Reference Jacobs and Knox1994). The section contains eight lithologic units (including both loess and colluvium) with five paleosols, all with normal remanent magnetism (i.e., <780 ka). Previous work characterized the stratigraphy, pedology, micromorphology, and clay mineralogy of the section (Jacobs and Knox, Reference Jacobs and Knox1994). Four of the five paleosols have pedogenic features such as fine blocky structure, clay illuviation features, and a clay mineralogy depleted in illite and with broad smectite peaks that lead to their recognition as strong or very strongly developed soils (sensu Follmer, Reference Follmer1998) that developed during interglacial conditions. Three of the paleosols are older than the Sangamon Geosol. Interpretation of the degree of weathering of the individual soils was complicated by the fact that most of the less-altered C horizon loess material was either weathered or eroded and thus not preserved for most of the soils, including the middle part of the section that consists of three strongly expressed Bt horizons with overlapping sola in a pedocomplex.
Historically, mineral weathering has been used to estimate the relative age and environmental conditions during the period of soil formation. Classic methods applied to paleosols in the Midwest include ratios of resistant to weatherable minerals (counted optically or by X-ray diffraction [XRD]), clay mineralogy, or geochemistry of stable to mobile elements (Brophy, Reference Brophy1959; Beavers et al., Reference Beavers, Fehrenbacher, Johnson and Jones1963; Willman et al., Reference Willman, Glass and Frye1966). These techniques are still applicable today and with modern instrumentation can be completed more rapidly and inexpensively than in the past. This research investigates the weathering history of the Oil City section by assessing the degree of weathering of the 8–63 µm silt fraction using XRD and elemental geochemistry by portable X-ray fluorescence (pXRF). A secondary objective is to evaluate the usage of pXRF to the study paleosol weathering in midcontinent loess. The silt fraction is specifically targeted because loess deposits are typically dominated by silt and potentially represent a reservoir of weatherable minerals that record chemical alteration over interglacial time scales.
GEOLOGIC BACKGROUND FROM PREVIOUS RESEARCH
The Oil City site is located on a bedrock strath 40 m above the modern floodplain of the Kickapoo River at 43°45.26′N, 90°34.64′ (Fig. 1). The age of the strath is unknown but was suggested to be early Pleistocene by Knox (Reference Knox1982) and is supported by findings of outwash with reversed polarity on a correlative strath in the lower Wisconsin River Valley (Knox and Attig, Reference Knox and Attig1988). Jacobs studied the site at Oil City for a master’s thesis, using an intact 7.6-cm-diameter core collected with a Giddings probe in 1988 (Jacobs, Reference Jacobs1990). Several other cores have been collected on the strath to verify stratigraphy and present the site on professional field trips, but only the 1988 core has been analyzed in detail. This study uses the same samples. The following is a description of the geologic and pedological background and is largely summarized from Jacobs and Knox (Reference Jacobs and Knox1994).
(color online) (A) Hill shade model derived from LIDAR (light detection and ranging)–based digital elevation model of Monroe County, Wisconsin. Core location shown by star; note the location is on an interfluve nested below the high uplands. Inset map shows location of hill shade model in state of Wisconsin, including relationship to limits of glaciation during Marine Oxygen Isotope Stage 2 (MIS 2). (B) Hill shade model overlain by eolian sediments, with thickness categories interpreted from the Natural Resources Conservation Service SSURGO (Soil Survey Geographic) database. Note minimal thick loess (>100 cm) on upland divides, indicating environmental conditions were not conducive to loess accumulation. Instead, thick loess is commonly in narrow footslope positions, indicative of colluvial accumulations below the uplands, or on surfaces nested below the upland, which must have provided protected sites with vegetation that could trap loess. (C) Close-up grayscale hill shade model illustrating local relief adjacent to the Oil City site. Note how gullies cutting into the upland have effectively isolated the bedrock strath from colluviation from the backslope. Elevations range between approximately 270 and 397 m (890 and 1300 ft.).

The Oil City stratigraphic sequence is 8.85 m long and contains eight lithostratigraphic units and five paleosols. The lithostratigraphic units are a mix of colluvium and loess, with primary loess forming the upper four units in the sequence, while the lower part of the sequence contains several units identified as colluvium, some of which are redeposited loess and others derived from topographically higher sandstone bedrock. All units have normal remanent magnetism (i.e., <780 ka). The base of the section is a loamy colluvial unit that is overlain by a silty clay interpreted as redeposited loess (Table 1; Jacobs and Knox, Reference Jacobs and Knox1994). The basal two units contain a paleosol that is largely intact, with minimal or no truncation of the original surface, based on interpretation of the upper horizon as retaining A horizon characteristics. The silty parts of the unit have abundant smectite clays, which indicates the unit is likely derived from loess with a western source (Ruhe, Reference Ruhe1984). Above that, unit 6 is a silt and clay-rich colluvial unit that is largely massive and lacking pedogenic features (C horizon) except near the upper contact with an overlying loamy colluvial unit. Colluvium was interpreted on the basis of alternating particle-size distribution and some visible stratification. The unit has abundant smectite, which indicates it is likely a redeposited loess with a western source. The overlying unit 5 is a loamy colluvium based on clear stratification and the presence of glauconite sand grains characteristic of the sandstone bedrock upslope from the core site. Unit 5 contains distinct pedogenic fabric and clay coatings and has been interpreted as a separate paleosol, although separating the relationship of the pedogenic features from those in the overlying loessial unit 4 is difficult. Unit 4 is interpreted as a loess that has been totally transformed by pedogenesis, having a very well-expressed Bt horizon with soil textures as fine as silty clay. Thin sections from this paleosol display prominent clay films and clay domains in the matrix that were interpreted as being derived from weathering of mica and other minerals, although the unit is still dominated by smectite. Unit 3 is a loess that was correlated with the Loveland Member loess based on stratigraphic position and pedogenic features regionally characteristic of the Sangamon Geosol. The Sangamon Geosol is truncated in the core, with the Roxana Member sediment resting directly on a reddish Bt horizon. Units 3, 4, and 5 all display strong pedogenic fabric, and the boundaries are morphologically obscured, leading to their description as a pedocomplex that likely represented multiple interglacial periods of soil formation punctuated by episodes of sediment accumulation, similar to the description of the Yarmouth-Sangamon paleosol in Iowa (Woida and Thompson, Reference Woida and Thompson1993). Unit 2 is loess with characteristics typical of the Roxana Member, including weak pedogenic expression. Unlike all other loess or loess-derived units in the section, the clay mineralogy of the Roxana Member has a strong vermiculite signature (approximately 40%) relative to the smectite that dominates the other silty lithologic units. The vermiculite and other features have been interpreted to indicate a Lake Superior source region for this loess (Leigh, Reference Leigh1994; Grimley, Reference Grimley2000; Jacobs et al., Reference Jacobs, Konen and Curry2009). Unit 1 is the Peoria Member loess, which is the thickest unit in the core and contains a 143-cm-thick C horizon, including calcareous loess in the lowermost 12 cm of the unit. All other units are leached of carbonate minerals (excepting near-surface road gravel). Despite the long record of sediment accumulation and soil formation preserved at Oil City, it has been considered a thickness anomaly for Peoria and Roxana Members, because the thickness exceeds that predicted from the upland distance-thinning relationships of Leigh and Knox (Reference Leigh and Knox1994).
Summary of lithologic and pedogenic characteristics of the Oil City stratigraphic section (largely summarized from Jacobs and Knox, Reference Jacobs and Knox1994).

a L, loam; SiCL, silty clay loam; SiC, silty clay; Sil, silt loam.
b Identifiable peaks for I, illite; K, kaolinite plus chlorite; S, smectite; V, vermiculite.
The shift from colluvium in the basal part of the sequence to loess in the upper part is attributed to the development of gullies that incised into the bedrock strath, including at the foot of the backslope rising to the uplands (Fig. 1C). The gullies effectively isolated the strath surface by displacing runoff away from the strath remnant, stopping the accumulation of colluvium and allowing only loess to accumulate.
Except the Farmdale Geosol in unit 2, all paleosols display interglacial-scale morphology with fine blocky structure and distinct illuvial clay coatings evident both macromorphologically and in thin section. Most of the thin sections display complex coatings, and ped interiors have many bright clay domains indicative of transformation of mica and perhaps other minerals to clays. Disrupted and fractured clay coatings in the matrix are also common and signify a long and complex pedogenic history.
Methods
The original samples analyzed in Jacobs and Knox (Reference Jacobs and Knox1994) were investigated further with additional techniques. A total of 41 samples were analyzed. The samples were collected on the basis of pedological horizonation and are at irregular spacings (see Supplementary Materials). Sand (63–2000 µm), silt (2–63 µm), and clay (<2 µm) data used in this study were determined by pipette and sieve and were originally published in Jacobs and Knox (Reference Jacobs and Knox1994). In this study, we use XRD to investigate the mineralogy and pXRF to investigate the geochemistry of the 8–63 μm silt fraction. The 8–63 μm silt fraction, including the modal fraction of loess, was chosen for comparison with recent loess provenance and weathering studies in Illinois (Grimley et al., Reference Grimley, Follmer and McKay1998, Reference Grimley, Follmer, Hughes and Solheid2003) and Wisconsin (Jacobs et al., Reference Jacobs, Mason and Hanson2011), and because this fraction is less likely to be complicated by the effects of mineral alteration and neoformation.
For separation, the <2 mm fine earth fraction was shaken overnight in a 5% solution of sodium hexametaphosphate. Silt minerals were separated by three washings at the appropriate settling time, using a vacuum pump and pipette to withdraw the supernatant (<8 µm); particles >63 µm were separated by wet sieving. After oven drying, the silt was micronized in a McCrone micronizing mill for 2.5 minutes in distilled water, which effectively reduces all particles to <20 µm. XRD was completed on packed powder samples in glass slides and scanned from 25° to 31.5° two-theta using Cu-kα radiation, with a scan speed of 1° per minute and a step of 0.02°. JADE software was used to analyze peak height and background values for quartz, K-feldspar, and plagioclase, with mineral percentages calculated using the methods and mineral intensity factors of Grimley (Reference Grimley2000). Duplicate samples were analyzed with the results averaged. Based on 11 runs of a lab reference sample, standard deviations for silt mineralogy were as follows: quartz, ±0.9%; K-feldspar, ±0.7%; plagioclase feldspar, ±0.6%; and dolomite, ±1.3%, indicating the technique has good precision. This study reports ratios of quartz to plagioclase feldspars (Q/P) and quartz to K-feldspars (Q/K), which both have a standard deviation of 0.8.
Elemental geochemistry of trace elements was determined with a Bruker Tracer IV pXRF using the Geoquant Trace mode, which measures a variety of major and trace elements common in rocks and soil. pXRF units have emerged in recent years as popular tools to rapidly and simultaneously determine multiple elements and can be used in a field or lab setting (e.g., Stockmann et al., Reference Stockmann, Cattle, Minasny and McBratney2016). For this study, we used the same micronized and oven dried 8–63 μm silt fraction that was used for XRD analysis. Samples were placed in cups with a 6-µm-thick Mylar film window and analyzed for a scan time of 120 s. Samples were analyzed in triplicate and averaged. Reported values are average results that were then calibrated using a slope determined from the average concentration of each element determined from 11 runs of National Institute of Standards and Technology standard 2710a “Montana Soil I” and the published reference values (Mackey et al., Reference Mackey, Christopher, Lindstrom, Long, Marlow, Murphy and Paul2010) (Table 2). Major elements are reported as oxides, and trace elements are reported as elemental concentrations.
Calibration information for the Bruker Tracer IV portable X-ray fluorescence (pXRF) unit. Data are based on 11 runs of Montana I Soil (National Institute of Standards and Technology [NIST] 2710a). Calibration slope is a two-point slope between the origin and the average value reported by the pXRF compared to the reported NIST value of each element (Mackey et al., Reference Mackey, Christopher, Lindstrom, Long, Marlow, Murphy and Paul2010). Coefficient of variation calculated using the 2 standard deviations for measurement reported by the pXRF software over the 120 s measurement time divided by the average concentration of each element.

Elements chosen to assess weathering were those commonly used in weathering studies that also had abundances and low standard deviations such that the coefficient of variation was low enough to provide assurance of the precision and repeatability of the measurement (Table 2). Unfortunately, the pXRF technology does not allow the measurement of elements lighter than Mg, so calculation of mass balance, which typically includes Na, is precluded. Thus, this study investigated elemental ratios between stable elements (or oxides) of TiO2, Rb, and Zr to more mobile elements K2O, CaO, and Sr.
Statistical analysis of correlations between particle-size fractions and elemental or mineralogical concentrations were investigated using SPSS version 24 (IBM Corporation). Relationships were investigated using Pearson correlation coefficients with two-tailed significance tests with probabilities of 0.05 and 0.01 levels. Although many significant correlations were identified, only those with r values >0.71 (potentially providing at least 50% variation explained) are presented in this study as bivariate scatter plots.
Results
To confidently assess the reliability of XRD and pXRF for interpreting weathering status of the paleosols, we first explore correlations of particle-size classes, mineralogy, and geochemistry of the silt fraction.
Particle-size effects on mineralogy and geochemistry
Different particle-size fractions of soils and sediments typically vary in their geochemical and mineralogical composition (Tolosana-Delgado and von Eynatten, Reference Tolosana-Delgado and von Eynatten2010; Zhou et al., Reference Zhou, Li, Jiang and Lu2015). We suspect rapid determination techniques such as pXRF may be especially susceptible to this phenomenon, although literature specifically exploring the use of pXRF is scarce. Analyzing only the 8–63 μm fraction should remove some of the influence of particle-size fractions and can serve to highlight differences in weathering or provenance for the loess and colluvium.
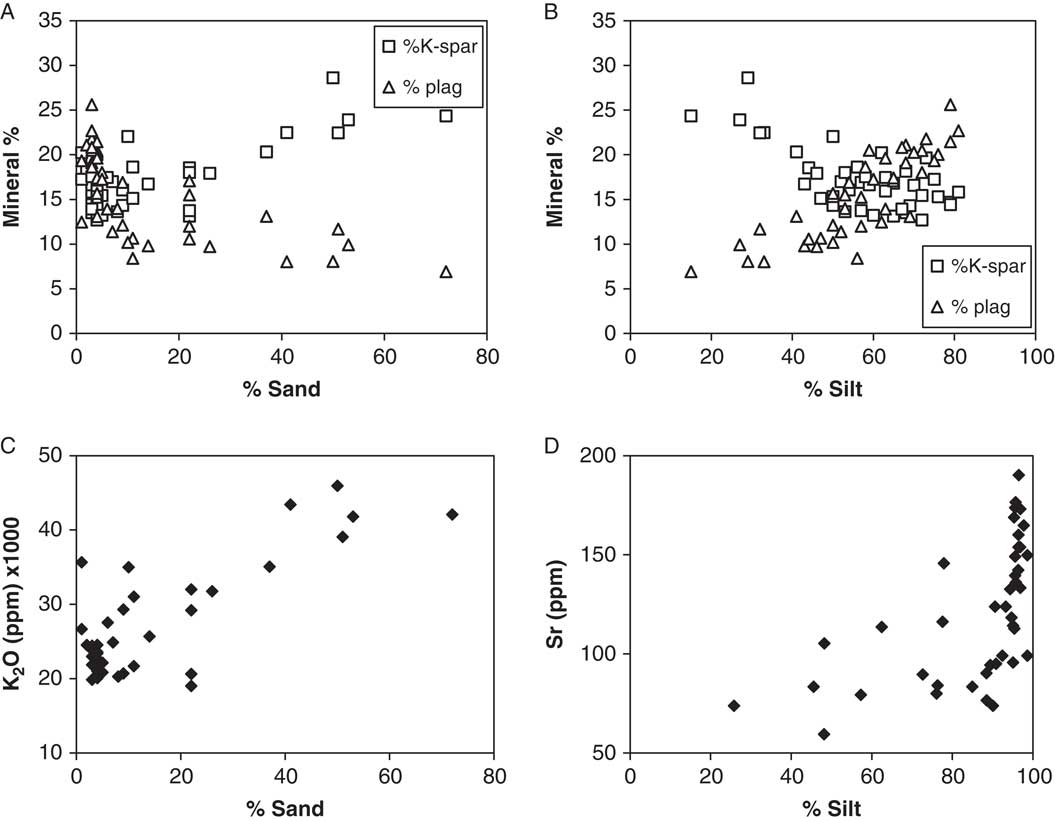
Correlations between particle-size fractions and mineral percentages indicate sand content (>63 μm) is positively related with 8–63 μm K-feldspar and negatively with plagioclase feldspar percentages. Silt (2–63 μm) is positively correlated with plagioclase percentages. Other than quartz, clay has no significant correlations with weatherable silt-sized minerals (Table 3, Fig. 2A and B). Together, these correlations fit with what is known about the probable source units: Cambrian sandstones that supplied colluvial sand are enriched in K-feldspars and glauconite (an Fe-K mica), especially in the silt fraction, while plagioclase minerals are rare (Odom, Reference Odom1975). Silt (8–63 μm) in Peoria Loess of the Driftless Area contains on average nearly twice as much plagioclase as K-feldspar (Jacobs et al., Reference Jacobs, Mason and Hanson2011); presumably older loesses were similar.
Scatter plots relating role of sand (A) and silt (B) fractions on the concentration of K-feldspars (K-spar) and plagioclase feldspars (plag). Loamy colluvial units have increasing content of K-feldspars, whereas silty loess or redeposited loess deposits are relatively enriched in plagioclase feldspars. Scatter plots relating the role of sand (C) and silt (D) fractions on the concentration of K2O and Sr, illustrating that increasing sand content in colluvial units is related to the K2O content of K-feldspars. In silt-dominated units, Sr does not display a significant linear trend; only the low silt content of colluvial units controls the relationship.
Pearson correlation coefficients (r) between particle-size fractions and mineral percentages and geochemical concentrations, with significance probabilities indicated by *P<0.05, **P<0.01. Note the two calcareous samples from the surface with road gravel and the unleached base of the Peoria Member loess were removed from the analysis.

Correlations between particle-size classes and geochemistry follow the correlations between particle-size classes and mineralogy (Table 3). K2O is positively correlated with sand and negatively with silt (Fig. 2C). Sr concentration is positively correlated with silt content, but realistically only to the extent that silt content is related to sand through the constant sum of particle-size fractions (Fig. 2D). These relationships demonstrate that fine-earth grain-size variations alone are likely not significant explanatory variables of the mineralogical and geochemical trends indicative of weathering in the sequence of sediments and paleosols. Only the loamy colluvial units (units 5 and 8) that likely have a significant proportion of their 8–63 μm fraction derived from local sandstones show that sand content does directly influence the amount of K-feldspars and K2O.
Mineralogy and geochemistry relationships
Positive linear correlations exist between mineralogy and geochemistry. Specifically, significant positive relationships exist between K-feldspar and K2O and between plagioclase and CaO and Sr; a negative relationship exists between quartz and Sr, likely a consequence of the plagioclase-Sr relationship (Table 4, Fig. 3). These relationships are expected from the geochemical behavior of these elements and support usage of mineralogy and geochemistry to study weathering. Specifically, Sr has an atomic radius similar to Ca and is known to readily substitute for Ca in plagioclase minerals, and Rb substitutes for K in feldspars, micas, and other minerals (Huang, Reference Huang1989). In this data set, the relationship between Rb and percent K-feldspar is not as strong, partly because of one outlier, but greater scatter suggests some of the Rb may be associated with mineral phases other than K-feldspar, such as micas (Fig. 3B). Finally, correlations between elements can be used to discriminate potential source or geochemical behavior relationships. As expected, positive relationships exist between K2O and Rb, and CaO and Sr (Table 5, Fig. 3E and F). Overall, we are confident that K2O, CaO, Sr, and Rb concentrations are related to the occurrence of K-feldspar and plagioclase minerals and provide a complementary source of information on mineral weathering
Scatter plots relating relationships between K-feldspar and K2O (A) and K-feldspar and Rb (B). Note the star symbols are for samples with >20% sand (loamy colluvium of units 5 and 8) and illustrate that these samples mostly have high K2O and Rb inherited from the sandstone. (C and D) The positive relationships between plagioclase feldspars and the content of CaO and Sr, supporting the interpretations that Ca and Sr occur in plagioclase minerals and can be used to note depletion through weathering. (E) Illustrates the co-occurrence of K2O and Rb, which largely occur in K-feldspars, although greater scatter with the Rb values is interpreted to indicate occurrence in other mineral phases not containing similar proportions of K. Samples with >20% sand plotted with star symbols. (F) Illustrates strong co-occurrence between CaO and Sr, interpreted as being in similar mineral sources and that should provide complementary information.

Pearson correlation coefficients (r) between mineral percentages and geochemical concentrations, with significance probabilities indicated by *P<0.05, **P<0.01. Note the two calcareous samples from the surface with road gravel and the unleached base of the Peoria Member loess were removed from the analysis.

Pearson correlation coefficients (r) between geochemical concentrations to investigate covariance of elements; significance probabilities indicated by *P<0.05, **P<0.01. Note the two calcareous samples from the surface with road gravel and the unleached base of the Peoria Member loess were removed from the analysis.

Profile trends in mineralogy as evidence of weathering
Mineralogical evidence of weathering of the 8–63 μm silt fraction by XRD is provided by peak height ratios of Q/P and Q/K. Ratios will increase with greater mineral depletion by weathering. Depletion of feldspars by chemical weathering is observed in soils to follow the sequence Ca-plagioclase > Na-plagioclase > K-feldspar (Blum and Stillings, Reference Blum and Stillings1995). For this study, the lack of C horizons and pervasive pedogenic transformation of most lithologic units means that comparisons of the degree of weathering of each paleosol are complicated and can only be approximated based on the actual value of a weathering ratio. We believe this assumption is justified on the basis of the type of sediment. The loess or loess-derived units, except the Roxana Member, all have smectitic clay mineralogy that indicates a western source for the loess. We thus make the assumption that the feldspar mineralogy and geochemistry was likely roughly similar. The paleosols developed in colluvium derived from sandstone must be considered separately.
Modern soil genetic horizons have higher Q/P and Q/K ratios than the C horizon in Peoria Loess (Fig. 4). The paleosols have higher peak Q/P ratios than the modern solum and generally tend to correspond with clay maxima of Bt horizons. The highest Q/P ratios are in unit 5 (loamy colluvium), which is naturally depleted in plagioclase minerals. The overlying unit 4 has considerably higher Q/P values (mostly >20) than the modern soil in Peoria Loess (peak value of 13), the Sangamon Geosol in Loveland loess (peak value of 16), and the paleosol in unit 7 (peak of 31). The paleosols in loess-derived units 4 and 7 have likely experienced the greatest depletion of plagioclase and are the most weathered units in the sequence. The paleosol in unit 7 displayed a weathering trend of decreasing ratios down profile, indicating the greatest plagioclase depletion and thus the most intense weathering as would be expected in an in situ soil profile. In contrast, the peak value in the paleosol in unit 4 is at the base, and the Q/P ratio value decreases up profile, which could indicate an aggrading soil or increasing plagioclase-enriched loess. Interestingly, most values for the Sangamon Geosol are approximately the same as the modern soil, except the uppermost sample. The uppermost sample peak value is 16 and corresponds with the greatest clay content just below the truncation surface. Unit 2 (Roxana Member) has Q/P values between 11 and 19, and values decrease up profile, which may reflect source area differences or changes in the degree of weathering associated with a cooling climate, as suggested by Leigh (Reference Leigh1994).
Mineralogical ratios and particle-size distribution of the Oil City section. Q/P is X-ray diffraction (XRD) peak height ratio of quartz to plagioclase. Q/K is XRD peak height ratio of quartz to K-feldspar. The third panel illustrates the cumulative percentage of sand, silt, and clay. Solid horizontal lines separate lithostratigraphy originally identified in Jacobs and Knox (Reference Jacobs and Knox1994). Soil horizonation indicated by shading.

Q/K values do not show consistent trends through each lithologic unit. The data display considerable variations that do not correspond well with the lithologic breaks or paleosol morphology. The standard deviation 0.8 for the Q/K ratio of the lab reference sample is much less than many of the variations within a paleosol. The modern soil has some of the highest values, while values for the paleosol in unit 4 are somewhat higher than the other paleosols. These trends are somewhat surprising given that several of the paleosol samples have clay contents greater than 40% and expandable clay mineral peaks are often broad and multipeaked, indicative of weathering-induced interlayering in the expandable clays (Jacobs and Knox, Reference Jacobs and Knox1994), which we expect could also lead to depletion of K-feldspar.
Profile trends in geochemistry as evidence of paleosol weathering
Geochemical indices of immobile to mobile elements increase with greater weathering. Immobile elements investigated here are TiO2, Zr, and Rb, and mobile elements are K2O, CaO, and Sr. Figure 5 presents ratios TiO2/CaO, Zr/Sr, and Rb/Sr that were most easily interpreted in the context of sedimentation and weathering. The ratios Zr/CaO and Rb/CaO were investigated and seemed nearly equally illustrative but are not presented graphically. Interestingly, ratios of immobile TiO2/K2O or Zr/K2O produce variable trends that were not informative or easily interpreted in the context of paleosol weathering. We are not certain why this is so (the data are in the Supplementary Materials). In general, the paleosol Bt horizons are more strongly weathered and depleted in Ca and Sr, elements common in weatherable plagioclase minerals. Similar to mineralogy, the type of sediment and the source mineralogy, whether loess or sandstone-derived colluvium, also play a large role in the value of any particular ratio.
Geochemical ratios of stable to mobile elements for the Oil City section. Solid horizontal lines separate lithostratigraphy originally identified in Jacobs and Knox (Reference Jacobs and Knox1994). Soil horizonation indicated by shading.

In samples leached of carbonates, the TiO2/CaO ratio is essentially measuring resistant Ti-bearing minerals such as rutile to Ca-plagioclase. The modern solum has a peak value of 0.7 relative to 0.5 in a leached C horizon. The Farmdale Geosol has steadily increasing values down through the profile peaking at 1.2 just above the truncated Sangamon Geosol. The increasing values with depth mimic the Q/P ratio that could reflect sedimentation or changes in the weathering regime. The Sangamon Geosol has a peak value of 1.2 in the uppermost sample, which also contains the greatest amount of clay. The values mostly decrease with depth through the Sangamon, until just above the paleosol in unit 4. The peak value in the paleosol in unit 4 is 2.4 and occurs in the middle of the unit, and the trend does not directly resemble the profile trend in the Q/P ratio. Unit 5 has the highest peak value in the entire profile, likely because of the plagioclase-depleted colluvium derived from sandstone. The paleosol in unit 7 has a peak value of 2.0 at the surface, and values decrease down profile, except a large spike to 2.7 in a loamy colluvial zone near the base.
The Zr/Sr ratio is essentially measuring resistant Zr-bearing minerals such as zircon to Ca-plagioclase. The down section trends in values largely mimic the trend described for TiO2/CaO, with only a few differences in the depth of the peak values or other inflections. The peak value for the modern solum is 2.9 and is at the surface. The Farmdale Geosol peak is 3.5 and does not occur at the base of the unit. The Sangamon Geosol has a peak of 3.5, and values decreases down profile, whereas unit 4 beneath has the peak value in the middle of the unit, similar to the TiO2/CaO ratio. Unit 5 contains the highest ratio value of 6.9, which corresponds with the sand-rich loamy colluvium. The paleosol in unit 7 has a peak value of 5.1, and values decrease down profile until sandstone-derived colluvial layers are encountered.
The Rb/Sr ratio tends to reflect a loss of Sr-bearing minerals—namely, carbonate and plagioclase minerals relative to K-bearing minerals. Given Ca-plagioclase and other Sr-bearing minerals are generally considered more weatherable than framework silicate minerals rich in K, soils tend to become relatively enriched in K-Rb and depleted in Ca-Sr (Chen et al., Reference Chen, An and Head1999). The Rb/Sr ratios vary down the core in a very similar fashion as the TiO2/CaO and Zr/Sr ratios. Values are greatest in paleosol unit 5 (loamy colluvium), which was originally enriched in K-feldspars and depleted in plagioclase. The other high values are in the paleosols in unit 4 and unit 7, similar to the other ratios. The Sangamon Geosol has values lower than unit 6 (C horizon silty colluvium), but slightly greater than the modern solum.
Discussion
Comparisons of paleosol weathering and new stratigraphic implications
Mineralogical and geochemical indices of weathering are greater in interglacial-scale paleosols than the modern soil, and the indices support the interpretations of weathering intensity based on clay mineralogy, micromorphology, and paleosol morphology by Jacobs and Knox (Reference Jacobs and Knox1994). Based on a combination of geochemistry and Q/P ratio values, while cognizant of lithology type, we propose the following ranking of weathering intensity of the paleosols: paleosol in unit 5 > paleosol in unit 4 > paleosol in unit 7 > Sangamon Geosol ≈ Farmdale Geosol > modern soil.
The paleosol in unit 5 formed in sandstone-derived colluvium that ranked most weathered based largely on the dearth of plagioclase feldspars in the source material and is thus not truly comparable with the loess units. All other paleosols are largely formed in loess or reworked loess, so we believe the weathering indices provide a reasonable means of comparison.
At first glance, most surprising is the ranking of the Farmdale Geosol that has Q/P and geochemical ratios, especially near the base, suggesting it has experienced weathering intensity similar to the Sangamon Geosol. This is doubtful given many long-standing observations of lesser weathering intensity of the Farmdale Geosol throughout the Mississippi Valley based on pedology and mineralogy (Follmer, Reference Follmer1983; Leigh, Reference Leigh1994; Grimley et al., Reference Grimley, Follmer, Hughes and Solheid2003; Markewich et al., Reference Markewich, Wysocki, Pavich and Rutledge2011, among many others). Instead, the values from the Farmdale Geosol likely reflect a different source region for the loess. The decreasing indices of weathering up through the Roxana Member loess do support earlier interpretations of the Roxana recording decreasing mineral weathering because of cooling climate (Leigh, Reference Leigh1994). A long-standing question with the Roxana Member loess is the source and origin of the loess, whether the material is from glacial, nonglacial, or lacustrine sources (Johnson and Follmer, Reference Johnson and Follmer1989). Leigh (Reference Leigh1994) and Grimley (Reference Grimley2000) presented mineralogy and other data that indicate the Roxana Member was glacial in origin and has a significant proportion of the sediment related to an as yet unidentified Superior Lobe glacial deposit in the headwaters of the Mississippi River. Unfortunately, the few samples analyzed in this study provide no substantive guidance on source area to resolve this dilemma because the mineral percentages and elemental concentrations we report are within the range of other loess units at Oil City. A second possible reason the Farmdale and Sangamon Geosols have a similar ranking is because the Sangamon profile is truncated in this core. Originally, truncation was interpreted to only have removed the upper solum (A and E horizons), because the remaining 102 cm has the typically distinctive Bt horizon morphology and 7.5YR hues throughout. In contrast though, the average value of TiO2/CaO throughout the solum of the Sangamon Geosol is nearly two times the peak value of the modern solum, suggesting truncation was not so deep as to remove the signature of long interglacial weathering.
The paleosol in unit 4 has weathering signatures of both geochemistry and mineralogy ratios that indicate it is the most weathered loess unit. We believe the high degree of weathering and stratigraphic position as the fourth loess allow reasonable confidence that unit 4 is correlative with the Crowley’s Ridge Silt of the Middle Mississippi Valley and the paleosol with the Yarmouth Geosol (Porter and Bishop, Reference Porter and Bishop1990; Follmer, Reference Follmer1996; Grimley et al., Reference Grimley, Follmer, Hughes and Solheid2003). The Crowley’s Ridge unit has not been formally recognized in Wisconsin, but the greater degree of plagioclase depletion and geochemical ratios fits with the findings of Grimley et al. (Reference Grimley, Follmer, Hughes and Solheid2003) that the Yarmouth Geosol that formed in the Crowley’s Ridge Silt was significantly more weathered than the overlying Sangamon Geosol and the modern soil. The Yarmouth Geosol at Oil City has a peak TiO2/CaO value nearly 3.5 times the modern soil and 2 times the Sangamon Geosol, while Rb/Sr and Zr/Sr are both 1.9 times greater than the modern soil and 1.4 and 1.6 times, respectively, greater than the Sangamon Geosol.
An interesting observation in unit 4 is that the Q/P ratio decreases up through the unit, which may represent decreasing mixing of plagioclase-poor sediment from unit 5 beneath (see Fig. 4). In contrast, the geochemical ratios all peak in the center of the unit. This pattern may indicate the Crowley’s Ridge Silt aggraded slowly or episodically and was weathered to some degree before more loess accumulated and was transformed into part of the Yarmouth Geosol, which has color differences from the Sangamon Geosol above. It is important to note that the Wyalusing Member of the Kieler Formation is not recognized at Oil City. Leigh and Knox (Reference Leigh and Knox1994) described the Wyalusing Member as an initial component (basal couplet) of the Loveland Member with weak pedogenic characteristics. They suggested the Wyalusing Member is analogous with the Roxana Member, which was accumulating as the global climate cooled and the Laurentide Ice Sheet grew. The Wyalusing Member was only found in a few sections and mostly near the western edge of the Driftless Area in thicker proximal loess deposits. If the Wyalusing Member is present at Oil City, it must be fully incorporated into the pedocomplex and may be represented by the decreasing geochemical ratios in the upper part of unit 4.
If we accept that unit 4 is correlative with the Crowley’s Ridge Silt, it provides new insight on the timing of landscape incision in the upper Kickapoo Valley, and by extension, the upper Mississippi Valley. Jacobs and Knox (Reference Jacobs and Knox1994) noted that the entire depositional sequence shifted from being dominated by colluvium in the lower part of the sequence (both sandstone-derived and reworked loess) to exclusively loess in unit 4 and younger units. They proposed the gullies cut off and isolated the strath at Oil City so only loess could accumulate (Fig. 1C). Grimley et al. (Reference Grimley, Follmer, Hughes and Solheid2003) speculated the Crowley’s Ridge Silt in the Middle Mississippi Valley was deposited during MIS 12, on the basis of global ice volumes and that weathering features in the Yarmouth Geosol required more than one interglacial period to develop. Currently, the end of MIS 12 (Termination V) is 424 ka (Lisecki and Raymo, Reference Lisecki and Raymo2005), indicating landscape incision began by that time, if not earlier. This timing is also congruent with the findings of Knox and Attig (Reference Knox and Attig1988) that incision was after the Brunhes-Matuyama polarity reversal, currently estimated at 780 ka (Mark et al., Reference Mark, Renne, Dymock, Smith, Simon, Morgan, Staff, Ellis and Pearce2017).
The second most weathered paleosol is at the base of the stratigraphic section in units 7 and 8. The peak and average values of the geochemical ratios place the degree of weathering as just less than the Yarmouth Geosol in unit 4. The peak TiO2/CaO value is 2.9 times the modern soil and 1.7 times the Sangamon Geosol, and Rb/Sr and Zr/Sr are both 1.9 times greater than the modern soil, and 1.2 and 1.5 times, respectively, greater than the Sangamon Geosol. These values indicate a significant degree of weathering for the soil. Unfortunately, we have no new age control information to inform correlation with other old loess units scattered throughout the Mississippi Valley (see review in Follmer, Reference Follmer1996).
The Oil City loess and paleosol record as an anomaly
The paucity of long loess-paleosol stratigraphic sections in the Driftless Area has long been interpreted to indicate that Pleistocene climatic conditions, including permafrost and sparse vegetation cover, during MIS 2 were not conducive to loess preservation on hillslopes and some uplands (Knox, Reference Knox1989; Leigh and Knox, Reference Leigh and Knox1994; Knox et al., Reference Knox, Leigh, Jacobs, Mason and Attig2011; Mason, Reference Mason2015). In contrast, the Oil City section has been known as a positive thickness anomaly in the regional loess thickness trend of Peoria Loess in the distance-thinning relationships established from a coring network on Driftless Area uplands east of the Mississippi River (Leigh and Knox, Reference Leigh and Knox1994). Figure 1 uses soil survey data to illustrate the potential thickness of loess preserved in the landscape, and it clearly shows that the upland divides north and west of Oil City, and closer to the Mississippi Valley, generally have Peoria Loess thickness much less than that preserved at Oil City. In this landscape, the soils mapped as having loess thickness >100 cm largely occur in footslope positions or other landscape positions at elevations inset below the uplands. Although most of the thick loess deposits are colluvial footslope deposits, the bedrock strath at Oil City appears to be in a sheltered position that could accumulate a full sedimentary record. The thinner loess on uplands indicates that part or all of the period of loess deposition during MIS 2 must have been conducive to erosion (or nondeposition) on uplands. We speculate the uplands may have been too cold or dry to support vegetation cover necessary to trap and preserve dust or that solifluction was more active on the high, exposed landscape segments (e.g., Yan et al., Reference Yan, Xu, Xin, Yang, Wang, Yan and Chen2011; Mason, Reference Mason2015). Instead, the relatively protected setting of the Oil City site, set in below the uplands and topographically isolated by gullies, must have allowed enough vegetation growth to trap dust deposits through multiple glacial-interglacial cycles (Fig. 1C). This is especially true for the period after gully incision isolated the strath remnant. Thus, the Oil City section is likely the best record of the potential loess thickness at a distal sedimentation site in the northern Driftless Area. Furthermore, the completeness of the stratigraphic section at Oil City indicates long-term stability and high preservation potential.
As a final note, recent weathering studies in Mississippi Valley loess have focused on Na as the most sensitive element for tracking weathering in modern soils and paleosols (Muhs et al., Reference Muhs, Bettis, Been and McGeehin2001; Grimley et al., Reference Grimley, Follmer, Hughes and Solheid2003). Unfortunately, the current pXRF technology is limited to detecting elements heavier than Na. From this study, it appears that CaO and Sr associated with Ca-plagioclase minerals are sensitive and reliable mobile elements that should be useful in loess deposits that have been leached of carbonates. When carbonates are present in the soil, they will overwhelm the Ca signal through concentrations an order of magnitude (or more) greater (see CaO values in the Supplementary Materials). The Sr signal may still reflect Ca-plagioclase depletion, but the occurrence of Sr in carbonates will likely complicate the interpretation. The pXRF appears satisfactory in measuring more stable elements—K2O, TiO2, Rb, and Zr—which can be used to normalize the concentration of mobile elements.
In conclusion, mineralogical and geochemical indices of weathering generally support earlier interpretations of weathering intensity of the paleosols at Oil City based on morphology, micromorphology, and clay mineralogy. Unfortunately, overlapping sola, lack of C horizon loess, and sparse age control prevent any attempt to disentangle climate versus time relationships in the weathering sequence. All lines of evidence—morphological, mineralogical, and geochemical—converge and support interpretations of the degree of mineral weathering in a leaching climate of the loess-derived paleosols. The use of pXRF for rapid determination of geochemistry appears to be a reliable and efficient means of analysis assuming appropriate calibrations and cautions are heeded. Geochemical indices determined with the pXRF are generally less variable with depth and show closer consistency with previously established lithologic breaks than mineralogy determined by XRD. Our results support the use of pXRF for stratigraphic and weathering studies of Quaternary sediments.
Acknowledgments
Funding for the original work was supported by National Science Foundation (NSF) grants (EAR-8707504 and EAR-8904352) to James C. Knox. This study was supported by the Richter Family Scholarship, the Undergraduate Research Program of the University of Wisconsin–Whitewater, and an NSF grant (BCS-0751772) to PMJ. Many thanks to Grace Barrett for geographic information system help.
Supplementary materials
For supplementary material/s referred to in this article, please visit https://doi.org/10.1017/qua.2017.85



