
I. INTRODUCTION
Accumulative roll bonding (ARB) is a method of severe plastic deformation (SPD), which enables to produce high-strength sheets, i.e., semifinished products of technical relevance. Reference Saito, Tsuji, Utsunomiya, Sakai and Hong1–Reference Tsuji, Zehetbauer and Zhu3 There exist several possibilities to vary the strength, such as roll bonding sheets of the same or of different kinds of materials up to a certain number of cycles. The strength increase results from an enormous defect production (mainly dislocations and grain boundaries) during SPD, which finally leads to a different steady state microstructure in each material. For multilayered ARB laminates, the limiting grain size in the normal direction (ND) can be the layer thickness if the interfaces act as barriers.
It is a great challenge during ARB cycling to keep continuous layers by preventing necking and shear band formation. Recently, perfect laminates of high and technical purity aluminum were successfully produced by Chekhonin et al. Reference Chekhonin, Beausir, Scharnweber, Oertel, Hausöl, Höppel, Brokmeier and Skrotzki4 by ARB up to 10 cycles without any annealing steps. In these ARB sheets, the high-purity layers dynamically recrystallize at room temperature, while the technical purity layers develop an ultra-fine grained (UFG) microstructure.
It is the aim of the present work to investigate in detail the microstructural changes of these laminates during annealing at elevated temperatures. Especially the influence of the bonding interfaces (that are a consequence of the ARB process) on recrystallization and grain growth is investigated for different ARB cycle numbers and, therefore, layer thicknesses.
As will be presented here, this material combination facilitates the design of a well-defined grain structure that might be transferred to other material combinations. For one specific case, the microstructure was simulated using a modified Monte Carlo Potts model and compared to the experimental counterpart.
II. EXPERIMENTAL
Cold-rolled aluminum sheets of high (5N or 99.999 wt% Al) and technical purity (2N+ or 99.5 wt% Al) with a thickness of 1 mm each were annealed at 500 °C for one hour. After wire brushing, the sheets were roll bonded at ambient temperature by a four-high rolling mill (Carl Wezel, Mühlacker, Germany) with a pass reduction of 50%. The rolls had a diameter of 32 mm, the rolling speed was 8 m/min; no lubrication was used. The rolling direction (RD) of the sheets was maintained during all rolling passes. Samples with one to ten ARB cycles were produced resulting in sheets with an asymmetric through-thickness distribution. Reference Chekhonin, Beausir, Scharnweber, Oertel, Hausöl, Höppel, Brokmeier and Skrotzki4 Sheets after 2, 4, 6, 8, and 9 ARB cycles were annealed for one hour at 100, 200, 300, and 400 °C.
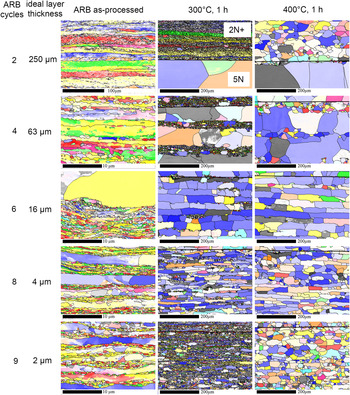
The investigation of the microstructure was carried out by backscatter electron (BSE) imaging and electron backscatter diffraction (EBSD) in a Zeiss ULTRA 55 scanning electron microscope (SEM; Carl Zeiss AG, Oberkochen, Germany) equipped with a Nordlys EBSD detector (Oxford Instruments plc, Abingdon, United Kingdom) on planes normal to the transverse direction (TD). As the microstructure changed significantly with increasing ARB cycle number in the as-processed ARB sheets and also after annealing at 300 °C or higher temperatures, the EBSD mappings were recorded under different conditions. For example, where the grain size of the high-purity layers is comparably small (e.g., after 8 or more ARB cycles in the as-processed sheets), a step size of 0.1 µm and an acceleration voltage of 15 kV were used. After annealing at 300 °C or higher temperatures, the step size was set between 0.5 and 1 µm using an acceleration voltage of 20 kV. The size of the covered area was chosen such that as many different layers with reasonable resolution as possible were mapped. For this work, representable excerpts of these EBSD mappings are shown in Fig. 1. The automatic indexing of the Kikuchi pattern was done by the HKL Channel 5 acquisition software (Oxford Instruments, Witney, United Kingdom). The overall indexation rate varied between about 70% (e.g., after 9 ARB cycles in the as-processed sheets) to more than 90% (in all sheets after 400 °C annealing). It should be pointed out that the indexation rate in the recrystallized parts (typically the high-purity layers) was always significantly higher in comparison to the nonrecrystallized parts (typically the technical purity layers). Therefore, the data cleaning of the Channel 5 software may have some effect on the nonrecrystallized parts of the covered area.
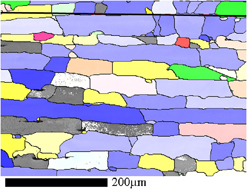
EBSD orientation map of ARB aluminum laminate sheets in the as-processed state (left column) and annealed for 1 h at 300 °C (center column) and 400 °C (right column). The number of ARB cycles and the ideal layer thickness for each row is given on the left. The thick black lines mark the central interface of the aluminum sheets. RD is horizontal, ND vertical. The color code is given in Table I. For the as-processed sheets at 2 and 4 ARB cycles, only the technically pure layers are shown because the high-purity layer at the magnification chosen would only be represented by part of a single grain.

For analysis of the orientation maps the software EBSDmcf Reference Beausir and Fundenberger5 (Benoit Beausir, LEM3, Metz, France) and for evaluation of the BSE images the software SmartTIFF (Carl Zeiss SMT, Oberkochen, Germany) were used. The grain size was determined manually by the line intercept method using the BSE images.
Specimen preparation for SEM and EBSD investigations was done by mechanical grinding (last step: wet SiC-paper 2400 grid) and electro-polishing with 9 vol% perchloric acid in 91 vol% ethanol at 42 V polishing voltage using external cooling.
III. EXPERIMENTAL RESULTS AND DISCUSSION
In a previous publication Reference Chekhonin, Beausir, Scharnweber, Oertel, Hausöl, Höppel, Brokmeier and Skrotzki4 on the same aluminum laminates, the authors demonstrated that with the increasing number of ARB cycles, the 2N+ layers develop an ultra-fine grained microstructure by continuous dynamic recrystallization, while discontinuous dynamic recrystallization occurs in the 5N layers, leading to a coarse-grained microstructure. There it was shown that without annealing, the recrystallized volume fraction in the 5N layers has a plateau at about 90% between 2 and 6 ARB cycles, while this fraction rapidly decreases to about 30% and drops even further to almost zero after 8 and 9 ARB cycles, respectively.
After annealing, the results obtained by BSE imaging and EBSD indicate different microstructural changes in these sheets depending on the annealing temperature and number of ARB cycles applied. Figure 1 shows the EBSD orientation contrast images Reference Chekhonin, Beausir, Scharnweber, Oertel, Hausöl, Höppel, Brokmeier and Skrotzki4 after 2, 4, 6, 8, and 9 ARB cycles of the as-processed sheets and for annealing temperatures of 300 and 400 °C. The orientation of each point of the mapping is compared with the ideal orientations of both the rolling and recrystallization texture components of face-centred cubic metals, which are provided in Table I. The color corresponds to that ideal orientation with which the disorientation has the smallest value. If a limit of 25° is exceeded for all given ideal orientations, the band contrast is plotted instead on a gray scale. With increasing deviation from the ideal orientation, the color fades to white. Orthorhombic specimen symmetry is presumed. Using the color code provided in Table I, it can be estimated that after recrystallization, the texture is mainly dominated by the cube orientation, which is in agreement with general observations. Reference Wassermann6 To make a clear distinction, the changes were subclassified into four different cases A to D, determined by the interplay of grain boundary mobility and driving force for grain boundary migration. The mobility of grain boundaries depends on the temperature and impurity content, while the driving force results from the ARB-induced defect density.
Color coding of selected ideal orientations with corresponding Euler angles.

0° (disorientation) 25°.
A. Case A: after any number of ARB cycles and annealing temperatures below 300 °C
In all ARB sheets at annealing temperatures below 300 °C, no recrystallization was observed in the 2N+ layers. Some recovery may have occurred, but this is not the focus of this work, and a detailed investigation of the 2N+ layers has not been carried out.
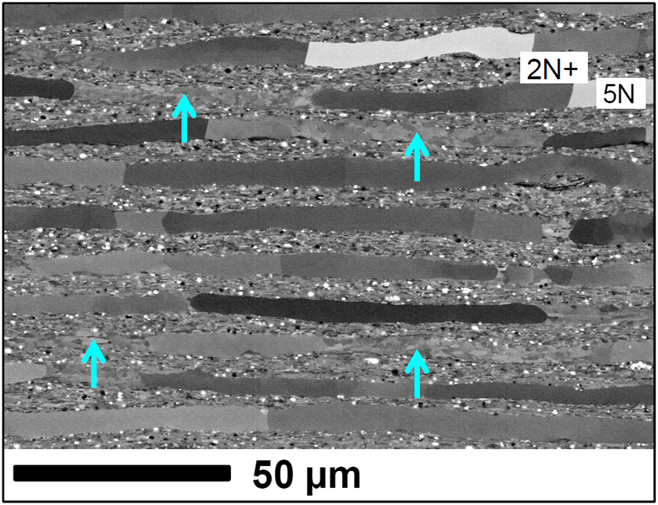
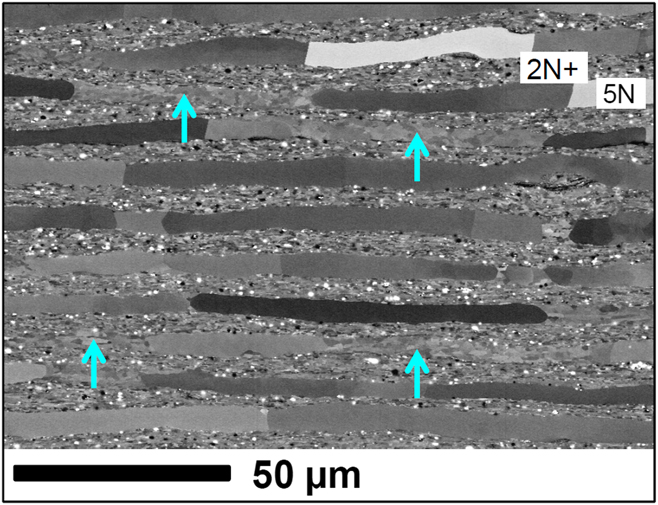
In contrast, the recrystallized volume fraction of the 5N layers changed for some of the sheets. This is demonstrated in Fig. 2 with a representative BSE image of the aluminum sheet after 8 ARB cycles annealed at 200 °C. The 5N layers are almost totally recrystallized, which was definitely not the case in the as-processed sheets before annealing, as is demonstrated in Ref. Reference Chekhonin, Beausir, Scharnweber, Oertel, Hausöl, Höppel, Brokmeier and Skrotzki4. Presumably, the same happened in the 5N layers of the sheets with less ARB cycles. However, to prove the difference to the preannealing state, a significant experimental effort is required which is not the goal of the present work.
BSE image of the sheet after 8 ARB cycles and 200 °C annealing. The high-purity aluminum is recrystallized, only a few nonrecrystallized areas remain (cyan arrows). RD is horizontal, ND vertical.
In contrast, such changes are not present in the 5N layers after 9 ARB cycles. Due to the very high purity in the 5N layers, the grain boundary mobility is very high. Therefore, recrystallization may have already appeared at ambient temperatures Reference Humphreys and Hatherly7 and was reported in previous publications. Reference Kassner, McQueen, Pollard, Evangelista and Cerri8,Reference Skrotzki, Scheerbaum, Oertel, Brokmeier, Suwas and Tóth9 As was discussed in detail in Ref. Reference Chekhonin, Beausir, Scharnweber, Oertel, Hausöl, Höppel, Brokmeier and Skrotzki4, due to spatial confinement after 7 or more ARB cycles, a retarding force is affecting the grain boundaries in the 5N layers. This force hampers the grain boundary motion in RD and TD, leading to a significant decrease in the recrystallized volume fraction. However, because of the spatial confinement the nucleation rate in the 5N layers is reduced as well. Reference Chekhonin, Beausir, Scharnweber, Oertel, Hausöl, Höppel, Brokmeier and Skrotzki4 This is especially important after 9 ARB cycles, where before annealing almost no recrystallized areas in the 5N layers were observed at all.
Thus, the observations after low annealing temperatures can be qualitatively understood as follows: The grain boundaries of the already present recrystallized grains in the 5N layers overcome the above mentioned retarding pressure. Therefore, no additional nucleation is required and after 8 (and presumably less) ARB cycles, these grain boundaries migrate into the remaining nonrecrystallized parts of the 5N layers. After 9 ARB cycles however, annealing temperatures of 200 °C or below are not high enough to initiate any additional nucleation. Consequently, after 9 ARB cycles besides some recovery, the microstructure remains unaffected.
B. Case B: after 2 to 4 ARB cycles and annealing temperatures of 300 °C and 400 °C
Obviously, static recrystallization is not limited to the 5N layers anymore. After 2 and 4 ARB cycles and annealing at 300 °C, new grains appear in the 2N+ layers, while the major volume fraction of the 2N+ layers keeps the deformed microstructure (presumably with some recovery). Additionally, the boundaries of the 5N+ layers migrate into the 2N+ layers. In comparison to ARB sheets after 2 cycles, this trend is more obvious after 4 ARB cycles. This can be explained by the higher driving force present in the 2N+ layers after more ARB cycles. As demonstrated in Fig. 1, when the annealing temperature is 400 °C, the deformed microstructure in the 2N+ layers completely disappears. Obviously, there are two competing processes: static recrystallization within the 2N+ layers and the migration of grain boundaries of the 5N layers into the 2N+ layers. The latter process is favored for higher ARB cycles, which leads to the special case C after 6 ARB cycles. The driving force for the layer overlapping growth is provided by the consumption of the UFG microstructure of the 2N+ layers. It is an essential precondition that the retarding force resulting from the impurities in the 2N+ layers is overcome.
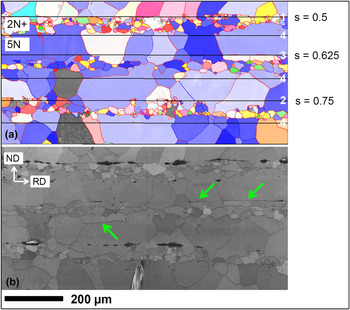
The migration of the boundaries of the 5N+ layers into the 2N+ layers is not homogeneous throughout the ARB sheets, as demonstrated in Fig. 3 for the laminate after 4 ARB cycles annealed at 400 °C. To describe the measurement position in Fig. 3(a) the parameter s is introduced, with s = 0, 0.5, and 1 referring to the top, middle, and bottom of the sheet, respectively.
(a) EBSD orientation map of the ARB aluminum sheet after 4 ARB cycles annealed for 1 h at 400 °C. The color code is given in Table I. High-angle grain boundaries (>15° misorientation) are in red, low-angle grain boundaries (<15° misorientation) are in blue. The black lines mark the interfaces between 5 and 2N+ layers. The age of the interface is given with white number. The parameter s describes the position with respect to the top edge of the sheet with s = 0, 0.5, and 1 referring to the top, middle, and bottom of the sheet, respectively. (b) The EBSD band contrast map of the same area. The green arrows mark interfaces with ages of 3 and 4.

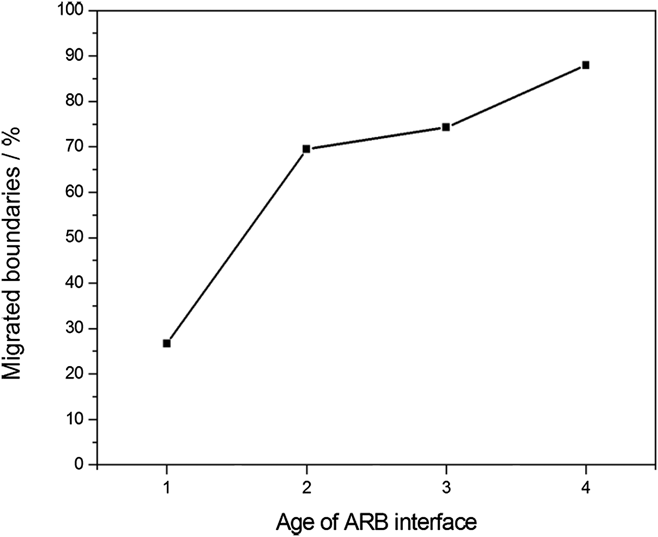
Along the central interface (s = 0.5), the grain boundaries of the 5N+ layer mostly do not cross this interface. This is a strong contrast to other interfaces, where grain boundary migration into the 2N+ layer is the rule rather than the exception. To distinguish the interfaces, it makes sense to define an arbitrary parameter that will be referred to as the “age” of the interface. Age of 1 refers to the central interface at s = 0.5 which was formed during the last ARB cycle. The interfaces at s = 0.25 and s = 0.75 have an age of 2, etc. Consequently, in the sheet after 4 ARB cycles there will be 8 interfaces that have an age of 4 and originate from the very first ARB cycle. The fraction of the interface along which the grain boundaries from the 5N layer migrate into the 2N+ layer as a function of the interface age was estimated from BSE images using the line intercept method. The results shown in Fig. 4 indicate a major increase from below 30% to over 70% as soon as the age increases to 2.
The percentage of interface area between the 5N and 2N+ layers of the sheet after 4 ARB cycles annealed for 1 h at 400 °C, where the boundary of the 5N layer migrated into the 2N+ layer as a function of the age of the ARB interface.

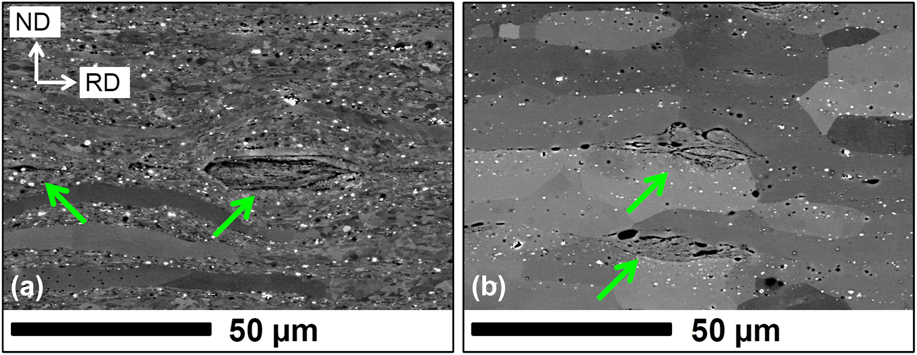
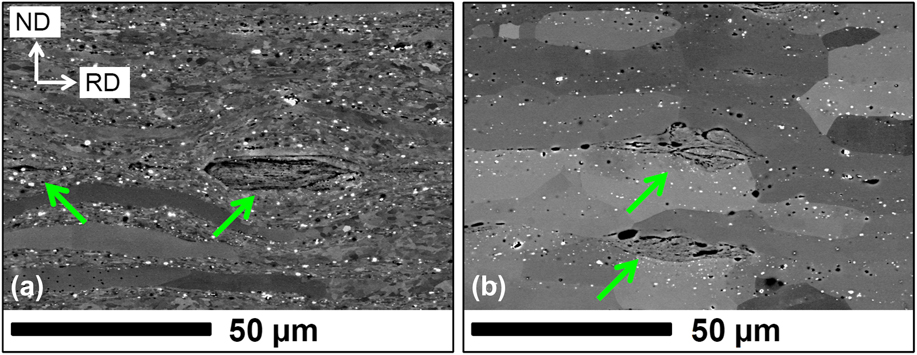
It is concluded that especially the last ARB cycle leads to an additional obstacle for grain boundary migration at the central interface. It is known, that in ambient atmosphere, aluminum forms a thin oxide layer (alumina) with a thickness of a few nm. Reference Evertsson, Bertram, Zhang, Rullik, Merte, Shipilin, Soldemo, Ahmadi, Vinogradov, Carlà, Weissenrieder, Göthelid, Pan, Mikkelsen, Nilsson and Lundgren10 Due to wire brushing in-between each ARB cycle, the surface affected by oxidation is presumably increased and definitely not plane anymore. This fine alumina layer acts as additional pinning in the central interface preventing the boundary from moving. Presumably, after additional ARB cycles, the alumina layers at the interfaces of higher age break, and the surface area of clean interfaces doubles. Therefore, the mean alumina particle distance increases with higher age so that the probability of a 5N boundary to migrate into the 2N+ layer increases. In reality, the alumina layer might not be homogeneous after wire brushing and subsequent roll bonding, so the picture of homogenously distributed alumina particles is likely oversimplifying. As a matter of fact, in the as-processed ARB sheets at the bonding interface, oval-shaped fine-grained particles were observed [Fig. 5(a)]. After annealing, even at 400 °C, these structures do not disappear [Fig. 5(b)]. In a study on nickel sheets produced by ARB by Mishin et al., Reference Mishin, Zhang and Godfrey11 it is reported that these are iron particles arising after wire brushing. In the present work, however, the BSE image contrast and results obtained by energy dispersive X-ray spectroscopy (EDX, not shown here) do not indicate anything else but aluminum and some oxygen in these oval-shaped particles. It should be noted that in the SEM used, the EDX system is not good enough to provide reasonable accuracy for low Z-elements like oxygen. It may be speculated that in the present case, the oval-shaped particles are also formed by wire brushing and contain alumina particles that stabilize them against recrystallization. Regarding EBSD, the pattern quality and the indexation rate are comparably low at these places. As is evident from Fig. 3(b), where the band contrast of the same mapped area is shown [Fig. 3(a)], these particles are especially dominant at recently bonded interfaces with ages of 1 and 2. Therefore, at the recently bonded interfaces, these particles play an important role as additional grain boundary barriers. However, there are several examples [marked by green arrows in Fig. 3(b)] which rather indicate an extended thin grain boundary barrier that presumably consists of small oxide particles. A detailed analysis on the composition and the spatial distribution of the oval-shaped particles and the assumed small oxide particles was not carried out. Therefore, further research is necessary to provide a better understanding of this issue.
BSE images of the sheet after 8 ARB cycles (a) before annealing and (b) after annealing at 400 °C.
C. Case C: after 6 ARB cycles and annealing temperatures of 300 and 400 °C
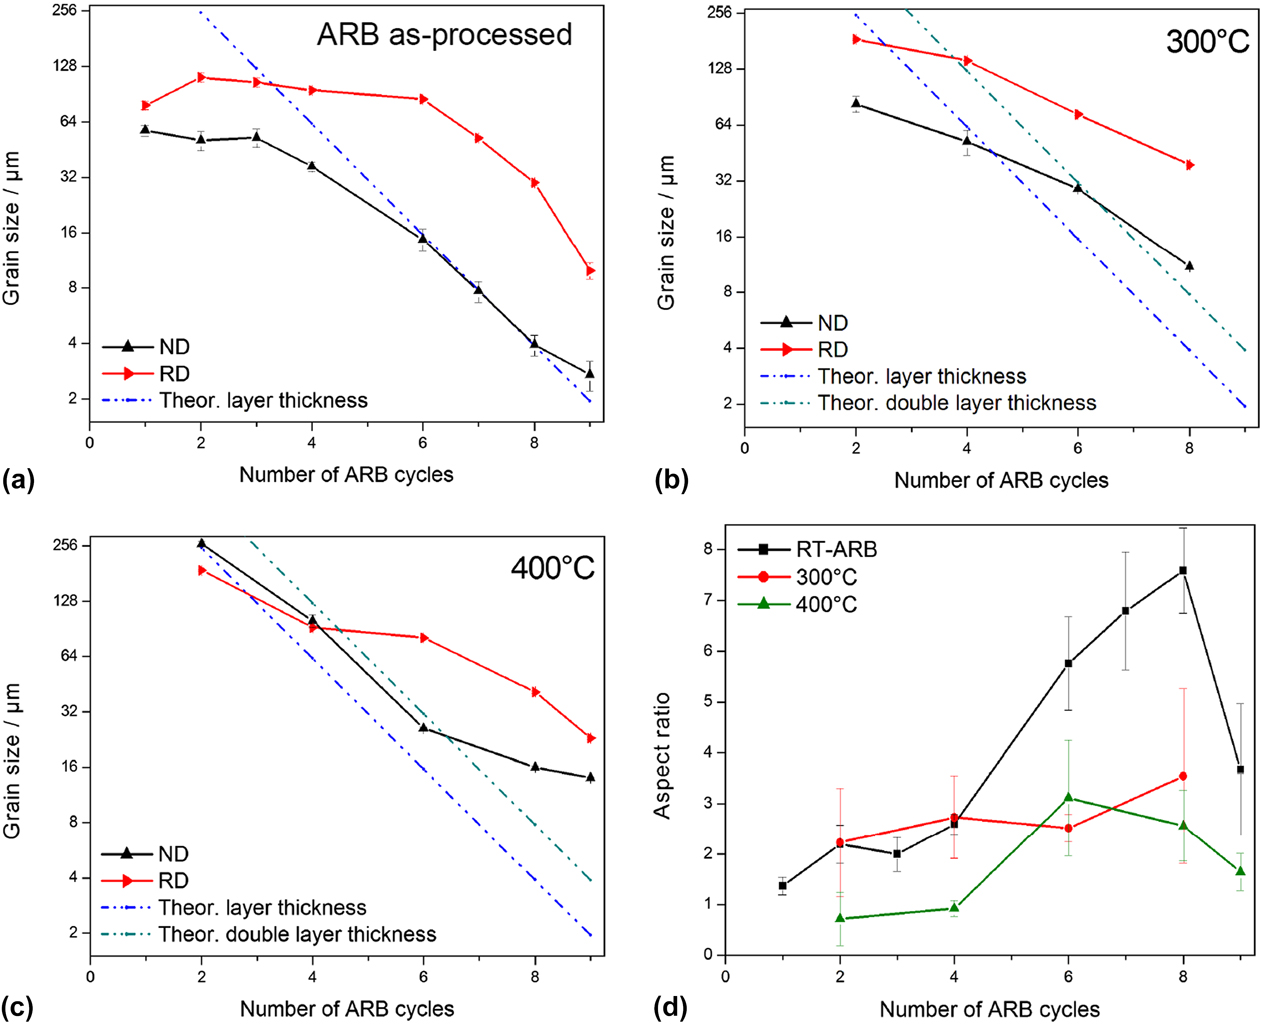
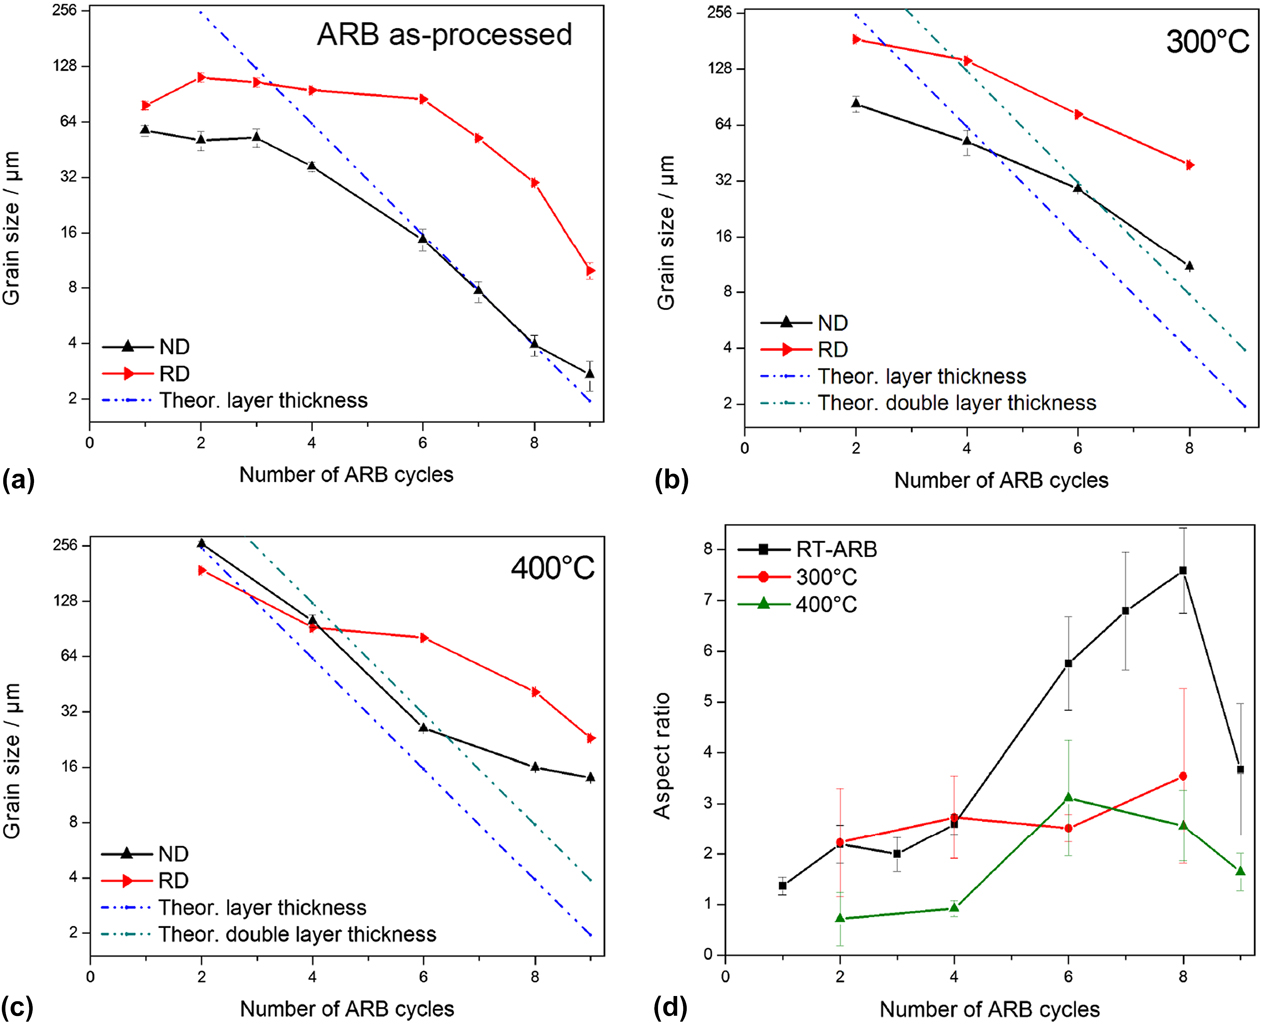
For sample status after 6 ARB cycles and annealing temperatures of 300 and 400 °C, Fig. 1 presents a banded (“brick wall”) grain structure. The grain boundaries of the 5N layers migrate into the 2N+ layers until they meet at about the center of the 2N+ layers. Obviously, the recrystallization process (nucleation and growth of nuclei) inside the 2N+ layers is insignificant. The new grain size along the ND is therefore very close to the theoretical double layer thickness of 32 µm. This is pointed out in Fig. 6 which presents the size of recrystallized grains along RD and ND as a function of ARB cycles. After consumption of the 2N+ layers, the driving force for further growth in ND is low stabilizing the banded structure. It is also seen in Fig. 6(d) that the grain aspect ratio has a maximum of about 3. This value is smaller than that of the as-processed laminate (about 6 after 6 ARB cycles) because of grain growth in ND across the N2+ layers, which does not take place in the as-processed laminate (Fig. 1).
Average grain size in RD and ND of the high-purity layers in the ARB as-processed state (a) and after annealing for one h at 300 °C (b) and 400 °C (c) in comparison with the ideal layer thickness for each ARB cycle. After 6 and more ARB cycles in the annealed state, no distinction is made between high purity and technical pure layers. The grain aspect ratio is given in (d).
D. Case D: after 9 ARB cycles and 400 °C annealing temperature
As shown in Fig. 1, after 9 ARB cycles and at an annealing temperature of 400 °C, a nearly globular grain structure develops with a grain size along ND which is significantly larger than twice the layer thickness [Fig. 6(c)]. Because there are almost no recrystallized areas in the 5N layers before annealing, the authors argue that in the present case, nucleation and grain growth not only in the 5N but also especially in the 2N+ layers can explain the observed microstructure as well as the texture. In contrast to most of the previous cases, with the comparably high amount of stored energy in the 2N+ layers after 9 ARB cycles annealing at 400 °C can lead to fast recrystallization in these layers together with subsequent interlayer grain growth leading to a less elongated grain shape. This argument is supported by Fig. 1, from which it can be estimated that there are less blue colored grains in case D, and, therefore, the cube texture is likely weaker in comparison to the cases with smaller ARB cycle numbers when annealed at 400 °C. In Ref. Reference Chekhonin, Beausir, Scharnweber, Oertel, Hausöl, Höppel, Brokmeier and Skrotzki4 it was shown that in the preannealing state, the texture of the 5N layers mainly consists of the Cube component with some minor “tilted Cube” component (tilted about TD) which was explained by the influence of shear at the sheet surfaces. A tilt of 45° is equivalent to the rotated Goss component. After annealing at 400 °C for ARB cycle numbers of 4–8, the specimen volume is mostly dominated by grains that originate in the 5N layers and is expanded into the rest of the specimen. Therefore, it is reasonable to assume that the texture after annealing will be inherited from the texture of those grains, resulting in the strong Cube and tilted Cube components. In the case after 9 ARB cycles, however, before annealing, there are practically no recrystallized grains in the 5N layers. Thus, the nucleation probably is not limited to the 5N layers anymore, which may result in a different texture. A speculation can be given, why in this case the Cube component appears to be weaker, if compared to the states after 4 to 8 ARB cycles after annealing at 400 °C. The grain boundary mobility is usually higher for higher misorientation angles. From the texture measurements in Ref. Reference Chekhonin, Beausir, Scharnweber, Oertel, Hausöl, Höppel, Brokmeier and Skrotzki4, it can be concluded that before annealing, parts of the 5N layers still have the Cube texture. They recrystallized as the Cube texture after the previous ARB cycles and after just one or two ARB cycles were not yet completely rotated toward some rolling deformation textures (β-fibre components). Therefore, during annealing, some Cube textured nuclei may not grow as fast into the 5N layers because the mobility is decreased by small disorientation angles toward their surrounding grains. As a result, nuclei with different orientations may grow faster, thus leading to a weaker Cube texture. On the other hand, after 9 ARB cycles and an annealing temperature of 300 °C, the microstructure of the whole sheet is comparable to that of the 2N+ layers of case B. At 300 °C, it may be assumed that the 2N+ layers do not recrystallize as fast as the 5N layers. Therefore, most of the grains observed in this state presumably nucleated in 5N layers, and their strong Cube texture appears to remain. For more details on this matter statistically reliable texture measurements are necessary.
With the spacing between layers of different purities is reduced to about 2 µm after 9 ARB cycles, the reduction of the purity of the 5N layer due to diffusion of impurities from the 2N+ layer at 400 °C may be of interest. The grain boundary mobility is very sensitive to impurities, and it was already observed that 4N aluminum sheets do not recrystallize at room temperature but develop an UFG microstructure comparable to one of the technically pure aluminum. Reference Kamikawa, Tsuji, Huang and Hansen12,Reference Sun, Li and Hsu13 However, even with known diffusion coefficients of all impurities in aluminum, a precise calculation of the effect caused by diffusion is difficult because an unknown amount of impurities is stored in the precipitates of the 2N+ layer. Additionally, the exact time scale of the recrystallization process and the subsequent grain growth is yet unknown, so assuming one hour for diffusion may not be valid.
The annealed sheets after 8 ARB cycles can be classified as a mixture of cases C and D. While the banded grain structure is generally preserved, in contrast to case C, in some areas, the grain boundaries migrate across several former layers. This is especially the case after annealing at 400 °C.
In Ref. Reference Chekhonin, Beausir, Scharnweber, Oertel, Hausöl, Höppel, Brokmeier and Skrotzki4 it was shown that the grains in the 5N layers have a comparable grain size along RD and TD. It is presumed that this similarity remains after annealing. Therefore, the banded grain structure is better described by grains flattened along ND. It may be speculated that such grain structures may also be achieved by using thinner layers of high purity, e.g., by applying ARB to 2N+/5N/2N+ “sandwich” sheets. Instead of technically pure aluminum, aluminum alloys or other metals may be used, too. The high-purity layers may occupy much lesser than 50% of the volume fraction. The important point is that the thin high-purity layer in-between would just act as a source of nuclei. Consequently, ARB facilitates the production of sheets with flattened grains which might be relevant for technical applications, where the grain shape is important. For example, the electrical and thermal resistivity may become anisotropic, i.e., lower in RD and TD compared to ND.
IV. SIMULATION METHOD, RESULTS AND DISCUSSION
Beginning in the early 1980s, computer simulation algorithms have been developed that provide a deeper understanding of coarsening in polycrystalline materials under thermal treatments. Due to numerous possible applications, different simulation methods have been developed on the mesoscopic size scale, e.g., Monte Carlo Potts model, phase-field method, surface evolver, and vertex method, which enable researchers to analyze large grain structures over long annealing times, to manipulate structural parameters in a very selective manner and last but not least to perform comparisons with experiments.
From the above methods the Monte Carlo Potts model has the advantage of being rather simple in its basics but can be extended to very complex problems allowing to model, e.g., anisotropic and abnormal subgrain growth, texture-controlled grain growth, the influence of second phase particles, and junction-limited grain growth as it may occur in nanocrystalline materials.
The Potts model is a sharp interface model, in which classically only two material parameters are incorporated, namely the grain boundary energy per unit length, γ, and the grain boundary mobility, m. Both parameters are assumed to depend on the misorientation of the neighboring grains and can be calculated using the Read–Shockley-equation and the Huang–Humphreys-relation, respectively. Additionally, information on the initial microstructure has to be known. In practice, a continuous grain structure characterized by a well-defined initial grain size distribution with a given number of grains and grain orientations is mapped onto a lattice with a total of N lattice points. For the lattice, the local interactions between neighboring lattice points have to be defined by assuming, e.g., in two-dimensional simulations, a quadratic lattice with eight nearest neighbors, nn = 8. In addition, the boundary conditions that describe the global edge of the lattice usually depend on the application.
Applying the standard Potts model algorithm, the smallest time unit of the simulation comprises N reorientation attempts, where each reorientation attempt itself consists of four steps:
-
(i) A lattice point is chosen at random.
-
(ii) A new state is generated by changing the orientation of the selected lattice point to one orientation out of all neighboring ones. The restriction eliminates any nucleation effects.
-
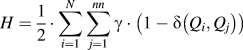
(iii) The energy of the two states is calculated each given by the Hamiltonian
 $H = {1 \over 2} \cdot \sum\limits_{i = 1}^N {\sum\limits_{j = 1}^{nn} {\gamma \cdot \left( {1 - \delta \left( {{Q_i},{Q_j}} \right)} \right)} }$
, where the specific grain boundary energy per unit length, γ, measures the interaction of the i-th lattice point with all neighboring ones. The Kronecker delta function is equal to one if the neighboring orientations, Q
i
and Q
j
, are the same and zero otherwise.
-
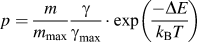
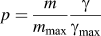
(iv) The final orientation of the selected lattice point is selected with a probability of
$p = {m \over {{m_{\max }}}}{\gamma \over {{\gamma _{\max }}}} \cdot \exp \left( {{{ - \Delta E} \over {{k_{\rm{B}}}T}}} \right)$
if ΔE > 0 and
$p = {m \over {{m_{\max }}}}{\gamma \over {{\gamma _{\max }}}}$
if ΔE ≤ 0, where m is the aforementioned grain boundary mobility and k
B
T is the simulation temperature. The constants m
max and γmax describe the maximum values of mobility and energy, respectively. Under the assumption of normal grain growth, i.e., ideal coarsening, where only high-angle grain boundaries exist, m = m
max and γ = γmax.
Further details can be found in the review article. Reference Zöllner and Hashmi14
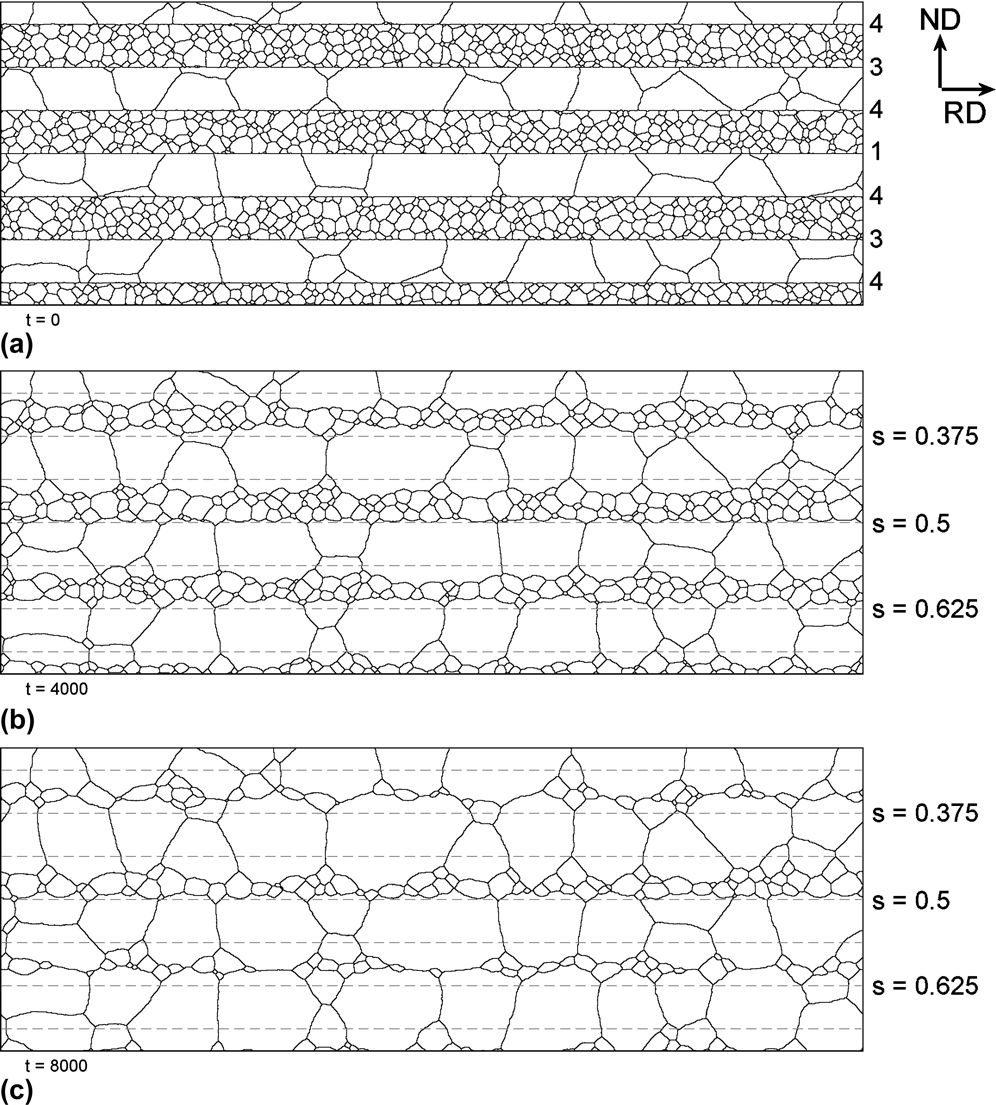
In the present investigation, the focus of interest is on the microstructural development in the RD-ND-plane as shown in Fig. 1. The present first step of investigation is focused on the basic principle of coarsening. Particularly, we focus on case B (restricted to 400 °C annealing temperature) and assume that the recrystallization process inside the fine-grained layers is insignificant, and the grain boundaries of the coarse-grained layers mainly migrate into the fine-grained already recrystallized layers. To that aim, a two-dimensional grain microstructure is generated digitally with layers of initially fine and coarse grains [Fig. 7(a)]. Each grain has its individual orientation, although it is assumed in the present work that all grain boundaries are of high-angle type. It is furthermore assumed that the purity of the layers as well as the interlayers is characterized by different migration velocities, which is represented in the Potts model by different boundary mobilities. In the case shown in Fig. 7, the mobilities are as follows: The grain boundaries within the high-purity coarse-grained layer are assumed to have the highest mobility. Since all boundaries are modeled as high-angle boundaries
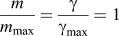 ${m \over {{m_{\max }}}} = {\gamma \over {{\gamma _{\max }}}} = 1$
follows. The fine-grained layers consist of the technical pure aluminum, and their grain boundaries are supposed to have a lower mobility that is with
 ${m \over {{m_{\max }}}} = 0.5$
not so low as to completely prevent coarsening within the layers. However, nucleation processes and the additional driving pressure stored in the 2N+ layers in form of dislocations and low-angle grain boundaries following the deformation process are not taken into account.
Grain microstructure of the simulated ARB aluminum sheet after 4 ARB cycles. (a) Initial structure (t = 0), (b) evolved structure after 4000 annealing time steps, and (c) evolved structure after 8000 time steps. The dashed lines mark the original interfaces between 5N and 2N+ layers. The variable t refers to the simulation time, but the unit is arbitrary.

In addition, it is assumed that the roll bonding process generates interfaces between neighboring layers, the structure of which depends on the number of ARB cycles (compare discussion above). Hence, their motion is inhibited depending on the number of ARB cycles: the newest interface has the lowest mobility with
 ${m \over {{m_{\max }}}} = 0.1$
, and the oldest interfaces have the highest with
 ${m \over {{m_{\max }}}} = 0.8$
. Therefore, inhomogeneities in the distribution of particles at these interfaces are neglected.
The simulated grain microstructures of the ARB aluminum sheet after 4 ARB cycles is given in Fig. 7: the top image shows the initial structure [Fig. 7(a)], while Fig. 7(b) shows the evolved structure after 4000 annealing time steps, and Fig. 7(c) shows the structure after 8000 time steps. It is evident that the 5N layers grow into the 2N+ layers (dashed lines mark the original interfaces between 5N and 2N+ layers), while there is still some coarsening in the 2N+ layers. Also, the interfaces between the layers move at slightly different speeds, where the newest interface (marked with s = 0.5) moves the slowest in agreement with Fig. 3(a). Overall, there is a good qualitative agreement between the experimentally obtained microstructure after 4 cycles annealed at 400 °C [Fig. 3(a)] and the simulated one in Fig. 7.
In addition, the initial aspect ratio between grain sizes along the RD-direction and ND-direction of the 5N layers is the same as for the experiment after 4 cycles [Fig. 6(d)]. The temporal evolution of the aspect ratio shows a reduction and ends up at a similar value as observed in the experiment for 400 °C.
The main anisotropy of the microstructure is in the normal direction; however, along TD (the direction, which is not considered in the simulation) the microstructure is presumably comparable to RD. Hence, we argue that an extension of the simulation to three dimensions could give qualitatively similar results. In contrast, it has been demonstrated in Ref. Reference Zöllner and Skrotzki15 that the existence of low-angle grain boundaries, which are present in the 2N+ layers before annealing, strongly influences the coarsening process. Therefore, to increase the matching accuracy and the predictability of the model in future investigations, we suggest, apart from an extension to 3D, to incorporate the texture and differences in the driving pressure between 5N and 2N+ layers and most importantly to implement the velocities, with which the grain boundaries and layer interfaces move, instead of using rough estimates—although it has been shown above that there is a good agreement between simulation and experiment. To that aim, further experiments are needed including texture measurements and microstructural analyses of intermediate states for shorter annealing times.
As an outlook, for simulations of the annealing of microstructures for other ARB cycle numbers, different assumptions regarding the initial conditions and nucleation within the layers should be taken into account.
V. CONCLUSIONS
The present work examines the microstructure development of technical purity/high-purity aluminum ARB laminates after annealing. The results presented reveal severe differences depending on the number of applied ARB cycles and the annealing temperature. It is shown that under a certain interplay of grain boundary mobility and the driving force for grain boundary migration, the microstructure is dominated by grains flattened along ND representing a so-called “brick wall”-type grain structure. It is suggested that this microstructure can be achieved also in different composites produced by ARB using thin layers of high purity. In addition, preliminary results of microstructural simulations for one specific case (after 4 ARB cycles and 400 °C annealing temperature) show a good qualitative agreement with the experiment despite simplified modeling assumptions.
ACKNOWLEDGMENTS
This work was supported by the European Union and the Free State of Saxony in the framework of the European Center for Emerging Materials and Processes (ECEMP), contract No. 13795/2379. The authors also gratefully acknowledge the funding of the German Research Council (DFG) which, within the framework of its “Excellence Initiative”, supports the Cluster of Excellence “Engineering of Advanced Materials” at the University of Erlangen-Nürnberg. In particular, Dana Zöllner would like to thank the Technische Universität Dresden, Germany, for awarding the Dresden Research Fellowship enabling the present work.