





1. Introduction
The way information is framed—as a gain or a loss—is well known to alter people’s preferences when making risky decisions (Kahneman and Tversky, Reference Kahneman and Tversky1984). For example, when identical outcomes are framed in terms of potential gains, people tend to be risk averse (preferring a certain but lower gain over a risky but larger gain), whereas when framed in terms of potential losses, they are more risk seeking (preferring to chance a higher loss over accepting a smaller but certain loss) (Tversky and Kahneman, Reference Tversky and Kahneman1981). Understanding how framing shapes decisions is particularly important for older adults: they exhibit larger framing effects than younger adults (Kim et al., Reference Kim, Goldstein, Hasher and Zacks2005), represent a rapidly increasing segment of the population, and hold the highest net worth of any age group in the United States. (Aladangady et al., Reference Aladangady, Bricker, Chang, Goodman, Krimmel, Moore, HenriquesVolz and Windle2023). Notably, this heightened susceptibility to framing occurs even though age-related differences largely disappear when risky decisions involve fully described odds and outcomes—suggesting that framing itself, rather than general risk processing, may be the key driver of age difference in real world decision making (Bagaïni et al., Reference Bagaïni, Liu, Bajrami, Son, Tisdall and Mata2023; Mata et al., Reference Mata, Josef, Samanez-Larkin and Hertwig2011).
Though framing clearly shapes decisions under uncertainty, less is known about whether framing also influences how probability information is understood in the first place and how aging may impact such understanding. This distinction is critical in domains like gambling, where regulatory disclosures are designed to inform consumers about the odds of winning, which, in theory, should prevent players from forming inaccurate beliefs that could lead to excessive or harmful gambling behavior (Cooper et al., Reference Cooper, Blanco and Maddox2017; Newall et al., Reference Newall, Walasek and Ludvig2022b). Several recent studies of younger and midlife adults have shown that when messages are framed in terms of what the player might lose (the ‘house-edge’ format, for example, ‘this game keeps 10% of all money bet on average’), comprehension is better and the likelihood of winning more calibrated than when messages are framed in terms of what the player might win (the ‘return-to-player’ format; for example, ‘this game has an average percentage payout of 90%’) (Beresford and Blaszczynski, Reference Beresford and Blaszczynski2020; Newall et al., Reference Newall, Walasek and Ludvig2020, Reference Newall, Walasek and Ludvig2021, Reference Newall, Walasek, Ludvig and Rockloff2022a). One recent study found that the return-to-player condition produced poorer comprehension even compared to a no-information condition, where the odds were not presented at all (Weiss-Cohen et al., Reference Weiss-Cohen, Palmer, Torrance and Newall2025). These results suggest that emphasizing potential player gains may inadvertently distort perceptions and create an inflated sense of potential rewards.
Gambling is a common leisure activity for older adults (McNeilly and Burke, Reference McNeilly and Burke2001; Pino-Gutiérrez et al., Reference Pino-Gutiérrez, Granero, Fernández-Aranda, Mena-Moreno, Mestre-Bach, Gómez-Peña and Jiménez-Murcia2022; see Fontaine et al., Reference Fontaine, Lemercier, Bonnaire, Giroux, Py, Varescon and Le Floch2023 for a review), and older age is sometimes found to be associated with risky gambling engagement due to increased social isolation, loneliness, and financial vulnerability (Clarke, Reference Clarke2008; Nower and Blaszczynski, Reference Nower and Blaszczynski2008; Parke et al., Reference Parke, Griffiths, Pattinson and Keatley2018; Pattinson and Parke, Reference Pattinson and Parke2016; Tira et al., Reference Tira, Jackson and Tomnay2014; see Ariyabuddhiphongs, Reference Ariyabuddhiphongs2012 for a review). Understanding older adults’ comprehension of these types of odds-based disclosures is thus important and may not mirror those of younger and midlife adults due to well-documented age-related shifts in cognitive and affective processes (Glisky, Reference Glisky2007; Scheibe and Carstensen, Reference Scheibe and Carstensen2010). For example, according to socioemotional selectivity theory, with age, individuals increasingly prioritize emotionally meaningful and positive information over negative or neutral information (Carstensen et al., Reference Carstensen, Isaacowitz and Charles1999). This motivational shift has been linked to the positivity effect—a relative preference for positive over negative material in attention and memory (Mather and Carstensen, Reference Mather and Carstensen2005; Reed and Carstensen, Reference Reed and Carstensen2012): Older adults have better memory and attention for positively valenced material compared with negative material, even when both are equally salient to younger adults. Based on this, older adults may pay more attention to—and thus better comprehend—gain-framed messages (e.g., return-to-player statements) relative to loss-framed ones (e.g., house-edge statements), and they also may be more optimistic about their chances of coming out ahead if they play.
However, some research indicates that the positivity effect that is commonly found based on lab-based studies has little relation with real-life consequences, such as when decisions involving risk are made in the wild. For example, Rolison (Reference Rolison2019) found, across two experiments, that older adults were more likely to attend to and retrieve negative aspects of risky activities as opposed to positive ones. Likewise, older adults, relative to the younger adults, remembered more negative information about choice options after making decisions (Depping and Freund, Reference Depping and Freund2013), learned better from negative than positive feedback about their decisions (Frank and Kong, Reference Frank and Kong2008), and showed lower levels of risk seeking to prevent potential losses (Depping et al., Reference Depping, Best and Freund2021). A meta-analysis by Best and Charness (Reference Best and Charness2015) found that in positive (gain) frames, younger adults tend to be more risk seeking than older adults, but under loss frames, no overall differences in risky decisions were found. These findings support a different framework, the selection, optimization and compensation (SOC) framework, which posits that as individuals perceive increases in limitations in their resources (e.g., functional ability, cognitive capacity) with age, they adapt by allocating their limited resources toward maintenance rather than growth (Baltes and Baltes, Reference Baltes and Baltes1990; Freund and Baltes, Reference Freund and Baltes1998). SOC therefore supports the age-related loss prevention account in decision-making, whereby older adults place greater emphasis on minimizing losses rather than maximizing gains (Ebner et al., Reference Ebner, Freund and Baltes2006; Freund, Reference Freund2006). Together, these results suggest that, in more nuanced scenarios in which choices involve risk, older adults may not display the typical positivity effect and may instead pay more attention to and better remember loss-framed messages.
How vulnerable an individual is to financial exploitation may also influence how gain-versus loss-framed messages affect both understanding and expectations of winning in a game. The relation between age and such financial vulnerability, however, is complex. Several studies suggest that within a group of older adults, the younger individuals (the ‘young-old’) may be more vulnerable to financial exploitation than their older counterparts (the ‘old-old’). For example, a large, population-based study found that participants under 70 were more likely to report experiencing financial exploitation than those over 70 (Acierno et al., Reference Acierno, Hernandez, Amstadter, Resnick, Steve, Muzzy and Kilpatrick2010). Similarly, higher scores on a shortened version of the Financial Exploitation Vulnerability Scale were associated with lower age (Lichtenberg et al., Reference Lichtenberg, Paulson and Han2020). These effects may reflect cohort differences rather than chronological age per se; for instance, changes in employment opportunities or pension policies may differentially affect financial confidence across generations. They may also reflect individual differences in psychological characteristics. Lichtenberg et al. (Reference Lichtenberg, Stickney and Paulson2013), for example, found that older adults with greater psychological vulnerability—defined by higher depression and lower fulfillment of social and psychological needs—were more likely to report fraud or scam victimization even after controlling for age.
Beyond self-reported vulnerability, neurocognitive and brain-based markers have also been linked to exploitation risk. In clinically healthy older adults, greater financial vulnerability predicts both worse cognitive performance (Axelrod et al., Reference Axelrod, Mosqueda, Weissberger, Nguyen, Boyle, Parunakian and Han2020; Lim et al., Reference Lim, Weissberger, Axelrod, Mosqueda, Nguyen, Fenton and Han2025) and reduced entorhinal cortex thickness (Fenton et al., Reference Fenton, Salminen, Lim, Weissberger, Nguyen, Axelrod, Noriega-Makarskyy, Yassine, Mosqueda and Han2024). Together, these findings indicate that vulnerability to financial exploitation may be shaped by both economic and cognitive factors and does not necessarily increase with chronological age. Accordingly, we predicted that higher perceived vulnerability—regardless of age—would amplify susceptibility to gain-framed (return-to-player) messages, leading to higher perceived chances of winning and reduced accuracy in interpreting the warning label.
The study also examined how age-related differences in risk propensity might shape younger and older adults’ comprehension of gambling warnings and their perceptions of winning chances. Older adults are generally more risk averse than younger adults (Albert and Duffy, Reference Albert and Duffy2012; Deakin et al., Reference Deakin, Aitken, Robbins and Sahakian2004). Liu et al. (Reference Liu, Bagaïni, Son, Kapoor and Mata2023) found, in an analysis of over 187,000 respondents across 26 longitudinal samples from 19 countries, a consistent negative relationship between age and self-reported risk-taking propensity across both general and domain-specific measures, with age-related declines most pronounced in recreational and occupational domains and comparatively smaller in financial and health domains. Additionally, according to the SOC theory, older adults tend to prioritize minimizing losses over maximizing gains (Freund and Baltes, Reference Freund and Baltes1998). Thus, being informed about potential losses through a loss-framed house-edge warning message, rather than a gain-framed return-to-player message, may heighten their risk aversion and consequently lower their perceived chances of coming out ahead compared with younger adults. In contrast, if older adults are indeed more sensitive to loss-framed information, this heightened attention might also improve their comprehension of the warning information.
In the current study, using a task similar to that developed by Newall et al., Reference Newall, Walasek and Ludvig2020, older and younger adults were randomly assigned to receive either a return-to-player (90% payout) or a house-edge (10% kept) framing of the odds of winning a new casino game. The information was presented in terms of percentages, which resembles real-world information on gambling odds (Newall et al., Reference Newall, Walasek, Ludvig and Rockloff2022a), and follows prior work which showed little difference between percentage formats and absolute currency formats (Newall et al., Reference Newall, Walasek and Ludvig2021). We assessed comprehension of the odds, and queried participant’s perception of their chances of coming out ahead in the game. We also measured trait-level positivity (Caprara et al., Reference Caprara, Alessandri, Eisenberg, Kupfer, Steca, Caprara and Abela2012) and risk propensity (Zhang et al., Reference Zhang, Highhouse and Nye2019) as well as participant’s perceptions of their own vulnerability to financial exploitation (Lichtenberg et al., Reference Lichtenberg, Paulson and Han2020).
2. Methods
2.1. Participants
Two hundred younger adults (between the ages of 18–25) and 200 older adults (between the ages of 65–75) were recruited through the Prolific online participant forum. Prolific screens participants for inclusion criteria, which included being within these age ranges, located in the United States, and fluent in English. In addition, participants who met these criteria but took too long to complete the study (>20 minutes) were automatically rejected by Prolific. The sample size was preregistered based upon the procedure of Newall et al. (Reference Newall, Walasek and Ludvig2020), yielding a total sample of 400. Data from 1 older adult and 13 younger adults were excluded based on preregistered exclusion criteria. The final sample consisted of 187 younger adults and 199 older adults. This sample gives 97.4% power to detect a difference of at least Cohen’s d = .4 between the groups at a significance level of .05. Participants were compensated at a rate of $10/hour.
Among older adults, 179 participants self-identified as being White, 15 Black or African American, 2 Asian, 1 Caribbean, 1 mixed White and American Indian or Alaska Native, and 1 mixed race including White, Black or African American, Asian, and American Indian or Alaska Native. Two participants identified as Hispanic, and 197 identified as non-Hispanic.
Among younger adults, 108 participants self-identified as being White, 32 Black or African American, 3 American Indian or Alaska Native, 38 Asian, 1 Pacific Islander, 4 mixed White and Black or African American, 1 mixed White and Asian, and 1 mixed Black or African American and Asian. Twenty-nine participants identified as Hispanic, and 158 identified as non-Hispanic.
2.2. Design
Participants in each age group were randomly assigned to one of two framing conditions. Half of both the younger and older participants were assigned to the return-to-player framing condition, and the remaining participants were assigned to the house-edge framing condition.
The order of the comprehension and coming out ahead questions was counterbalanced within each framing condition. Specifically, within both the return-to-player and house-edge framing groups, half of the participants completed the comprehension question first followed by the coming out ahead question, whereas the remaining participants completed the coming out ahead question first followed by the comprehension question.
2.3. Materials
Warning label information. Replicating Newall et al., Reference Newall, Walasek and Ludvig2020, participants in the return-to-player group were told that ‘this game has an average percentage payout of 90%’, while in the house-edge group, participants were told that ‘this game keeps 10% of all money bet on average’ (see Newall et al., Reference Newall, Walasek and Ludvig2021, Reference Newall, Walasek and Ludvig2022b, for additional supporting results).
Comprehension question. In both framing conditions, the comprehension question was worded as ‘Which of the following best describes what the message means?’ Participants were asked to choose the correct answer from four options, presented in a random order: (a) 90% of people who play this game will win something, (b) This game will give out a prize 9 times in 10, (c) If you bet $1 on this game, you are guaranteed to win 90¢, and (d) For every $100 bet on this game, about $90 is paid out in prizes (the correct answer).
Coming out ahead question. In both framing conditions, the coming out ahead question was worded as ‘How does the above information affect your perceived chance of winning? My chances of winning are…’. Participants responded using a 7-point Likert scale ranging from a very low chance (1), low chance (2), somewhat low chance (3), neither low or high chance (4), somewhat high chance (5), high chance (6), to a very high chance (7).
Attention check question. All participants completed an attention check in which they answered the same coming out ahead question, but where the warning label percentages corresponded to 1% in the return-to-player condition and 99% in the house-edge condition, which are implausibly unfair games. If participants rated themselves as more likely to come out ahead on this attention-check question with 1%/99% odds as opposed to the experimental (90%/10%) question, they were excluded.
Financial Exploitation Vulnerability Scale (shortened alternate version; Lichtenberg et al., Reference Lichtenberg, Paulson and Han2020). Participants completed six items assessing self-reported financial vulnerability using a 3-point Likert-type scale. Items probed different aspects of vulnerability (e.g., ‘How often has someone talked you into a decision to spend or donate money that you did not initially want to do?’; response options: never, sometimes, often; ‘How worried are you that someone will take away your financial freedom?’; response options: not at all worried, somewhat worried, very worried). Responses were summed to create a total score ranging from 6 to 18, with higher scores indicating greater perceived financial exploitation vulnerability. Internal consistency reliability in the current sample was acceptable (α = .71).
General Risk Propensity Scale (Zhang et al., Reference Zhang, Highhouse and Nye2019). This 8-item scale queries participants’ risk-seeking tendencies. Each item (e.g., ‘I am a believer of taking chances’, ‘Taking risks makes life more fun’) was rated on a scale from 1 (strongly disagree) to 5 (strongly agree). A higher summed score indicates a higher propensity to take risks. Internal consistency reliability in the current sample was high (α = .95).
Positivity Scale (Caprara et al., Reference Caprara, Alessandri, Eisenberg, Kupfer, Steca, Caprara and Abela2012). This 8-item scale measures general outlook on life, (i.e., optimism). Participants rated items (e.g., ‘I generally feel confident in myself’, ‘I have great faith in the future’) using a 5-point Likert scale ranging from 1 = strongly disagree (1) to 5 = strongly agree (5). A higher summed score indicates a more positive outlook on life. Internal consistency reliability in the current sample was high (α = .90).
2.4. Procedure
The study was hosted on Qualtrics. All participants provided informed consent approved by the USC IRB (Protocol # UP-25-00218).
Participants first completed the main study measures, including the comprehension and coming out ahead questions, followed by the attention check question. They then completed three measures in the following order: the Financial Exploitation Vulnerability Scale, the General Risk Propensity Scale, and the Positivity Scale. Finally, participants completed a demographics questionnaire in which they indicated their age; biological sex at birth (male or female); race (White, Black or African American, American Indian or Alaska Native, Asian, Native Hawaiian, Pacific Islander, and Other; prefer to self-describe); ethnicity (‘Are you Hispanic/Latino?’ with ‘yes’ or ‘no’ response options); English fluency (‘Are you Fluent in English?’ with ‘yes’ or ‘no’ response options); level of education (‘What is the highest degree or level of school you have completed?’ with response options as 8th grade, some high school, high school graduate or the equivalent (e.g., GED), some college, trade/technical/vocational training, associate degree, bachelor’s degree, master’s degree, doctorate degree, and other (please specify below), which were then converted to years of education); employment status (‘What is your current employment status?’ with response options as employed for wages, self-employed, out of work and looking for work, out of work but not currently looking for work, a homemaker, a student, military, retired, unable to work, and other (please specify below); annual household income (5 forced-choice options: (1) less than $30,000 a year, (2) $30,000–74,999, (3) $75,000–99,999, (4) $100,000–149,999, and (5) >150,000); and the number of times they had gambled in the past year. The study took approximately 5 minutes to complete.
2.5. Analysis
Data were analyzed using RStudio (version 2023.06.1+524) and JASP. Group differences in demographic variables were examined with independent-samples t-tests for continuous variables and chi-square tests for categorical variables.
To examine whether perceived chances of coming out ahead varied as a function of frame and age, a 2 (frame: return-to-player versus house-edge) × 2 (age: younger versus older) analysis of variance (ANOVA) was conducted. This analysis was preregistered (see footnote 1).
To examine whether warning label comprehension (correct versus incorrect) varied as a function of frame and age, a logistic regression was performed with frame, age, and their interaction as predictors. This analysis was preregistered.
To explore whether warning label comprehension influenced perceived chances of coming out ahead, we conducted a 2 (comprehension accuracy: correct versus incorrect) × 2 (frame) × 2 (age) ANOVA. Significant interactions were followed up with simple-effects analyses. This analysis was not preregistered and is therefore exploratory.
To examine whether positivity, financial exploitation vulnerability, and risk propensity mediated the association between age (as the predictor), frame (as the moderator), and warning label comprehension, and perceived chances of coming out ahead (as the outcome variable), respectively, preregistered moderated mediation analyses were conducted.
3. Results
3.1. Participants
Years of education did not differ between younger (M = 15.03, SD = 1.91) and older adults (M = 15.20, SD = 2.27), t(379.1) = .98, p = .43, Cohen’s d = .08, nor did biological sex distribution, χ 2(1, N = 386) = 2.42, p = .12, nor the number of days in the past year spent gambling, t(383.8) = −.041, p = .97. Older adults reported significantly lower household income than did younger adults, b = −.49, SE = .19, z = −2.59, p = .010. The odds ratio was .61, 95% CI [.42, .89], meaning that older adults had 39% lower odds of reporting a higher income category compared to younger adults.
3.2. Perceived chances of coming out ahead
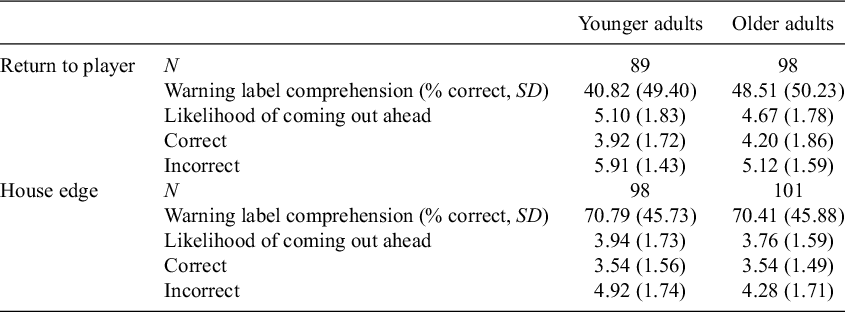
As shown in Table 1, both younger and older participants rated their chance of coming out ahead as being higher in the return-to-player as compared to the house-edge frame. A 2 (frame) × 2 (age) ANOVA on coming out AheadFootnote 1 confirmed a significant main effect of frame, F(1,382) = 34.7, p < .001, ηp 2 = .08, such that participants in the return-to-player condition (M = 4.89, SE = .12) perceived their chances of coming out ahead as being higher than did those in the house-edge condition (M = 3.85, SE = .13). There was also a marginally nonsignificant effect of age, F(1,382) = 3.13, p = .078, ηp 2 = .008, such that younger participants reported moderately higher ratings (M = 4.52, SE = .13) than did older participants (M = 4.21, SE = .12). The frame × age interaction was not significant, F(1,382) = .46, p = .50, ηp 2 = .001.
Descriptive statistics for comprehension accuracy and perceived chances of coming out ahead by frame (return-to-player versus house-edge) and age group

Table 1. Long description
The table is divided into two main sections based on framing: Return to player and House edge. Each section provides data for Younger adults and Older adults.
Return to player section:
* N: 89 for Younger adults, 98 for Older adults.
* Warning label comprehension percent correct and S D: 40.82 49.40 for Younger adults, 48.51 50.23 for Older adults.
* Likelihood of coming out ahead: 5.10 1.83 for Younger adults, 4.67 1.78 for Older adults.
* Likelihood if Correct: 3.92 1.72 for Younger adults, 4.20 1.86 for Older adults.
* Likelihood if Incorrect: 5.91 1.43 for Younger adults, 5.12 1.59 for Older adults.
House edge section:
* N: 98 for Younger adults, 101 for Older adults.
* Warning label comprehension percent correct and S D: 70.79 45.73 for Younger adults, 70.41 45.88 for Older adults.
* Likelihood of coming out ahead: 3.94 1.73 for Younger adults, 3.76 1.59 for Older adults.
* Likelihood if Correct: 3.54 1.56 for Younger adults, 3.54 1.49 for Older adults.
* Likelihood if Incorrect: 4.92 1.74 for Younger adults, 4.28 1.71 for Older adults.
3.3. Warning label comprehension
A logistic regression was used to assess whether warning label comprehension varied as a function of frame (house edge versus return to player (reference)), age (younger versus older, where younger was coded as 0 and older was coded as 1), and their interaction. This analysis confirmed a significant main effect of frame, b = −1.26, SE = .30, z = .31, p < .001, such that participants in the return-to-player condition had worse comprehension compared to those in the house edge condition. Both the main effect of age (b = −.02, SE = .32, z = −.06, p = .96) and the interaction between age and frame (b = .33, SE = .43, z = .77, p = .44) were not significant.
3.4. Chances of coming out ahead as a function of comprehension
To understand whether comprehension affected participants’ perceived chances of coming out ahead, we conducted an exploratory 2 (accuracy: correct versus incorrect) × 2 (frame) × 2 (age) 3-way ANOVA on the perceived chance of coming out ahead.Footnote 2 Figure 1 shows how participants who got the comprehension question wrong reported higher perceived chances of coming out ahead in the game relative to those participants who got the question right (F(1,378) = 77.38, p < .001, ηp 2 = .17). As was the case in the analysis without accuracy, there was also a main effect of frame, F(1,378) = 17.33, p < .001, ηp 2 = .04, such that participants in the return-to-player condition reported higher chances of coming out ahead than did those in house-edge condition. The main effect of age was not significant, F(1,378) = 2.58, p = .109, ηp 2 = .007.
Perceived chance of coming out ahead (higher scores indicate higher chances of coming out ahead) as a function of warning label comprehension (correct or incorrect) in each frame (HE, house edge; RTP, return to player) for both younger and older adults. Error bars are standard error of the mean.

Figure 1. Long description
The y-axis is labeled Chances of Coming Out Ahead with a scale from 0 to 6. The x-axis is labeled Framing and is divided into two main sections based on warning label comprehension: Incorrect on the left and Correct on the right. Within each section, there are two framing conditions: H E and R T P. A legend to the right indicates that blue bars represent Older Adults and light gray bars represent Younger Adults.
* In the Incorrect comprehension section:
- H E framing: Older Adults score approximately 4.2 and Younger Adults score approximately 4.8.
- R T P framing: Older Adults score approximately 5.0 and Younger Adults score approximately 5.9.
- Statistical significance brackets with double asterisks are shown above these four bars, indicating higher perceived chances in the R T P framing compared to H E.
* In the Correct comprehension section:
- H E framing: Both Older and Younger Adults score approximately 3.5.
- R T P framing: Older Adults score approximately 4.2 and Younger Adults score approximately 3.9.
All bars include vertical error bars representing the standard error of the mean. Perceived chances are generally lower and more similar between age groups when comprehension is correct.
These main effects were qualified by a significant interaction between accuracy and age, F(1,378) = 6.63, p = .010, ηp 2 = .02, such that the difference in coming out ahead between people who understood the odds and those who did not was larger among younger participants (mean difference = 1.69, SE = .25, p < .001) than older participants (mean difference = .83, SE = .24, p = .001). Simple-effects analyses revealed that, among people who did not understand what the odds meant, those who were younger thought that they had a greater chance of coming out ahead than did those who were older (mean difference = .72, SE = .27, p = .007). On the other hand, younger and older adults who understood the odds did not differ in their perceptions of coming out ahead (mean difference = .14, SE = .22, p = .54). No other interactions were significant, all ps > .26.
3.5. Perceived financial exploitation vulnerability, risk propensity and positivity
Older adults (M = 9.4, SD = 2.3) had lower financial exploitation vulnerability scores than did younger adults (M = 10.7, SD = 2.5); t(377.8) = −5.43, p < .001, Cohen’s d = −.55), indicating that they perceived themselves as being less vulnerable to financial exploitation than did their younger counterparts. Older adults (M = 15.5, SD = 6.7) also scored significantly lower than younger adults (M = 20.7, SD = 7.8); t(368.0) = −6.96, p < .001, Cohen’s d = −.71) on the General Risk Propensity Scale, suggesting that the older adults were less risk seeking than younger adults. Finally, older adults (M = 29.0, SD = 6.0) scored higher than younger adults (M = 26.9, SD = 7.3); t(362.3) = 2.97, p = .003, Cohen’s d = .30) on the Positivity Scale, suggesting that older adults showed a more positive outlook on positivity (i.e., optimism) compared to younger adults.Footnote 3
3.6. Moderated mediation analyses
Finally, we conducted two exploratoryFootnote 4 moderated mediation analyses to examine whether the effects of age (binary) on perceived chances of coming out ahead (Model 1) and comprehension (Model 2) were influenced by frame and potentially explained by trait-level characteristics. In both models, frame was the moderator, and three parallel mediators were included to capture potential indirect pathways of influence of traits: positivity, financial exploitation vulnerability, and risk propensity. All confidence intervals are bias-corrected and accelerated (BCa) bootstrap confidence intervals (CIs) based on 5,000 resamples. The BCa method adjusts for both bias and skew in the bootstrap sampling distribution, improving the accuracy of confidence interval coverage relative to percentile or normal approximation methods. This approach is widely used in moderated mediation analysis in judgment and decision research (e.g., Schultze et al., Reference Schultze, Mojzisch and Schulz-Hardt2019; Sun et al., Reference Sun, Ma, Zhou, Jiang and Li2022; Zonca et al., Reference Zonca, Coricelli and Polonio2020).
3.6.1. Perceived chances of coming out ahead
Figure 2 shows the results of the moderated mediation analysis where the outcome was perceived chances of coming out ahead.Footnote 5 In the house-edge frame, positivity (b = .08, 95% CI [.0004, .210]) showed a trend-level association with perceived chances of coming out ahead, such that individuals higher in positivity (i.e., optimism) tended to believe they were more likely to come out ahead. Neither the indirect effects through financial exploitation vulnerability (b = −.13, 95% CI [−.29, .013]) nor risk propensity (b = −.05, 95% CI [−.26, .14]) were significant.
Moderated mediation model of the association between age and perceived chances of coming out ahead via financial exploitation vulnerability (blue), risk propensity (green), and positivity (orange), and moderated by framing (house edge vs return to player). The a paths represent the effect of age on each mediator, b paths represent the effect of each mediator on the DV, c is the total effect of age on DV, and c is the direct effect controlling for mediators. The numbers (labeled ‘Int’) on the arrows from framing to b paths indicate the interaction coefficients (mediator × framing condition), showing how much the mediator → DV slope differs in RTP compared with HE. The figure displays z-score standardized regression coefficients for individual paths (a, b, and c′). Significant indirect effects reported in the text are based on bias-corrected bootstrap estimates of the product terms (a × b) and are not shown directly in the diagram.
Note: Statistical significance of the regression coefficients for a path is indicated as *p < .05, **p < .01, ***p < .001. DV, direct variable; HE, house edge; RTP, return to player.

Figure 2. Long description
The flowchart maps statistical paths between variables.
* On the far left is the independent variable box labeled Age.
* On the far right is the dependent variable box labeled Perceived Chances of Coming Out Ahead.
* A direct horizontal arrow from Age to the dependent variable shows path c: -0.33 and path c prime: -0.28.
Three central mediator boxes are stacked vertically between the main variables:
1. Top (Blue): Financial Exploitation Vulnerability. Path a 1 from Age is -0.53***. Path b 1 to the dependent variable is 0.24 (H E), 0.30 (R T P). Indirect effect a times b is R T P: -0.16*, H E: -0.13, Moderated mediation: -0.03.
2. Middle (Green): Risk Propensity. Path a 2 from Age is -0.67***. Path b 2 to the dependent variable is 0.07 (H E), -0.14 (R T P). Indirect effect a times b is R T P: 0.09, H E: -0.05, Moderated mediation: 0.14.
3. Bottom (Orange): Positivity. Path a 3 from Age is 0.30**. Path b 3 to the dependent variable is 0.25 (H E), 0.23 (R T P). Indirect effect a times b is R T P: 0.07, H E: 0.08*, Moderated mediation: -0.01.
In the top right, a box labeled Framing has arrows pointing to each b path with interaction coefficients:
* Int 1: 0.06 pointing to the blue b 1 path.
* Int 2: -0.21 pointing to the green b 2 path.
* Int 3: -0.02 pointing to the orange b 3 path.
Asterisks indicate statistical significance: * p < .05, ** p < .01, *** p < .001.
In the return-to-player frame, the indirect effect through financial exploitation vulnerability (b = −.16, 95% CI [−.36, −.01]) was significant, indicating that older adults’ lower perceived chances of coming out ahead in this group were partially accounted for by their lower perceived financial vulnerability. In contrast, the indirect effects through positivity (b = .07, 95% CI [−.01, .20]) and risk propensity were not significant (b = .09, 95% CI [−.08, .30]). Critically, none of the cross-frame (return-to-player versus house-edge) differences in indirect effects—which are indices of moderated mediation—were significant. This includes risk propensity: b = .14, 95% CI [−.10, .44]; Positivity: b = −.01, 95% CI [−.14, .12]; and financial exploitation vulnerability: b = −.03, 95% CI [−.27, .17]. The total moderated-mediation effect was also not significant (b = .10, 95% CI [−.20, .43]). Thus, the overall model shows mediation of the effect of age on the perceived chance of coming out ahead, but no moderation of this mediation by the frame.
3.6.2. Warning label comprehension
Figure 3 shows the results of the moderated mediation analysis with warning label comprehension as the outcome.Footnote 6 In the house-edge frame, none of the indirect effects were significant. The indirect effects through financial exploitation vulnerability, b = .11, 95% BCa CI [−.10, .34], risk propensity, b = .10, 95% BCa CI [−.14, .34], and positivity, b = −.03, 95% BCa CI [−.17, .09] were not significant. The total indirect effect in the house-edge condition was also nonsignificant, b = .18, 95% BCa CI [−.10, .51].
Moderated mediation model of the association between age and warning label comprehension via financial exploitation vulnerability (blue), risk propensity (green), and positivity (orange), and moderated by framing (house edge vs return to player). The a paths represent the effect of age on each mediator, b paths represent the effect of each mediator on the DV, c is the total effect of age on DV, and c′ is the direct effect controlling for mediators. The numbers (labeled ‘Int’) on the arrows from framing to b paths indicate the interaction coefficients (mediator × framing condition), showing how much the mediator → DV slope differs in RTP compared with HE. The figure displays z-score standardized regression coefficients for individual paths (a, b, and c′). Significant indirect effects reported in the text are based on bias-corrected bootstrap estimates of the product terms (a × b) and are not shown directly in the diagram.
Note: Statistical significance of the regression coefficients for a path is indicated as *p < .05, **p < .01, ***p < .001. DV, direct variable; HE, house edge; RTP, return to player.

Figure 3. Long description
A statistical flowchart with Age on the far left and Comprehension on the far right. A direct horizontal arrow connects them with values c = 0.17 and c prime = 0.11.
Three parallel mediation paths are stacked vertically between the variables:
1. Top path (blue): Age to Financial Exploitation Vulnerability (a1 = -0.53***). The mediator box lists indirect effects for R T P (0.21*) and H E (0.11), with moderated mediation at 0.10. An arrow leads to Comprehension (b1 = -0.21 for H E, -0.40 for R T P).
2. Middle path (green): Age to Risk Propensity (a2 = -0.67***). The mediator box lists indirect effects for R T P (-0.20) and H E (0.10), with moderated mediation at -0.30. An arrow leads to Comprehension (b2 = -0.14 for H E, 0.30 for R T P).
3. Bottom path (orange): Age to Positivity (a3 = 0.30**). The mediator box lists indirect effects for R T P (-0.00) and H E (-0.03), with moderated mediation at 0.03. An arrow leads to Comprehension (b3 = -0.10 for H E, -0.00 for R T P).
A Framing box in the top right has arrows pointing to each ‘b’ path arrow, labeled with interaction coefficients:
* Int1: -0.19 (blue)
* Int2: 0.44 (green)
* Int3: 0.10 (orange)
Asterisks indicate statistical significance: *p < .05, **p < .01, ***p < .001.
In the return-to-player frame, the indirect effect via financial exploitation vulnerability, b = .21, 95% BCa CI [.03, .47] was significant, suggesting that greater perceived financial vulnerability predicted better comprehension of the warning label when the odds were framed in terms of potential gains. However, the indirect effects through risk propensity, b = −.20, 95% BCa CI [−.45, .01], and positivity, b = −.00, 95% BCa CI [−.10, .11], were not significant. The total indirect effect in the return-to-player condition was likewise nonsignificant, b = .01, 95% BCa CI [−.29, .30].
Comparisons of indirect effects between conditions (return to player–house edge) revealed no significant differences for financial exploitation vulnerability, b = .10, 95% BCa CI [−.016, .42], risk propensity, b = −.29, 95% BCa CI [−.65, .01, or Positivity, b = .03, 95% BCa CI [−.13, .22]. The difference in total indirect effects across conditions was also nonsignificant, b = −.17, 95% BCa CI [−.58, .23].
4. Discussion
Both younger and older adults exhibited robust framing effects in this study: the return-to-player framing, which emphasized how much the player might win if they played an online casino game, resulted in worse comprehension of the warning label and increased perceived chances of coming out ahead in the game. These results replicate previous studies in younger and midlife adults (Newall et al., Reference Newall, Walasek and Ludvig2020, Reference Newall, Walasek and Ludvig2021, Reference Newall, Walasek and Ludvig2022b) and extend them to an older cohort. In addition, when participants misunderstood the warning label, they had inflated perceptions of coming out ahead in the game. This effect was especially pronounced amongst the younger adults. The reduced understanding with the return-to-player frame across all age groups is important, in that regulations limiting this method of disclosing the odds of winning may lead people of all ages to make different choices about whether and how much to play a casino game.
These differences in comprehension of the odds of winning were driven almost entirely by the framing manipulation, rather than by age or individual differences in measured trait mediators. We found age invariance of comprehension across both frames, and none of the mediators significantly explained comprehension in the house-edge condition. The only significant mediation effect emerged in the return-to-player frame, where individuals who perceived themselves as being vulnerable to financial exploitation demonstrated better comprehension of the warning label (see Figure 3). Importantly, this result suggests that when odds are presented in a more positively framed, gain-oriented format, individuals who are more attuned to the possibility of financial harm may process the warning more carefully. This pattern also highlights that comprehension failures under gain-framed messaging may be especially pronounced among those who do not perceive themselves as being vulnerable to financially exploitation, potentially because the positively framed message attenuates caution or critical evaluation.
As predicted, older adults in our study had higher positivity. They also reported lower risk propensity. Although positivity (i.e., optimism), as measured via the Positivity Scale, did not significantly mediate their perceived chances of coming out ahead in either frame, its positive association with winning expectations in the house-edge condition suggests that when the warning message emphasizes potential losses, more optimistic individuals may perceive their chances of winning more favorably. This pattern is broadly consistent with previous work showing that older adults tend to downregulate attention to negative information (Carstensen & DeLiema, Reference Carstensen and DeLiema2018), in line with the socioemotional selectivity theory (Carstensen et al., Reference Carstensen, Isaacowitz and Charles1999; Mather and Carstensen, Reference Mather and Carstensen2005). In contrast, under the gain-framed return-to-player condition, positivity (i.e., optimism) did not mediate the relationship between age and perceived chances of coming out ahead—perhaps because the frame already presents a positive context, leaving little additional room for trait positivity to influence perceptions.
Older adults also reported lower perceptions of financial exploitation vulnerability compared to younger adults. Although older adults are more commonly targeted in financial scams than younger adults and therefore might be expected to score higher on this scale, previous results have shown that perceptions of vulnerability do not always correlate with actual vulnerability to exploitation (Lichtenberg et al., Reference Lichtenberg, Paulson and Han2020). In the current study, older adults’ reduced belief that they would come out ahead was partially explained by their lower perceived financial exploitation vulnerability score in the return-to-player condition. This result may reflect a self-protective stance: lower perceptions of potential vulnerability may capture older adults’ greater confidence and lived experience in avoiding exploitation (potentially because they are more frequently targeted), which in turn aligns with a more skeptical view of gambling outcomes. In contrast, younger adults’ higher perceived financial exploitation vulnerability scores may reflect financial insecurity or inexperience, fostering more optimistic beliefs that gambling might provide financial gains despite accurate comprehension of the odds. This interpretation is consistent with older adults’ lower risk propensity and reduced positivity (i.e., optimism) about winning, suggesting that financial exploitation vulnerability may function less as a proxy for absolute resources (or financial vulnerability) and more as a subjective index of perceived control and susceptibility that shapes how individuals interpret gambling warnings.
This pattern was evident in the return-to-player condition, where financial exploitation vulnerability served as a partial inverse mediator for the association between age and winning expectations. In other words, higher perceptions of financial exploitation vulnerability were associated with lower perceived chances of coming out ahead when the warning information was framed positively and emphasized potential gains. The same trait was also associated with comprehension under this frame, indicating that individuals who are more attuned to financial risk may scrutinize gain-framed messages more carefully, counteracting the misleading nature of return-to-player information. For comprehension accuracy of the warning labels, higher perceptions of financial exploitation vulnerability were also associated with better comprehension in the return-to-player condition, but not in the house-edge condition. Taken together, these findings suggest that greater perceived financial vulnerability may contribute to a protective role—both by reducing inflated expectations of coming out ahead and by enhancing comprehension of the warning information. The differences in indirect effects across the two framing conditions were not statistically significant, however, indicating that while these pathways operate within each frame, framing did not significantly alter the strength of these mediating relationships.
The nuances in age differences between self-reported risk-seeking tendencies and risk-seeking behaviors observed in behavioral tasks suggest that older adults’ risk-averse or risk-seeking behavior may be influenced by contextual factors such as task demands and affective state (see Nolte and Hanoch, Reference Nolte and Hanoch2024 for a review). Several limitations of the current study, which sheds light on how risk-related information is understood and perceived by younger and older adults, point to productive future directions.
First, it remains unclear whether the differences between the house-edge and return-to-player conditions in perceived chances of coming out ahead that we observed translate to actual gambling behavior. Future work should examine how risk-framed messaging affect real gambling decisions—such as whether to play and how—rather than intentions alone.
Second, in the current study, gambling warning information was presented to the participant in percentages, as is often the case in real-world settings (Newall et al., Reference Newall, Walasek, Ludvig and Rockloff2022a). With gambling odds information, other formats have produced similar results to percentages, including with absolute currency framing (Newall et al., Reference Newall, Walasek and Ludvig2021) and the addition of explicit volatility statements (Newall et al., Reference Newall, Walasek and Ludvig2022b). More broadly, however, the presentation format of risk information influences comprehension accuracy, with frequency formats promoting better understanding of risk information and leading to improved decision making compared to percentages (Fagerlin et al., Reference Fagerlin, Zikmund-Fisher and Ubel2011; Hoffrage and Gigerenzer, Reference Hoffrage and Gigerenzer1998; Schapira et al., Reference Schapira, Nattinger and McHorney2001). In particular, Peters et al. (Reference Peters, Hart and Fraenkel2011) found that among individuals with lower numeracy, risks are perceived as lower when presented in percentages than when presented in frequencies. Freeman et al. (Reference Freeman, Kerr, Recchia, Schneider, Lawrence, Finikarides and Spiegelhalter2021) also corroborated that frequency formats increase the perceived credibility of risk information. Thus, future studies testing the impact of frequency or other alternative formats on older and younger adults comprehension are needed.
Third, our positivity measure captured general positivity (i.e., optimism) toward life rather than the affective processing differences typically indexed by the age-related positivity effect. Future studies should include direct ratings of emotional stimuli (e.g., words, pictures, faces) to better characterize age differences in affective processing. In addition, positivity could also be assessed as a momentary affective state to explore how transient mood interacts with stable emotional outlook. Examining participants’ immediate mood before gambling could reveal how short-term affect influences responses to gain- or loss-framed warnings and, ultimately, gambling behavior.
Finally, future studies should also include middle-aged populations (approximately ages 40–60), a group underrepresented in this literature despite facing major life transitions (Lachman, Reference Lachman2004; Lachman et al., Reference Lachman, Teshale and Agrigoroaei2015; Levinson, Reference Levinson1977) which may place individuals’ mental wellbeing at risk (Brim et al., Reference Brim, Ryff and Kessler2004; Grundström et al., Reference Grundström, Konttinen, Berg and Kiviruusu2021; Infurna et al., Reference Infurna, Gerstorf and Lachman2020; Lachman, Reference Lachman2015) and promote unhealthy coping behaviors such as gambling (Nower and Blaszczynski, Reference Nower and Blaszczynski2008; Petry, Reference Petry2002). Thus, understanding framing effects in middle-aged adults would be crucial for determining how the presentation of warning information might reduce or increase unsafe gambling decisions depending on how gain or loss frames influence perceived chances of coming out ahead.
In conclusion, both age groups showed the expected framing effect: return-to-player messages produced poorer comprehension and higher perceived chances of coming out ahead than did house-edge messages. Older and younger adults also showed equivalent levels of comprehension of the odds across both message frames. Older adults reported lower risk taking and lower perceived financial exploitation vulnerability, but greater positivity, compared with younger adults. They were also less optimistic about coming out ahead. Mediation analyses revealed that lower financial exploitation vulnerability among older adults partially explained their reduced belief that they would come out ahead within the return-to-player condition, although the between-frame difference was not significant. Likewise, financial exploitation vulnerability also uniquely predicted better comprehension in the return-to-player frame, suggesting that individuals who recognize their susceptibility to financial harm may be more vigilant when interpreting gain-framed warning information. Overall, these findings indicate that while framing strongly shapes gambling perceptions across ages, differences in financial vigilance and affective outlook—rather than age itself—may account for variability in how individuals interpret and respond to gambling warning messages.
Data availability statement
This study was preregistered (AsPredicted 243311). Preregistration, data, and materials can be found here: https://researchbox.org/5289&PEER_REVIEW_passcode=DETZKQ
Funding statement
This research received no specific grant from any funding agency in the public, commercial, or not-for-profit sectors.
Competing interest
The authors declare no competing interests.
Ethical standards
All study procedures were reviewed and approved by the Institutional Review Board at the University of Southern California under protocol UPC 20-01051. Informed consent was obtained from all participants prior to participation in the study. All procedures were conducted in accordance with the ethical standards of the institutional research committee and with the Declaration of Helsinki. This study is not a clinical trial and therefore was not registered in a clinical trials registry.


 Open access

