I. INTRODUCTION
The SiGe/Si heterojunction phototransistors (HPTs) were initially developed in 2003 by two teams simultaneously: ESYCOM, France [Reference Polleux1] and ERSO, Taiwan [Reference Pei2]. These microwave SiGe phototransistors provide an innovative solution for the integration of opto-electronic functions in commercial SiGe bipolar or BiCMOS process technologies, as opposed to SiGe multi-quantum-wells structures. These devices have since been fabricated using several industrial process technologies: Atmel [Reference Polleux1], [Reference Polleux3], TSMC [Reference Pei2], IBM [Reference Yin4], and AMS [Reference Egels5].
Two key aspects for the optimization of this component are: identification of fast and slow areas within the structure [Reference Moutier6, Reference Moutier, Polleux, Rumelhard and Schumacher7], investigation on their impact through more efficient opto-electrical compact circuit models [Reference Moutier6, Reference Helme and Houston8, Reference Yuan10]. It has been shown theoretically that the proximity of the base contact to the optical window promotes rapid degradation in the gain of the phototransistor. The proximity of the collector contact in turn degrades the cutoff frequency of the phototransistor with any significant impact on the gain [Reference Moutier6]. It is essential to verify these simulated results experimentally in order to provide information on the proper device sizing.
II. THE SiGe/Si PHOTOTRANSISTOR
A) Device under test
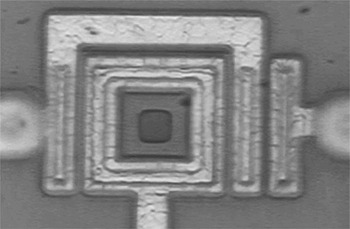
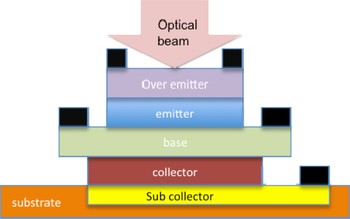
The SiGe/Si phototransistor was fabricated using the available SiGe1 ATMEL Bipolar Process. The structure is a heterojunction bipolar transistor in which a 10 × 10 µm2 optical window is designed at the center of the emitter. The base is highly doped to reach base sheet resistance below 1 kΩ/□, with an abrupt strained-SiGe profile. A top view of the phototransistor highlighting the emitter window is shown in Fig. 1. A cross-section representation of the phototransistor is given in Fig. 2. The HPT structure is discussed in [Reference Polleux1], and its physical modeling is developed in [Reference Polleux3, Reference Polleux and Rumelhard11].
Top view of the phototransistor: collector contact is taken on the right side, emitter contact is the center square, and the base contact is taken on the left side. The 10 µm × 10 µm optical window is visible in the device center.

Cross section of the phototransistor.

B) Measurement setup
A test bench was setup in order to perform opto-microwave measurements in which the optical probe is scanned all over the HPT surface. A vector network analyzer directly modulates an 850 nm multimode VCSEL laser via Port 1.
The laser diode output is injected into the phototransistor through a focusing lensed fiber vertically placed above the HPT optical window. The optical power is 1.14 mW at the end of the fiber. Such a probe is mounted on a nanopositioner. This allows the fiber extremity to have precise movements in the three axes. The nanopositioner is used to achieve a very close fiber-to-chip distance, with the goal of minimizing the spot size on the component. The control of the optical probe height above the HPT surface is made by its observation through a 45° angled mirror as shown in Fig. 3. The spot size is however expected to be greater than the optical window of the HPT, inducing optical coupling losses.
Edge view of the fiber probe illuminating the phototransistor, with base and collector terminals connected with GSG probes.

The HPT is a grounded emitter topology, its base and collector are connected to separate Ground-Signal-Ground (GSG) pads in order to perform on-wafer microwaves measurements. Device bias voltages are added through high-frequency bias tees. The collector is connected to Port 2 of the VNA, whereas the base is connected to a 50 Ω load through the bias tee.
For each position of the optical fiber, the opto-microwave gain of the optical link is measured with the use of the VNA over a [50 MHz–10 GHz] frequency range. The dynamic laser diode response is removed through a calibration technique. Finally, a 1 µm step is used for the movement of the optical probe to map a complete 50 µm × 60 µm surface, above the HPT. A diagram of the measurement setup is given in Fig. 4.
Schematic view of the measurement setup.

III. EXPERIMENTAL RESULTS
The S-parameters measurement allowed us to extract the opto-microwave properties of the phototransistor. The S 21 parameter provides the opto-microwave power gain of the phototransistor, known to be the responsivity of the HPT as both base and collector terminals are connected to a 50 Ω load [Reference Pei2, Reference Polleux9].
The bias collector–emitter voltage is set to 1.5 V and the base–emitter junction is biased at a constant voltage of 0.81 V. Induced base current is 74 µA in dark condition. At the peak illumination, accumulation of holes into the base reduces the current value down to 61.3 µA.
From these measurements, a topographical map of the 50 MHz opto-microwave gain of the phototransistor, versus the position of the optical beam, is determined in Fig. 5.
Topographical map of opto-microwave gain at 50 MHz with the estimated position of electrodes.

To isolate the phototransistor effect from the illumination conditions, we evaluated the shape of the optical beam by a mathematical model with a Gaussian profile. As the base and emitter metalized contacts of the device reflect the injected light, the detection region is limited to the inner part of the phototransistor optical window.
Therefore, the mapping of the opto-microwave response of the phototransistor is the correlation between the square opening window and the Gaussian profile of the optical beam. Thus, the Erf function is used to model such a correlation and to fit to the measurements. We then estimated the full-width at half-maximum (FWHM) power of the incident optical beam according to the axes to be 23.5 µm × 28.3 µm, which is higher than the HPT window.
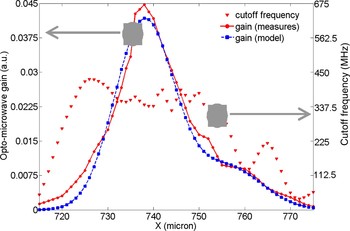
The mapping of the gain is not symmetrical along the X axis as shown on the cross-section of the mapping given in Fig. 7. An unexpected secondary peak (centered at X = 760 µm) arises to the right side of the maximum gain. However, this region has a very low cutoff frequency as can be seen in Figs 6 and 7, which is the map of the HPT cutoff frequency in phototransistor mode (−3 dB).
Topographical map of the cutoff frequency in phototransistor mode with the estimated position of electrodes.

Slice of the phototransistor topographical map at Y = 8317 µm.

This is probably caused by the illumination of the gap area, located between collector and base contacts, which stimulates the collector–substrate junction. The electrical output signal, at the collector, can then be considered as a correlation function of the central optical square window with the sum of two Gaussians, one related to the optical beam injected into the HPT, and the other related to the decentralized detection of the substrate. The second Gaussian has enabled us to significantly reduce the error between simulations and measurements. We then obtain very good fit between model and measurement as shown in Fig. 7.
The total error on the integrated energy is less than 20% (less than 1 dB) throughout the measurement area, which allows us to validate our approach. Thus, the real FWHM of the central beam profile is estimated to be 22.0 µm × 27.8 µm.
An optical coupling rate of 77% between the lensed fiber and the HPT window is then deduced.
IV. DISCUSSION
The proposed correlation model between a Gaussian beam and a square optical window fits to the low-frequency mapping of the HPT response. This indicates that there is no spatial dependence on the HPT responsivity, i.e. opto-microwave gain, when moving the fiber across the optical window. Only the optical coupling ratio is affected and the effective responsivity of the phototransistor keeps then flat whatever is the position of the optical probe along X and Y axes.
On a design concern, this means that the position and distance of electrodes with respect to the optical window seems not to affect significantly the low-frequency responsivity of the HPT. It has to be noticed that modeling results from [Reference Moutier6] may indicate that in case of a very thin and collimated 1 µm optical beam some changes may nevertheless infer.
Dynamic behavior however is modified by the position of the fiber, as shown in Figs 6 and 7. The analysis is conducted through the measurement of the 3 dB cutoff frequency of the HPT. The opto-microwave response at the peak detection is plotted in Fig. 8. The cutoff frequency is usually small in the phototransistor mode as the HPT has a −20 dB/dec slope response. This value, while not fully representing the HPT's ability to handle high-frequency signals, is representative of the optical transition frequency mapping as well.
Opto-microwave power gain in relative dB versus frequency at the peak detection point (X = 738 µm and Y = 8317 µm).

In this case, when the optical beam fully illuminates the optical window, a 340 MHz value is obtained. An increase is then obtained when the fiber moves toward the border of the optical window. The increase is exacerbated when the fiber is illuminating the left side of the HPT. A maximum cutoff frequency of 430 MHz at Y = 8317 µm (Fig. 7) and a global maximum of 590 MHz across the whole area (Fig. 6) is obtained.
The main explanation considers that the distance with respect to the collector contact helps to create a lateral gradient for the potential into the structure, as shown in [Reference Polleux3], that benefits to the acceleration of holes generated in the base–collector region.
Therefore, it is worth to design an HPT with either interdigitated base and emitter electrodes to minimize the gap between each electrode across the optical window, at the expense of lower optical coupling ratio, or asymmetric collector to exacerbate lateral field within the collector region.
V. CONCLUSION
A topographical map of a SiGe/Si HPT was presented for the first time. It has been experimentally identified that the removal of contacts to maximize the gain is not crucial, as long as the injected optical beam into the phototransistor is comparable to the size of the optical window. However, the effect of the proximity of base, emitter, and collector contacts to the optical window provides influence on the dynamic characteristics. Design rules may be deduced from such experiments. The effect of lateral electric field due to asymmetry of the structure has been proposed. This information will also possibly help in defining the topology of compact-circuit models to be used for opto-electrical modeling of HPTs.
ACKNOWLEDGEMENT
This work was funded by Region Ile-de-France.
 Marc Rosales was born in Metro Manila, Philippines in 1977. He received his bachelor of science in electronics and communications engineering degree in 1994 and his masters degree in electrical engineering in 2003 from the University of the Philippines (UP), Diliman. In 2004, he joined the Electrical and Electronics Engineering (EEE) Department of UP, Diliman. He is part of the Intel Microprocessors Lab and Microelectronics and Microprocessors Lab of UP EEE and researched on planar spiral inductors implemented on CMOS technology and radio frequency integrated circuit on CMOS. He is a recipient of the Faculty Development Grant of the Engineering Research and Development for Technology – Department of Science and Technology (ERDT-DOST). He is currently on study leave from the University of the Philippines at Diliman and pursuing a doctoral degree at the ESYCOM laboratory, ESIEE University Paris-Est. His current research is on design and modeling of phototransistors and its use in radio-over-fiber systems.
 François Duport was born in Grenoble, France, in 1979. He received his engineering degree and DEA in optical networks and telecommunications form ENST de Bretagne, Brest, France, in 2002. During his DEA's internship and following 6 months, he worked at the IMT of Neuchâtel in the design of wavelength's tuneable optical filters made with SOI MOEMS technology. He received a Ph.D. degree in physics field in November 2008 from the ENS de Cachan, France. His dissertation dealt with the optic to microwave frequency conversion in a traveling-wave device by the mean of three waves mixing in electro-optic polymers. From 2007 to 2009, his research at the ESYCOM laboratory were focused on phototransistor and microwave photonic structures by the coupling of MOEMS technology and MSM photodiodes.
 Julien Schiellein was born in Paris, France, in 1982. He received a engineering degree in microelectronic from ENSERG, Grenoble, France, and a masters degree in optic and radiofrequencies from the Institut Polytechnique de Grenoble, France, both in 2008. He is currently a Ph.D. student at ESYCOM Laboratory. His dissertation topic is contributing to the theoretical and experimental studies of InP/InGaAs HPTs.
 Jean-Luc Polleux was born in Gouvieux, France, in 1973. He received a engineering degree in microelectronic from ENSERB, Bordeaux, and a DEA degree in electronic and telecommunications from the University of Bordeaux 1, France, both in 1997. He received a Ph.D. degree in the opto-microwave field in October 2001 from CNAM, Paris, France. His dissertation topic was contributing to the theoretical studies of SiGe strained layers and to the development of SiGe HPTs. He was also working on InP/InGaAs HPTs opto-microwave circuits. He is now associate professor at Université Paris-Est – ESIEE Paris and researcher at the ESYCOM laboratory. His current research involves microwave photonic technologies. He is focused on the physics, design, and fabrication of components and as well as on their integration into opto-electronic circuit and package. One of its main focuses is given to the development of SiGe phototransistors for optical interconnections and radio-over-fiber (RoF) systems. He is an elected member of the ESYCOM council board and member of the European Technology Platform (ETP) Photonics'21.
 Catherine Algani was born in Thionville, France, in 1963. She received, from the University of Paris 6, France, a DEA degree in electronics, and a Ph.D. degree, respectively in 1987 and 1990. Her dissertation concerns the area of active MMIC design using GaAs HBTs technology in CNET-Bagneux. In 1991, she joined the electronics engineering department and the LISIF Laboratory, at University of Paris 6, as a lecturer. From 1991 to 2005, she worked on the design of microwave and millimeter-wave integrated circuits on different GaAs technologies. In 1997, she began to work in the area of microwave photonics (optically controlled microwave switches on GaAs and electro-optic organic modulator). In 2005, she joined ESYCOM at CNAM-Paris, where she is currently a full professor. Her current research interests are the development of devices, circuits, and sub-systems for ultrahigh speed digital and analog communications for ROF and wireless applications. These researches include the modeling, the design, and the characterization of such structures.
 Christian Rumelhard qualified as electronic engineer in 1966 and received a Docteur Ingénieur degree in 1977 (Paris-6 University). He worked at Thomson-CSF on the design of microwave tubes until 1969, on the design of hybrid microwave integrated circuits until 1975 and then he developed CAD algorithms and numerical models for the simulation of microwave circuits and devices. In 1980, he created an MMIC laboratory in the Central Research Laboratory of Thomson-CSF. In 1985, he was in charge of a design and characterisation team in the Gallium Arsenide Department of this company. During the 1980–90 decade, tens of MMICs were designed and characterized in his different teams. This activity resulted in many communications and contributions to four different books on microwave circuits. In 1992, he became professor in Conservatoire National des Arts et Métiers, Paris where he worked on simulation, design, and measurement of microwave and photonic devices (SiGe HPT), circuits and systems. From 1997 to 2005, he was director of Equipe Systèmes de Communication et Microsystèmes (ESYCOM), a common research team between CNAM, ESIEE and University of Marne-la-Vallée. He is now professor emeritus at CNAM. In October 2000, he was general chairman of the 3rd European Microwave Week in Paris.