Introduction
The first radiocarbon laboratory in Lithuania was established in 1965 at the Institute of Geology and Geography. Its Radioisotope Research Laboratory determines the 14C specific activity of benzene with the liquid scintillation analyzer Tri-Carb 3170TR/SL (Mažeika et al. Reference Mažeika, Blaževičius, Stančikaité and Kisieliené2009a). The scientific topics of this laboratory focus on various aspects of environmental radioactivity in Lithuania, particularly related to nuclear power (Mažeika et al. Reference Mažeika, Jefanova, Petrošius, Lujanienė and Skuratovič2022, Reference Mažeika, Lujaniene, Petrošius, Oryšaka and Ovčinikov2015, Reference Mažeika, Martma, Petrošius, Jakimavičiūtė-Maselienė and Skuratovič2013, Reference Mažeika, Guobyte, Kibirǩtis, Petrošius, Skuratovič and Taminskas2009b). Such knowledge provides insight into the environmental impact of nuclear power and highlights the importance of monitoring and managing radioactive waste.
A new radiocarbon laboratory was created with the installation of the 16th Single-Stage Accelerator Mass Spectrometer (SSAMS) from National Electrostatics Corp. (NEC) (Schroeder et al. Reference Schroeder, Hauser, Norton and Klody2007) at FTMC. The SSAMS was delivered to Vilnius in 2015, installed in January 2016, and, after four weeks, it passed an acceptance test. As the laboratory’s capacity expanded, there arose the necessity to purchase a second AMS instrument. Thus, after seven years of the laboratory’s establishment, a new Low Energy AMS (LEA, Ionplus) system was successfully installed and has been operational in our facility since the year 2023.
The Accelerator Mass Spectrometry Laboratory at FTMC is the first laboratory equipped with accelerator mass spectrometers in the Baltic region. Our laboratory is orientated for low-activity samples including historical, geological, and environmental studies. The laboratory produces ∼10000 14C measurements annually, a number that is expected to increase over the coming years as a result of the growth and advancement of the laboratory. We participate in the intercomparison tests to ensure that our 14C analysis is up-to-date with the latest quality standards. Improvements in measurement and chemical preparation of 14C samples occurred throughout the entire lifetime of the laboratory. However, a comprehensive overview of the radiocarbon analysis at the Center for Physical Science and Technology has not been produced so far.
The aim of this article is twofold: firstly, to provide an overview of the current state-of-the-art instrumentation, sample preparation protocols, and recent method developments at the Accelerator Mass Spectrometry Laboratory; secondly, to perform a thorough comparative analysis of two accelerator mass spectrometers (SSAMS and LEA) with a focus on validating the quality of 14C analysis through active participation in intercomparison tests.
Sample and data handling
To ensure efficient tracking of a large number of samples throughout processing and measurement, a data management system was developed to monitor their flow from the creation of a unique lab code to the generation of a dating certificate. During the order submission process, a unique lab code is assigned automatically to the entire order and to the individual samples. The code-based system ensures seamless identification throughout the entire workflow—from receipt to the final delivery of results. Upon receiving a sample, the date of receipt is recorded in the data management system, which automatically calculates the deadline date. The samples are then unpacked, visually inspected, and labeled. They are sorted by type and assigned to the appropriate personnel for chemical preparation. Once graphitization is completed, carbon amount (C) data from the Automated Graphitization Equipment (AGE-3, Ionplus AG) system is automatically transferred to the data management system. An indicator appears, showing that the sample has been graphitized. When a batch of graphitized samples, along with standards, is ready, a run list can be created within the system to proceed with upcoming sample preparation procedures by pressing the graphite samples into cathodes. Once the samples are measured, another status update is triggered. After measurement, the results are processed and stored in the data management system. When all samples within the order have been measured, a green indicator appears, signaling that the dating certificate can be generated. The database stores all sample information, ensuring quality control by preventing mix-ups and making each sample easily traceable throughout the entire processing workflow.
Chemical pretreatment procedures
Organic materials
The main objective of the chemical pretreatment is to clean the sample of potential contaminants and impurities or isolate an endogenous fraction (collagen, cellulose) from the total sample that is likely to have remained chemically unchanged in the burial environment. The standard acid-base-acid (ABA) method is a widely used technique for the preparation of organic samples for 14C dating. This method is particularly suitable for most organic materials (charcoal, seeds, nut shells, plant fragments, fragile wood samples, bone, etc.) and was applied in our laboratory (Brock et al. Reference Brock, Higham, Ditchfield and Ramsey2010; Molnar et al. Reference Molnar, Janovics, Major, Orsovszki, Gönczi, Veres, Leonard, Castle, Lange, Wacker, Hajdas and Jull2013). A treatment sequence is applied to the samples, involving a series of reagents, namely, 1 M HCl, distilled water, 0.2 M NaOH, distilled water (repeating the (water and) NaOH steps until the solution becomes colorless), and concluding with 1 M HCl. All steps are carried out at a temperature of 70°C, and the samples are stored in solution for one hour. After the ABA procedure, the samples are dried in a pH 3 solution at a temperature of 60°C or freeze-dried. Depending on the type of sample, the different concentrations of the acidic and alkaline solutions as well as temperature conditions may be utilized. Additional procedures may also be employed (Soxhlet extraction, collagen extraction, bleaching step) to ensure that the sample is cleaned of substances that could affect the 14C results. Often, the samples are poorly preserved, they are fragile or in very small quantities, attention should be paid to the preparation of such samples in order not to lose them.
Wood, uncharred plants, and seeds
Cellulose is a major component of wood and is often used for 14C analysis because it is a pure form of organic carbon that is virtually resistant to contamination. To extract and purify cellulose from the wood, the lignin, an intermediate product and filling material of the wood, must first be broken down. The standard ABA method breaks down and removes easily soluble wood components. However, the most stable part of the wood, α-cellulose, is extracted from holocellulose by dissolving the sample in alkali and acid and bleaching in sodium chlorite solution. Cellulose extraction of wood samples at our laboratory is performed using the base-acid-base-acid-bleaching (BABAB) method (Nemec et al. Reference Nemec, Wacker, Hajdas and Gaggeler2010). This procedure is similar to ABA, but it is modified for modern wood samples. A brief description of this methodology is provided using a sequence of solutions: 1 M NaOH overnight, followed by sequential treatments in 1 M HCl, 1 M NaOH, and 1 M HCl again for 1 h each, at 70°C; then bleaching step of 30 min using 5 % NaClO2 and 2 drops of 1 M HCl. Next, the samples are rinsed with ultrapure water and dried. When treating non-modern wood samples, uncharred plants, and seeds the concentrations of the solutions used may have to be modified, due to poor preservation, fragility or small quantities of the sample material. In this case, standard ABA is sufficient.
Charcoal, charred seeds, and carbonized organic residues
Charcoal, charred seed samples undergo ABA treatment (1 M HCl, 0.1–0.2 M NaOH, 1 M HCl, at 70°C). The concentration of the alkali solution may vary depending on the sample amount, moreover, seeds tend to decompose faster in a more concentrated NaOH solution.
Archaeological pottery can also be dated by collecting carbonized organic residues from the interior and exterior of the potsherds. Organic residues on the inner part of the potsherd are food crusts and residues preserved on the outer surface are considered soot (Teetaert et al. Reference Teetaert, Boudin, Saverwyns and Crombé2017). Soot samples are subjected to the ABA procedure, but as food crust samples are more sensitive to NaOH treatment, considering the significant fatty acid content and limited quantity, a gentler procedure is used in their case (Brock et al. Reference Brock, Higham, Ditchfield and Ramsey2010). A gentle treatment involves soaking food crust samples in 1 M HCl for an hour for demineralization and then subjecting them to 15 min of ultrasonication in fresh 1 M HCl. The samples then are rinsed 4 times with ultrapure water and ultrasonicated, which is repeated until the water remains clear. During the ultrasonication process, humic acids are released from the sample, turning the water brown. This is repeated until the solution becomes transparent. Finally, food crusts are acidified for 5 min with 1M HCl, rinsed with ultrapure water to reach pH3 and then dried.
Bone, tooth dentine, antler, and ivory
Collagen extraction and purification applied in our laboratory follows the Longin (Reference Longin1971) that was improved by other authors (Brock et al. Reference Brock, Higham, Ditchfield and Ramsey2010; Major et al. Reference Major, Futó, Dani, Cserpák-Laczi, Gasparik, Jull and Molnár2019b; Szidat et al. Reference Szidat, Vogel, Gubler and Lösch2016). First, samples are ultrasonicated in ultrapure water, dried, grinded, and sieved to get the appropriately sized sample fraction (0.5–1 mm). The preparation of bone and related material samples differs from the preparation of other organic materials because it requires collagen extraction (Taylor Reference Taylor1992). While the process follows the same ABA method described, the solution concentrations differ (0.5 M HCl (∼18 hr), subsequent removal of humic acids in 0.1–0.2 M NaOH (1 hr), and repeated acid wash of 0.5 M HCl (1 hr), and the preparation is conducted at room temperature. Bone collagen extraction is performed in a pH 3 solution at 70°C for 20 hr. The gelatin solution is filtered using a cleaned Ezee filter and lyophilized. The quality of collagen is monitored by carbon and nitrogen content in collagen and atomic C/N ratio determination. Samples are dated if the collagen yield is above 1 % and the C:N atomic ratio of the collagen is between 2.9 and 3.5 (DeNiro Reference DeNiro1985; Van Klinken Reference Van Klinken1999). The samples that deviate from these ratios are deemed unsuitable for dating.
Leather, skin, parchment, and woody plant material
These sample types undergo ABA treatment and may also be treated with the bleach solution (2.5–5% NaClO2). In the case of silk and wool, attention should be paid to the concentrations of the solutions used (for example: 1 M HCl; a few drops of 0.2 M NaOH; 1 M HCl), especially the alkali solution, as these materials are very sensitive to chemical treatment. The C:N ratio can serve as a reliable criterion for determining the quality (i.e., contamination levels) of wool and silk. For both silk and wool samples, an atomic C:N range of 2.9–3.4 and 3.4–3.8 respectively is considered indicative of good sample quality, i.e., free from contamination (Boudin et al. Reference Boudin, Bonafini, Vanden Berghe and Maquoi2016).
Sediment (also peat, and soil)
In the case of sediments, dating of bulk organic fraction is the predominant method. Chemical preparation involves only acid treatment (1 M HCl, at 70°C) of the sediment sample to remove carbonates and iron, which helps to release the humic acid in the next step. Dating other fractions (humic acid, and humin) of sediments provides a more nuanced and more detailed approach to the temporal aspects, environmental conditions, and preservation dynamics of organic material in a given sedimentary context. The choice of fractions to date depends on the specific goals of the study and the nature of the sedimentary environment under investigation. Thus, sometimes scientists prefer to date other sediment fractions, such as the humin fraction that remains after the ABA procedure and the humic acid fraction that is soluble in NaOH solution. The ABA procedure consists of the following steps: an overnight wash with 1 M acid, followed by a 1-hr wash with 0.2 M base, during which the base solution is replaced until it remains colorless. This is then followed by a final 1-hr wash with 1 M acid to obtain the humin fraction. All steps are conducted at 70°C. To obtain the base-soluble fraction the base washes are retained and acidified so that humic acid precipitates, which is then washed with water and dried (Brock et al. Reference Brock, Higham, Ditchfield and Ramsey2010).
Solvent extraction
In cases where chemical contaminants, preservatives are known or suspected to be present in the samples, it may be necessary to perform a solvent extraction to remove these contaminants. It is commonly used for the extraction of lipids, organic contaminants, or other preservatives. Samples for which Soxhlet extraction is most often used include textiles, leather products, parchment, paper samples, and items from museums that have been impregnated with organic substances to enhance longevity and prevent decomposition. Soxhlet extraction helps eliminate these contaminants before ABA treatment.
We have adopted a Soxhlet extraction protocol similar to that applied by Molnár et al. (Reference Molnar, Janovics, Major, Orsovszki, Gönczi, Veres, Leonard, Castle, Lange, Wacker, Hajdas and Jull2013) and Hajdas (Reference Hajdas2008, Reference Hajdas, Cristi, Bonani and Maurer2014). If a contaminant is suspected but its identity is unknown the contaminants are extracted in a sequence of hot solvents (extraction in each solvent is performed for 30 min or 1 hr): hexane, acetone, and ethanol, followed by a distilled water wash. We use these solvents in sequence because they dissolve all commonly used preservatives (Hajdas Reference Hajdas2008). If the specific contaminant is known, the selection of solvent can be customized to target that particular contaminant.
Carbonate-containing materials
Carbonate samples are pretreated differently, as organic matter must be removed when measuring 14C. This type of samples can be prepared both as pure carbonates (shells, corals, and rocks) and materials containing some amounts of carbonates (cremated bones, inorganic part of non-burned bone, and tooth enamel). Bioapatite is a mineral component of bone, and carbonates within these materials can be targeted for dating. Dating cremated bones is a challenging task since the high temperature of the cremation process can cause the loss of carbon (Stiner et al. Reference Stiner, Kuhn, Weiner and Bar-Yosef1995). However, advances in analytical techniques have made it possible to date cremated bones. Tooth enamel, the hard outer layer of the tooth composed primarily of mineral hydroxyapatite, can still be dated even if it contains little carbon. The type of sample determines the amount required for chemical preparation and graphitization. If the sample is pure carbonate, then the amount of sample for graphitization is about 10 mg (to graphitize 1 mg of C). If the sample is not pure carbonate, e.g., cremated bone, in which the carbon amount is about 0.5–1% by weight, the mass of the sample will be about 600 mg. Further, the carbonate samples are exposed to phosphoric acid, and the CO2 that is released is then graphitized. Acid hydrolysis of carbonate-contain materials and CO2 generation are performed using a Carbonate Handling System (CHS, Ionplus AG) (Wacker et al. Reference Wacker, Fülöp, Hajdas, Molnár and Rethemeyer2013). A more detailed description of the CHS operation is given below.
Shell, coral, and other carbonates
Coral, shell, and speleothem samples are surface abraded using a rotary tool and coarsely cut or crushed before cleaning in MilliQ water with ultrasonication. The organic materials are removed with H2O2 if necessary. Samples are then etched using 0.2 M HCl to remove the outer layer of potentially recrystallized carbonates. Samples are oven-dried at 60°C, hydrolyzed and graphitized using CHS-AGE-3.
Cremated bones
For bone samples to be analyzed as cremated bone, they should have a gray or almost white color, indicating that they have been subjected to a temperature greater than 600°C. The methodology used for treating cremated bone samples follows the procedures outlined by Major et al. (Reference Major, Dani, Kiss, Melis, Patay, Szabó, Hubay, Túri, Futó, Huszánk, Jull and Molnár2019a). The samples are washed with water and the external surface of the bone fragments is cleaned. 4–5 g of the cremated bone fragments is treated with 2 × 50 mL of 0.25 M sodium chlorite for 24 hr to eliminate any organic residues. The samples are then washed in ultrapure water before being treated with 2 × 50 mL 1 M acetic acid for another 24 hr to remove exogenous carbonates and poorly crystallized apatite crystallites. Finally, the samples are washed in ultrapure water until a transparent liquid is observed, oven-dried at 60°C, hydrolyzed and graphitized using CHS-AGE-3. Sometimes, at the request of the researchers, it is also possible to date unburnt bones after preparation with this method, if it is not possible to extract collagen from the bone because it is degraded and when there is no other material for dating, however, most often, unburnt bone dates are not reliable (Zazzo Reference Zazzo2014).
Tooth enamel
The methodology applied in the laboratory for enamel samples is according to (Koch et al. Reference Koch, Tuross and Fogel1997). Samples are surface cleaned, and enamel is separated from dentine using a hand-held Dremel drill. At least 200 mg of tooth enamel powder is collected. A 30% solution of H2O2 (0.1 mL per mg of sample) is added to the samples, which are then mixed and left in the fridge for 48 hr, with a shake given after 24 hr. Subsequently, the samples are rinsed five times with ultrapure water. A 1 M acetic acid solution with a calcium acetate buffer (0.05 mL per mg of sample, pH 4.5–5) is added, and the samples are left in the fridge for 24 hr, with a shake after 6 hr (Koch et al. Reference Koch, Tuross and Fogel1997). Finally, the samples are washed five times with ultrapure water, lyophilized, hydrolyzed and graphitized using CHS-AGE-3.
CO2 production and graphitization
The graphitization procedure at the Accelerator Mass Spectrometry Laboratory is carried out using Automated Graphitization Equipment connected either to EA, or CHS (Wacker et al. Reference Wacker, Němec and Bourquin2010a). Conversion to CO2 is performed differently for carbonate and organic samples. For organic materials, combustion is performed using an Elemental Analyzer. Samples are weighed in tin capsules and burned in oxygen in the combustion column, with helium serving as the carrier gas. Excess oxygen is removed in the reduction column using copper, and the combustion gases (N2, CO2, and H2O) are then separated, effectively cleaning the CO2. Released CO2 through the water column is transported to the AGE-3 system and absorbed in the zeolite trap.
In the case of carbonate samples, a certain amount (9–11 mg to get 1 mg C) of sample is weighed in a borosilicate vial, flushed with the helium carrier gas, treated with 85% orthophosphoric acid (0.25 mL), and kept at 70°C for 30 min in the Carbonate Handling System (CHS, Ionplus AG). The CO2 released from the sample is carried by He gas through a water trap to the AGE-3.
Cremated bones are an exceptional case in graphitization, which cannot be performed in the usual way. The laboratory developed a conversion to CO₂ procedure for cremated bones because we observed that even small amounts of sulfur compounds produced from the cremated bone samples poison the iron catalyst and inhibit the graphitization process (Šapolaitė et al. Reference Šapolaitė, Ežerinskis, Butkus, Garbarienė, Garbaras, Kurila, Bučinskas, Pabedinskas and Remeikis2021). Graphitization of cremated bones is performed as carbonate samples using a CHS device. The chemically pre-treated sample is crushed into powder and about 600 mg of the sample is weighed into the borosilicate vial. Later, the vials are flushed with helium carrier gas, samples treated with 85% orthophosphoric acid and kept at 70°C for 5 hr in the CHS system. The CO2 and other gases released from the sample are carried by He gas to the AGE-3 graphitization system through the online sulfur trap consisting of a heater with controlled temperature (600°C) and a quartz tube filled with silvered cobaltous oxide granules and is located between CHS system and AGE-3 (Šapolaitė et al. Reference Šapolaitė, Ežerinskis, Butkus, Garbarienė, Garbaras, Kurila, Bučinskas, Pabedinskas and Remeikis2021). Further, the graphitization reaction proceeded with AGE-3.
The AGE-3 system is comprised of seven reactors with a certain amount of iron catalyst (∼5 mg), which are used in the graphitization process. CO2 gas, produced by either the CHS or EA devices, is collected in the zeolite trap before being released into these reactors. This zeolite trap is a useful element of the AGE-3 system which operates as a temporary gas storage device, being able to hold and release the sample CO2 by heating. The zeolite trap between the samples remains clean because, after loading the sample into the reactor, it undergoes additional heating. The zeolite trap is heated to 450°C and the CO2 is subsequently thermally desorbed into one of the graphitization reactors. Peltier coolers are used to remove water from the reaction volume. After loading the reactors, the Peltier coolers are activated and the preheated ovens are raised to begin the graphitization process. The CO2 undergoes a 2-hr graphitization reaction with H2 (H2/CO2 ratio of 2.3) in the presence of an iron catalyst, at 580°C temperature. While standard samples typically contain approximately 1 mg of carbon, reliable dating can be achieved with samples containing as little as 200 μg of carbon. Therefore, in a single automated graphitization cycle, which takes around 5 hr, the AGE-3 can produce a batch of seven samples of high-quality graphite. One limitation of the AGE-3 system is that the minimum amount of carbon that can be graphitized is 200 µg (Wacker et al. Reference Wacker, Němec and Bourquin2010a).
Special application of 14C analysis
Measurements of low carbon aerosol filter samples
Since the amount of carbon in aerosol filter samples is usually very low, it typically requires several 1.9 cm diameter punches (number of punches from 3 to 25) of each aerosol filter to collect >200 μg of carbon (the lowest limit of AGE-3) (Garbarienė et al. Reference Garbarienė, Šapolaitė, Garbaras, Ežerinskis, Pocevičius, Krikščikas, Plukis and Remeikis2016). Therefore, sometimes aerosol filter samples are not sufficient for 14C analysis in our laboratory with the available equipment. A new method was developed at the Accelerator Mass Spectrometry Laboratory for graphitization of low-carbon aerosol filters. By applying the method described in Butkus et al. (Reference Butkus, Šapolaitė, Garbarienė, Garbaras, Bučinskas, Pabedinskas, Remeikis and Ežerinskis2022), we were able to graphitize aerosol samples with carbon content as low as 40 µg from a single punch. For the preparation of aerosol filters the sample dilution method was used and the mass balance equation for the estimation of 14C values was applied. The essence of the method is that the filter sample is prepared by combusting a single punch of the filter, and the remaining carbon needed for graphitization is added from a 14C-free reference material (phthalic anhydride, PhA, 0 pMC). This method is much faster, costs less, and requires less filter material. The 14C values were calculated using a mass balance equation:
 $${\rm{\;pMC}}_{\left( {{\rm{mixture}}} \right)}^{\rm{\;}} = {\rm{pM}}{{\rm{C}}_{\left( {\rm{s}} \right)}}{{\rm{n}}_{\left( {\rm{s}} \right)}} + {\rm{pM}}{{\rm{C}}_{\left( {{\rm{PhA}}} \right)}}{{\rm{n}}_{\left( {{\rm{PhA}}} \right)}}$$

where
 ${\rm{pMC}}_{\left( {{\rm{mixture}}} \right)}^{\rm{\;}}$
is measured pMC of the mixture,
 ${\rm{pM}}{{\rm{C}}_{\left( {\rm{s}} \right)}}$
is pMC of the sample, ns is the partial contribution of the sample;
 ${\rm{pM}}{{\rm{C}}_{\left( {{\rm{PhA}}} \right)}}$
is pMC of phthalic anhydride,
 ${{\rm{n}}_{\left( {{\rm{PhA}}} \right)}}$
is the partial contribution of the phthalic anhydride.
The dilution method was tested using reference materials with known 14C values (standards NIST-OXII - 134.06 pMC and IAEA-C7 - 49.53 pMC). OXII and C7 were diluted with 14C-free phthalic anhydride (PhA) until sufficient mass (500 µg C) for graphitization was acquired. Reliable 14C values were obtained for samples containing between 40 and 200 µg of carbon. The pMC values of the diluted samples containing 50–200 μg C corresponded closely with the actual pMC values of the standards (OXII and C7), showing a variation within 0.3 pMC. However, the 14C/12C ratio showed a discrepancy within the 12 to 40 μg C range. In this mass range, the shift between the estimated and nominal standard values averaged 1.99 ± 1.42 pMC (Butkus et al. Reference Butkus, Šapolaitė, Garbarienė, Garbaras, Bučinskas, Pabedinskas, Remeikis and Ežerinskis2022).
The development of our new graphitization method for low-carbon aerosol filter samples marks a significant enhancement in radiocarbon dating techniques, particularly within the scope of aerosol particle source apportionment studies. While this method excels in achieving acceptable precision levels of 2–3 pMC for these specific samples, it is important to note its limitations in applications requiring higher precision, such as in certain archaeological contexts where precision closer to 0.3 pMC for modern samples is often necessary. Therefore, while this method contributes greatly to our understanding of aerosol samples, its application in archaeology remains limited due to the higher precision requirements in that field.
Measurements of biobased carbon content
Biofuels and other materials derived from renewable biomass are becoming increasingly important in efforts to reduce greenhouse gas emissions and promote sustainability. One key aspect of evaluating the environmental impact of these materials is measuring their biobased carbon content. The laboratory can provide accredited measurements of biobased carbon content according to the standard on the determination of biobased content in the American Society for Testing and Materials (ASTM), which is ASTM D 6866-24a entitled “Standard Test Methods for Determining the Biobased Content of Solid, Liquid, and Gaseous Samples Using Radiocarbon Analysis” (ASTM, 2024a). Such samples do not need chemical preparation; they are graphitized with the AGE-3 system and measured. Radiocarbon results are reported as biobased carbon content (Cb) and are calculated according to the standard method (ASTM D6866 2024):
 $${C_b} = \left( {\frac{{pM{C_s}}} \over {{pM{C_{ref}}}}} \right) \times 100$$
where pMCs is the measured 14C (pMC) value of the sample, and the pMCref is the 14C (pMC) value of the reference—atmospheric correction factor at the time of testing (which is 99.4 pMC according to ASTM D6866 2024a).
Instrumentation
SSAMS
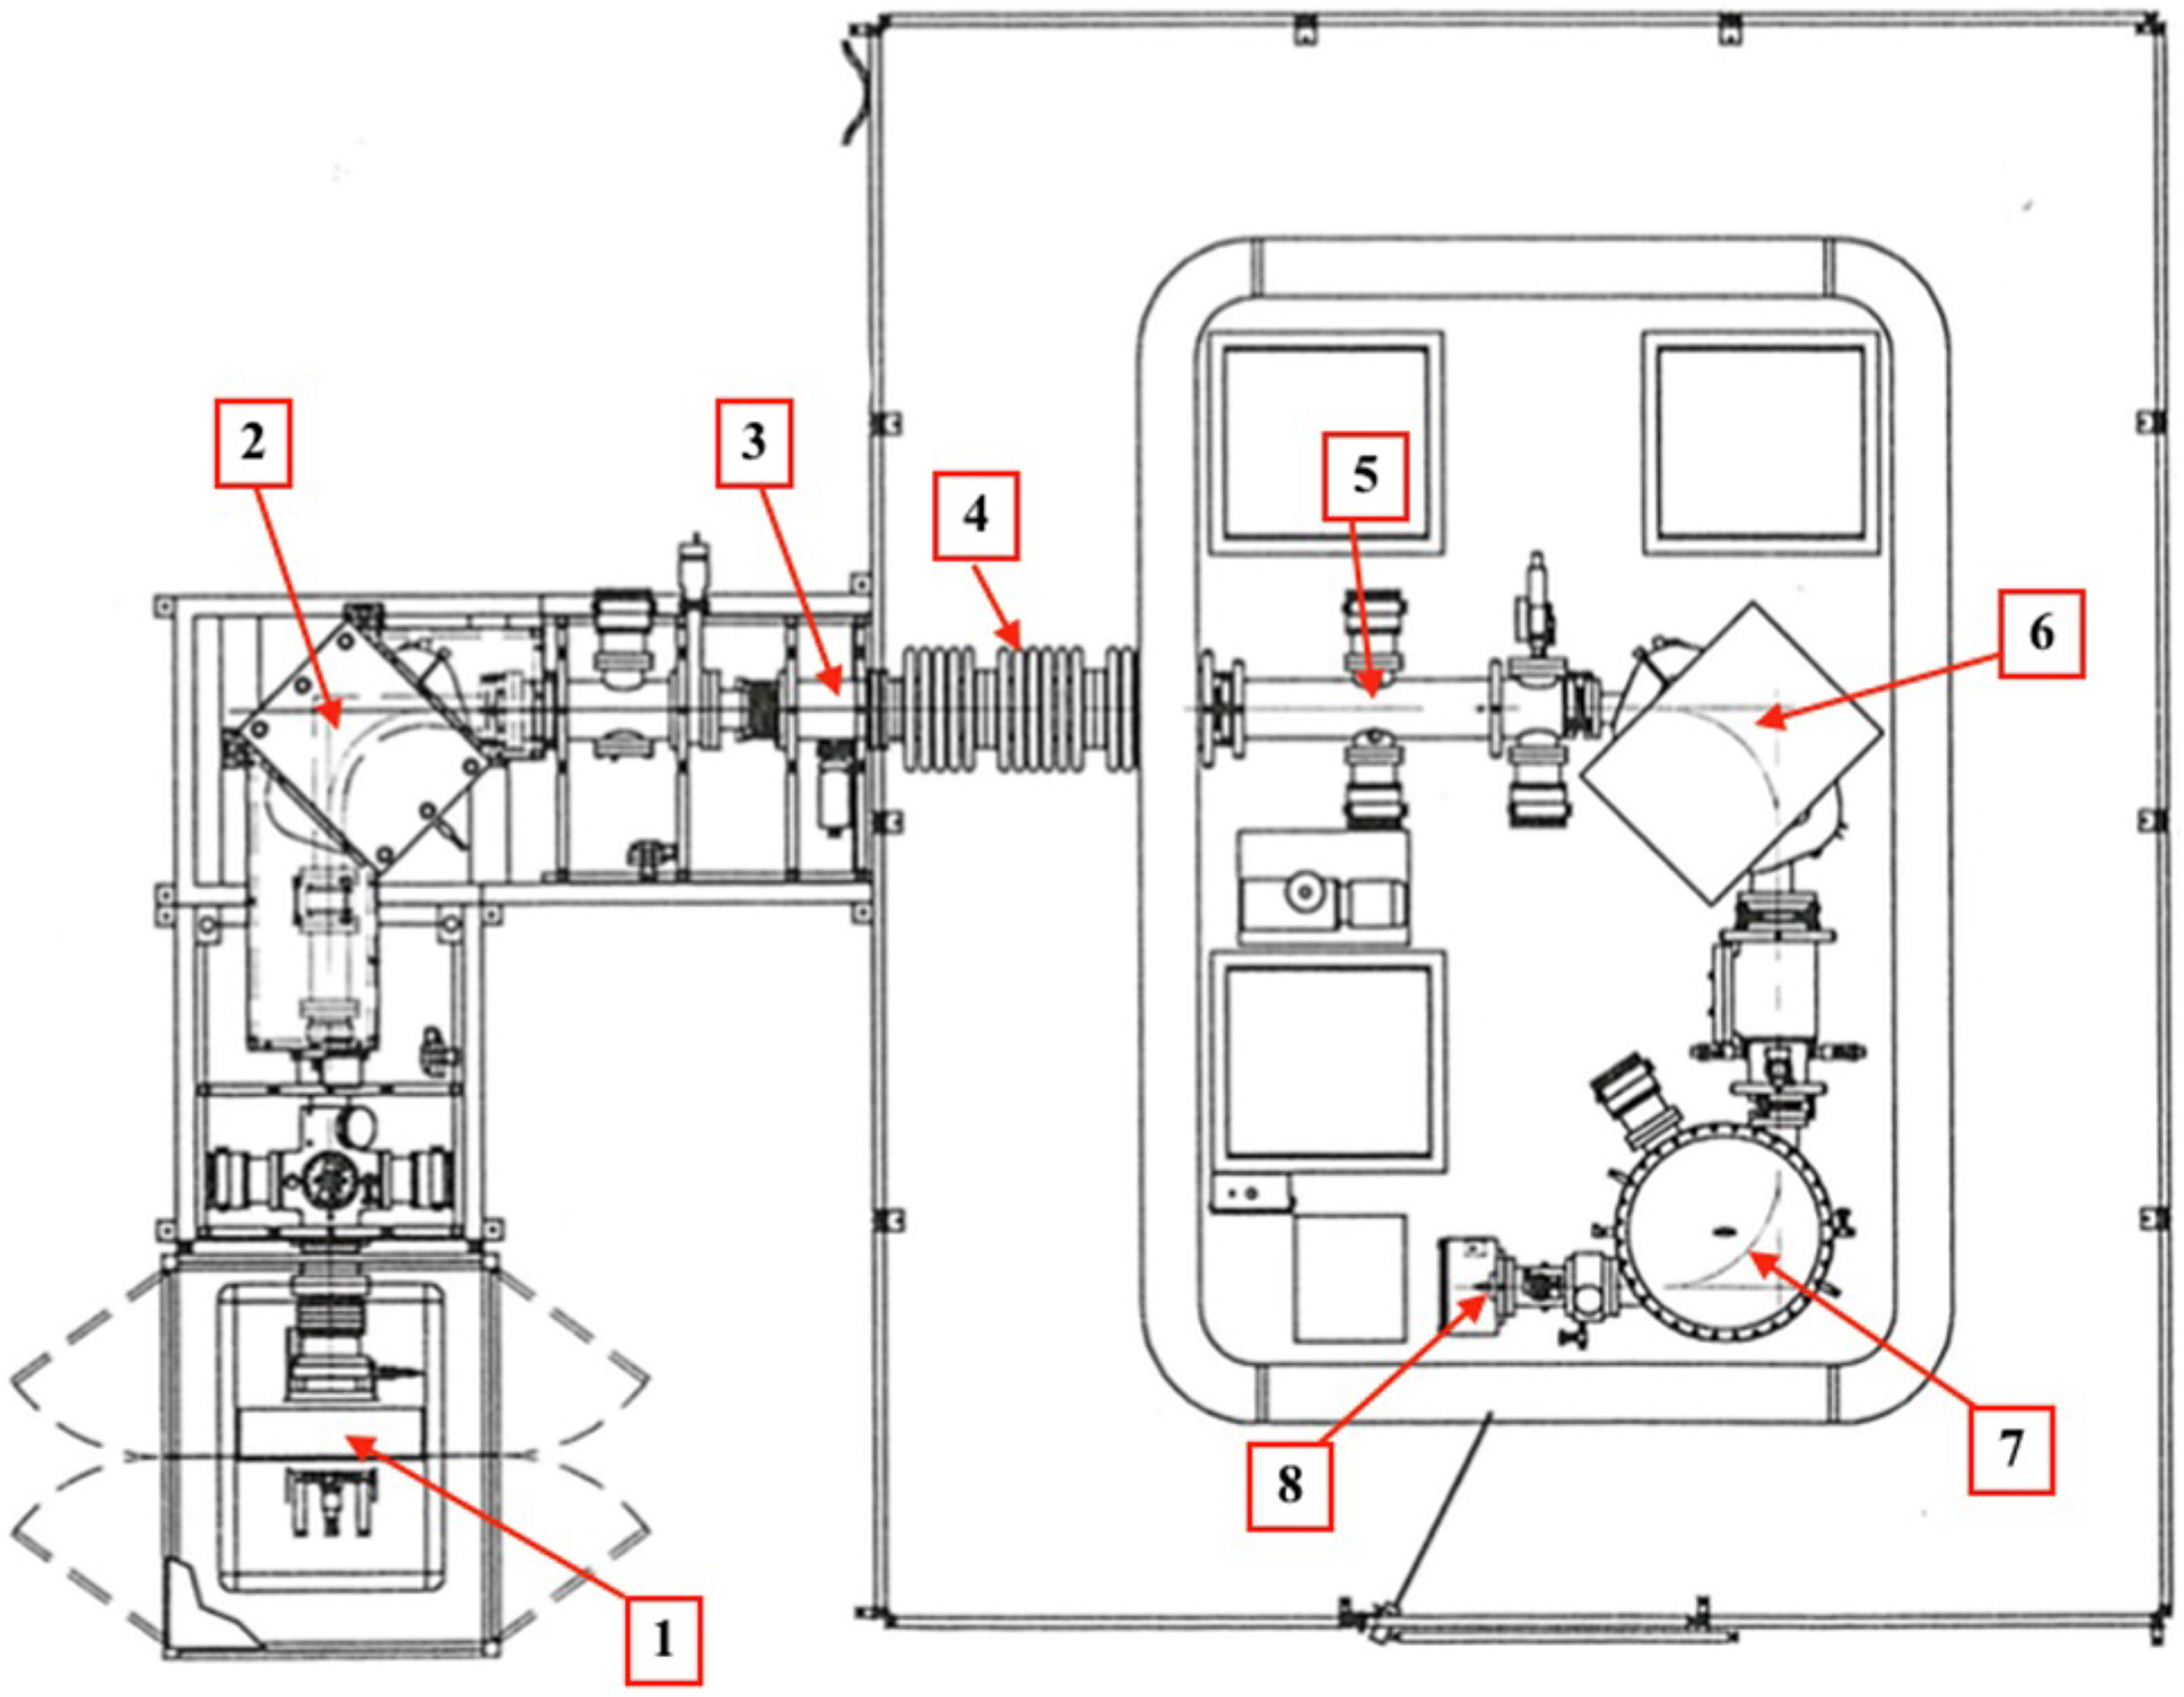
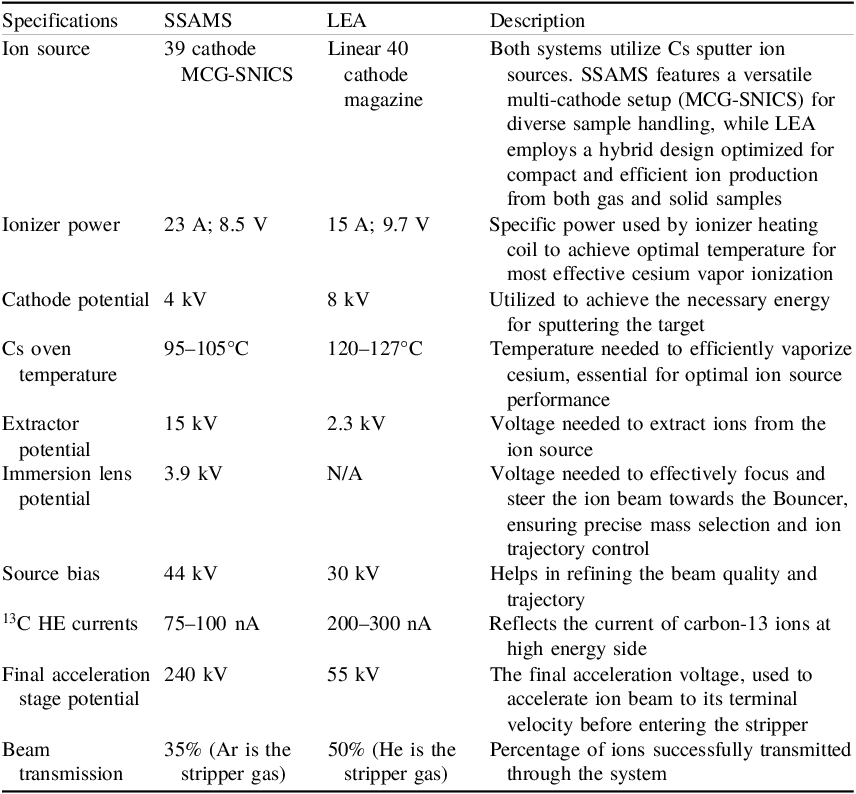
Our SSAMS is the 16th spectrometer produced by NEC (Figure 1). The source operating parameters (as detailed in Table 1) and most components of the SSAMS are very similar to those in previous accelerator mass spectrometers. This includes similarities to systems like the Compact AMS (CAMS) (Prasad et al. Reference Prasad, Noakes, Cherkinsky, Culp and Dvoracek2013) and the Mini Carbon Dating System (MICADAS) (Synal et al. Reference Synal, Stocker and Suter2007). For a comprehensive analysis of the SSAMS system, detailed technical specifications, and performance evaluations, refer to the work by Skog (Reference Skog2007), which provides an in-depth review of its design and operational capabilities. NEC designed, constructed, and installed our SSAMS model with a specialized capability to interface with the Gas Sample Delivery System (GSDS), which was also developed by NEC. The GSDS is integrated into the Multi-Cathode Source of Negative Ions by cesium Sputtering (MC-SNICS), with a designated space in position zero of the cathode wheel. The wheel has 39 positions for standard samples and one for the gaseous system. The inclusion of GSDS allows for the measurement of samples with less than 200 μg of carbon, below the minimum required for sample preparation with the AGE-3 graphitization system. Each measurement session, which accommodates 39 samples, necessitates the optimization of SSAMS using “dead” graphite powder (Alfa Aesar, Germany). Prior to each measurement, critical components of the SSAMS, such as the low-energy (LE) magnet, high-energy (HE) magnet, and the Einzel lens, are precisely calibrated using the 13C isotope. Calibration can only commence if the ion current measured from the fourth Faraday cup on the high-energy side initially exceeds 75 nA +13C. In each sample wheel, we incorporate two background targets and OXII as primary standards, which repeat after every five unknown samples. Additionally, the same number of secondary standards, such as C3 and C9 for samples requiring chemical pretreatment like wood, charcoal, etc., or C2 for carbonates, is used. Regular monitoring and adjustment of the accelerator’s operating parameters, as well as tracking their changes, are essential. Such measures are crucial to avoid misinterpretation of data from poor measurements and to guarantee the reliability of sample analysis.
SSAMS system at the Center for Physical Sciences and Technology in Vilnius: 1. Ion source with the sample wheel of 39 positions. 2. Dipole magnet. 3. Einzel lens. 4. 250 kV accelerator. 5. Molecular dissociator. 6. Dipole magnet. 7. Electrostatic analyzer (ESA). 8. Solid state detector.

Typical operating parameters of the SSAMS and LEA systems

LEA
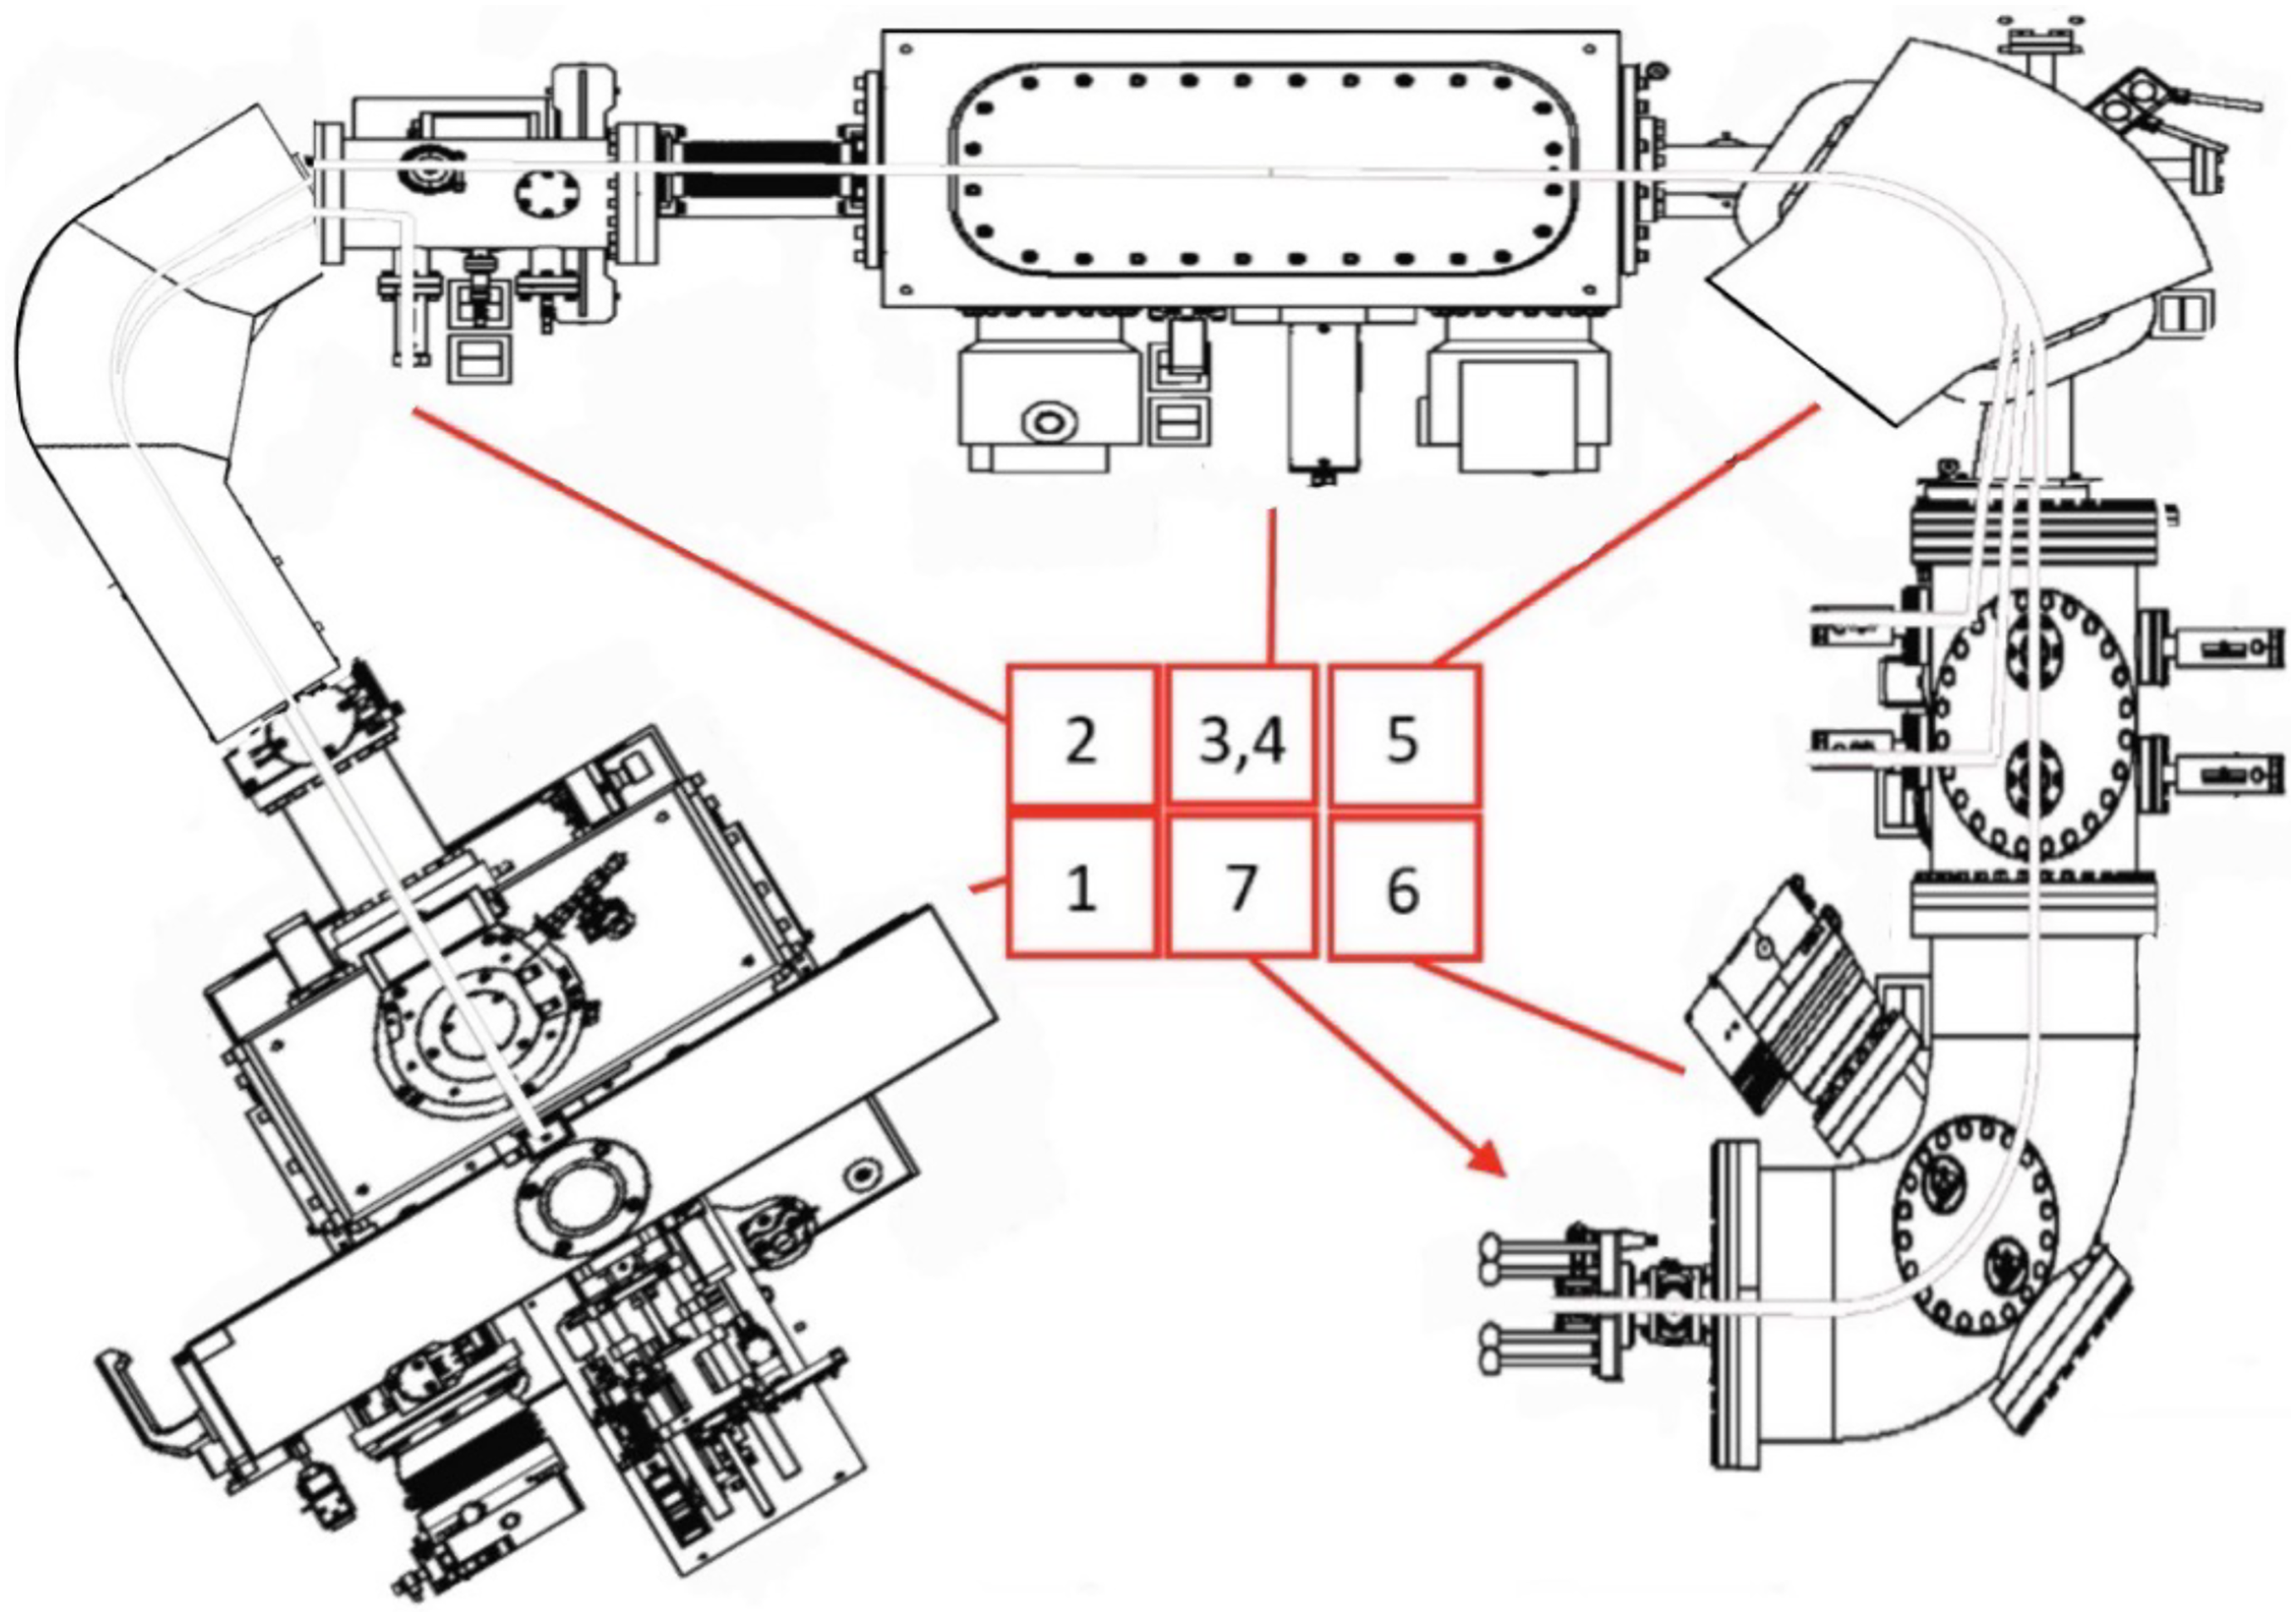
The Low Energy AMS (LEA) system (Figure 2), a significant advancement in accelerator mass spectrometry, has been developed by building upon the well-established concepts of the Mini Radiocarbon Dating System (MICADAS). Introduced by Ionplus and featuring a patented helium stripping technology, LEA operates at a reduced accelerator voltage of only 50 kV, marking a notable evolution from the MICADAS system (Ramsperger et al. Reference Ramsperger, De Maria, Gautschi, Maxeiner, Arnold, Synal and Wacker2023; Synal et al. Reference Synal, Stocker and Suter2007). LEA has been installed in the laboratory since 2023. The dimensions of LEA, at just 2.6 m in length, 1.8 m in width, and 1.5 m in height, make it less than half the size of the MICADAS system, establishing it as the most compact 14C-AMS system globally. Incorporating many of MICADAS’ established concepts and components, LEA also boasts similar features. These include a hybrid Cs sputter ion source capable of measuring both gas and solid samples, a random-access sample changer with an airlock for continuous measurement, and a maintenance-free, vacuum-insulated tandem accelerator. The application of helium stripping at low voltages in LEA enhances the transmission efficiency to approximately 50%, with measured values typically ranging from 48% to 50%. Detailed specifications and main parameters of LEA are outlined in Table 1.
LEA system at Center for Physical Sciences and Technology in Vilnius. 1. Ion source with the sample changer of 40 positions. 2. Low energy magnet. 3, 4. 50 kV accelerator, molecular dissociator. 5. High energy magnet. 6. ESA. 7. Gas detector.

Using the SSAMS system, 18 runs per sample are typically performed, with each run lasting approximately 3 minutes. For the LEA system, 10 runs per sample are conducted, with each run taking about 5 minutes. In both cases, each sample is measured for a fixed number of runs unless the data meet the user-defined precision threshold. For instance, if a precision threshold of 2.5‰ is set, the SSAMS system automatically terminates the measurement once this precision is achieved, even if fewer than 18 runs have been completed. This feature proves particularly useful during busy periods in the lab, as it can save several hours of beam time by eliminating unnecessary additional runs. However, the LEA system does not automate this process, so the measurement is either manually stopped once the desired precision is reached or allowed to complete all 10 runs. Two blanks (phthalic anhydride) are used per sample wheel or magazine, and oxalic acid (OXII) is measured every fifth unknown sample. Alpha graphite is measured to assess the machine background, and a background correction is always applied.
For data analysis, both NEC’s “ABC” software (https://www.pelletron.com/ ) and Ionplus’s “BATS” software (Wacker et al. Reference Wacker, Christl and Synal2010b) (https://www.ionplus.ch/ ) were used. Both programs reliably generate conventional radiocarbon ages (years BP) and associated uncertainties following the standard AMS methodology outlined by Stuiver and Polach (Reference Stuiver and Polach1977). However, Ionplus’s “BATS” software is now primarily used for both systems.
Each sub-run is individually normalized against the corresponding sub-run of the standard, and the software calculates the average of these normalized ratios to produce the final value (Wacker et al. Reference Wacker, Christl and Synal2010b). To account for potential contamination introduced during sample preparation, phthalic anhydride is measured as a process blank alongside the samples. The measured 14C value in this “dead” blank is subtracted from each sample’s ratio before 14C/12C ratios fractionation correction and normalization to the modern standard. Sub-runs typically exhibit consistent scatter, on the order of 2.5‰, which meets the target precision for final radiocarbon measurements.
Results
Comparative analysis of two AMS systems (SSAMS and LEA)
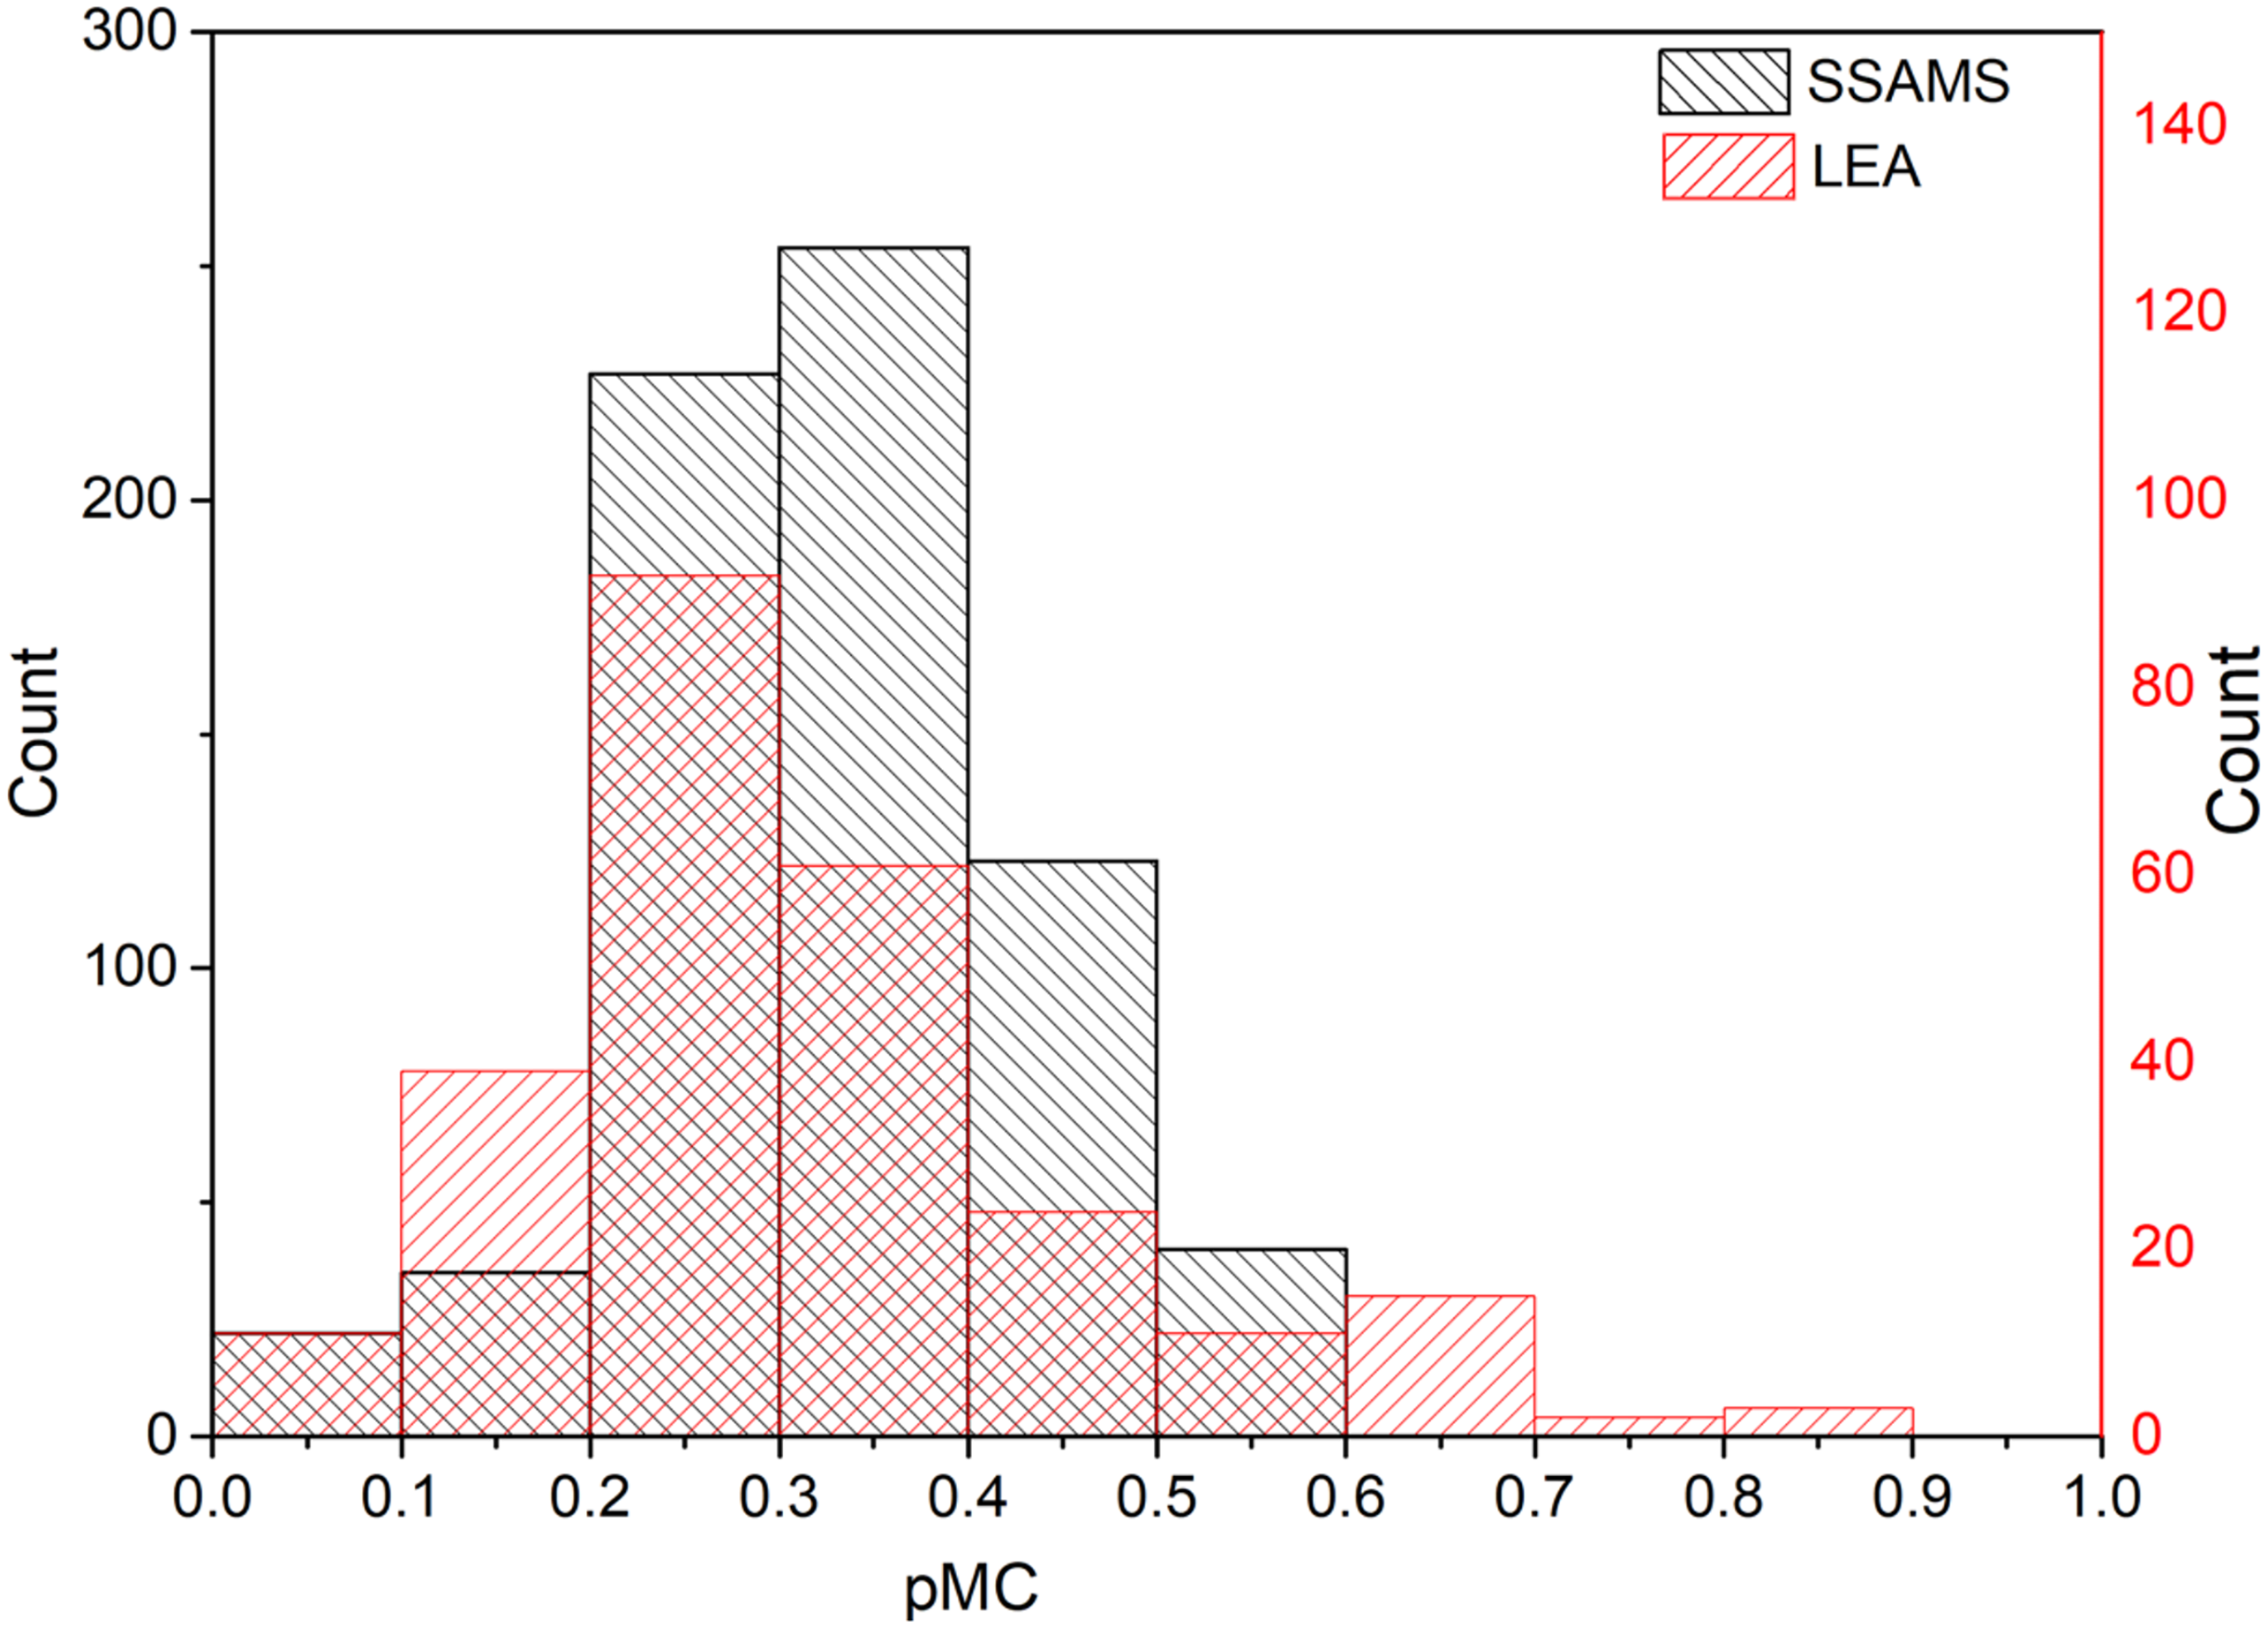
Given that our laboratory operates two different AMS devices, we have the unique opportunity to conduct a comparative analysis between them. The precision, accuracy, and sensitivity of radiocarbon dating are the main parameters within our research. To verify the reliability of the 14C measurements standard materials are used. The main standards used in the laboratory are NIST OXII (134.06 pMC), IAEA C7 (49.53 pMC), IAEA C3 (129.41 pMC), IAEA C9 (0.12–0.21 pMC) and phthalic anhydride (PhA, 0 pMC). Phthalic anhydride (Alfa Aesar ACS, 99.0–100.2%, Flaky Crystals C6H4(CO)2O, LOT: T17F017) serves as a processed background, while IAEA C9 is used as a secondary background standard. Figure 3 illustrates the radiocarbon concentration of PhA samples that have undergone the standard graphitization procedure measured with both AMS systems. The y-axis represents the quantity of processed samples, revealing a substantial disparity in the number of samples measured. This discrepancy arises from the fact that SSAMS has been in operation for a considerably longer period than LEA, which was installed seven years later. Despite this discrepancy, hundreds of processed blanks were analyzed by LEA, and the results demonstrate comparable performance.
Distribution of background levels (pMC) measured with SSAMS (black bars) and LEA (red bars) using a standard sample size of 1 mg C. A total of 700 blanks (phthalic anhydride) were measured with SSAMS and 260 with LEA. The average pMC for SSAMS measurements is 0.33 (σ = 0.11), while LEA measurements average is 0.31 (σ = 0.15).

Within a few months (1 to 2 months or ∼600 measured cathodes) after the cleaning of the source, LEA exhibits significantly worse background results compared to SSAMS. The notable halving of 12C currents, along with a relatively high background, indicates the need for a source cleaning. This need is further underscored by the elevated background levels in LEA, as seen in Figure 3, where values exceed 0.5 pMC. In contrast, SSAMS requires a source cleaning cycle every 3–4 months (∼1200 measured cathodes), allowing for more continuous operation without interruption. This difference also extends to Cs replacement: the LEA reservoir can hold 3 g of Cs, lasting about 6 months of continuous operation, whereas the SSAMS reservoir holds 5 g, lasting over a year, even under heavy load.
Despite these challenges, LEA offers advantages in measurement speed. On the high-energy side, LEA generates approximately twice as much 12C current as SSAMS, with output rates of around 20 µA and 10 µA, respectively. This translates to approximately 9000 counts per minute for LEA with a transmission rate of about 50% (using helium striper gas) and 5000 counts per minute for SSAMS with a 35% transmission rate (using Argon striper gas), based on the OXII standard. Moreover, for SSAMS, 40 µA of 12C on the low energy side is the upper limit to avoid the space charge effect, as mentioned by Skog (Reference Skog2007). Since the 13C/12C isotopic ratio is crucial for correcting the final result and thereby affects measurement precision, it is essential to keep currents below this threshold. While LEA provides higher currents and more counts, measurement precision ultimately depends on result variability. Our data confirm that increased count rates improve precision but do not eliminate inherent measurement variations.
A significant improvement in the SSAMS system was achieved by stabilizing the cesium oven temperatures, reducing fluctuations from ±3°C to ±0.5°C. This stabilization not only led to more consistent currents of 12C and 13C on the high energy side but also enhanced the precision of 13C/12C ratio measurements by a factor of 10, reducing the variability from 0.2% to 0.02%. Since all radiocarbon dates are corrected for isotopic fractionation, accurate measurements of the 13C/12C ratio play a crucial role in determining the final result. With these improvements, typical measurement precision for modern samples—for the same amount of material and measuring time—has improved from 0.55–0.62% to 0.35–0.36%.
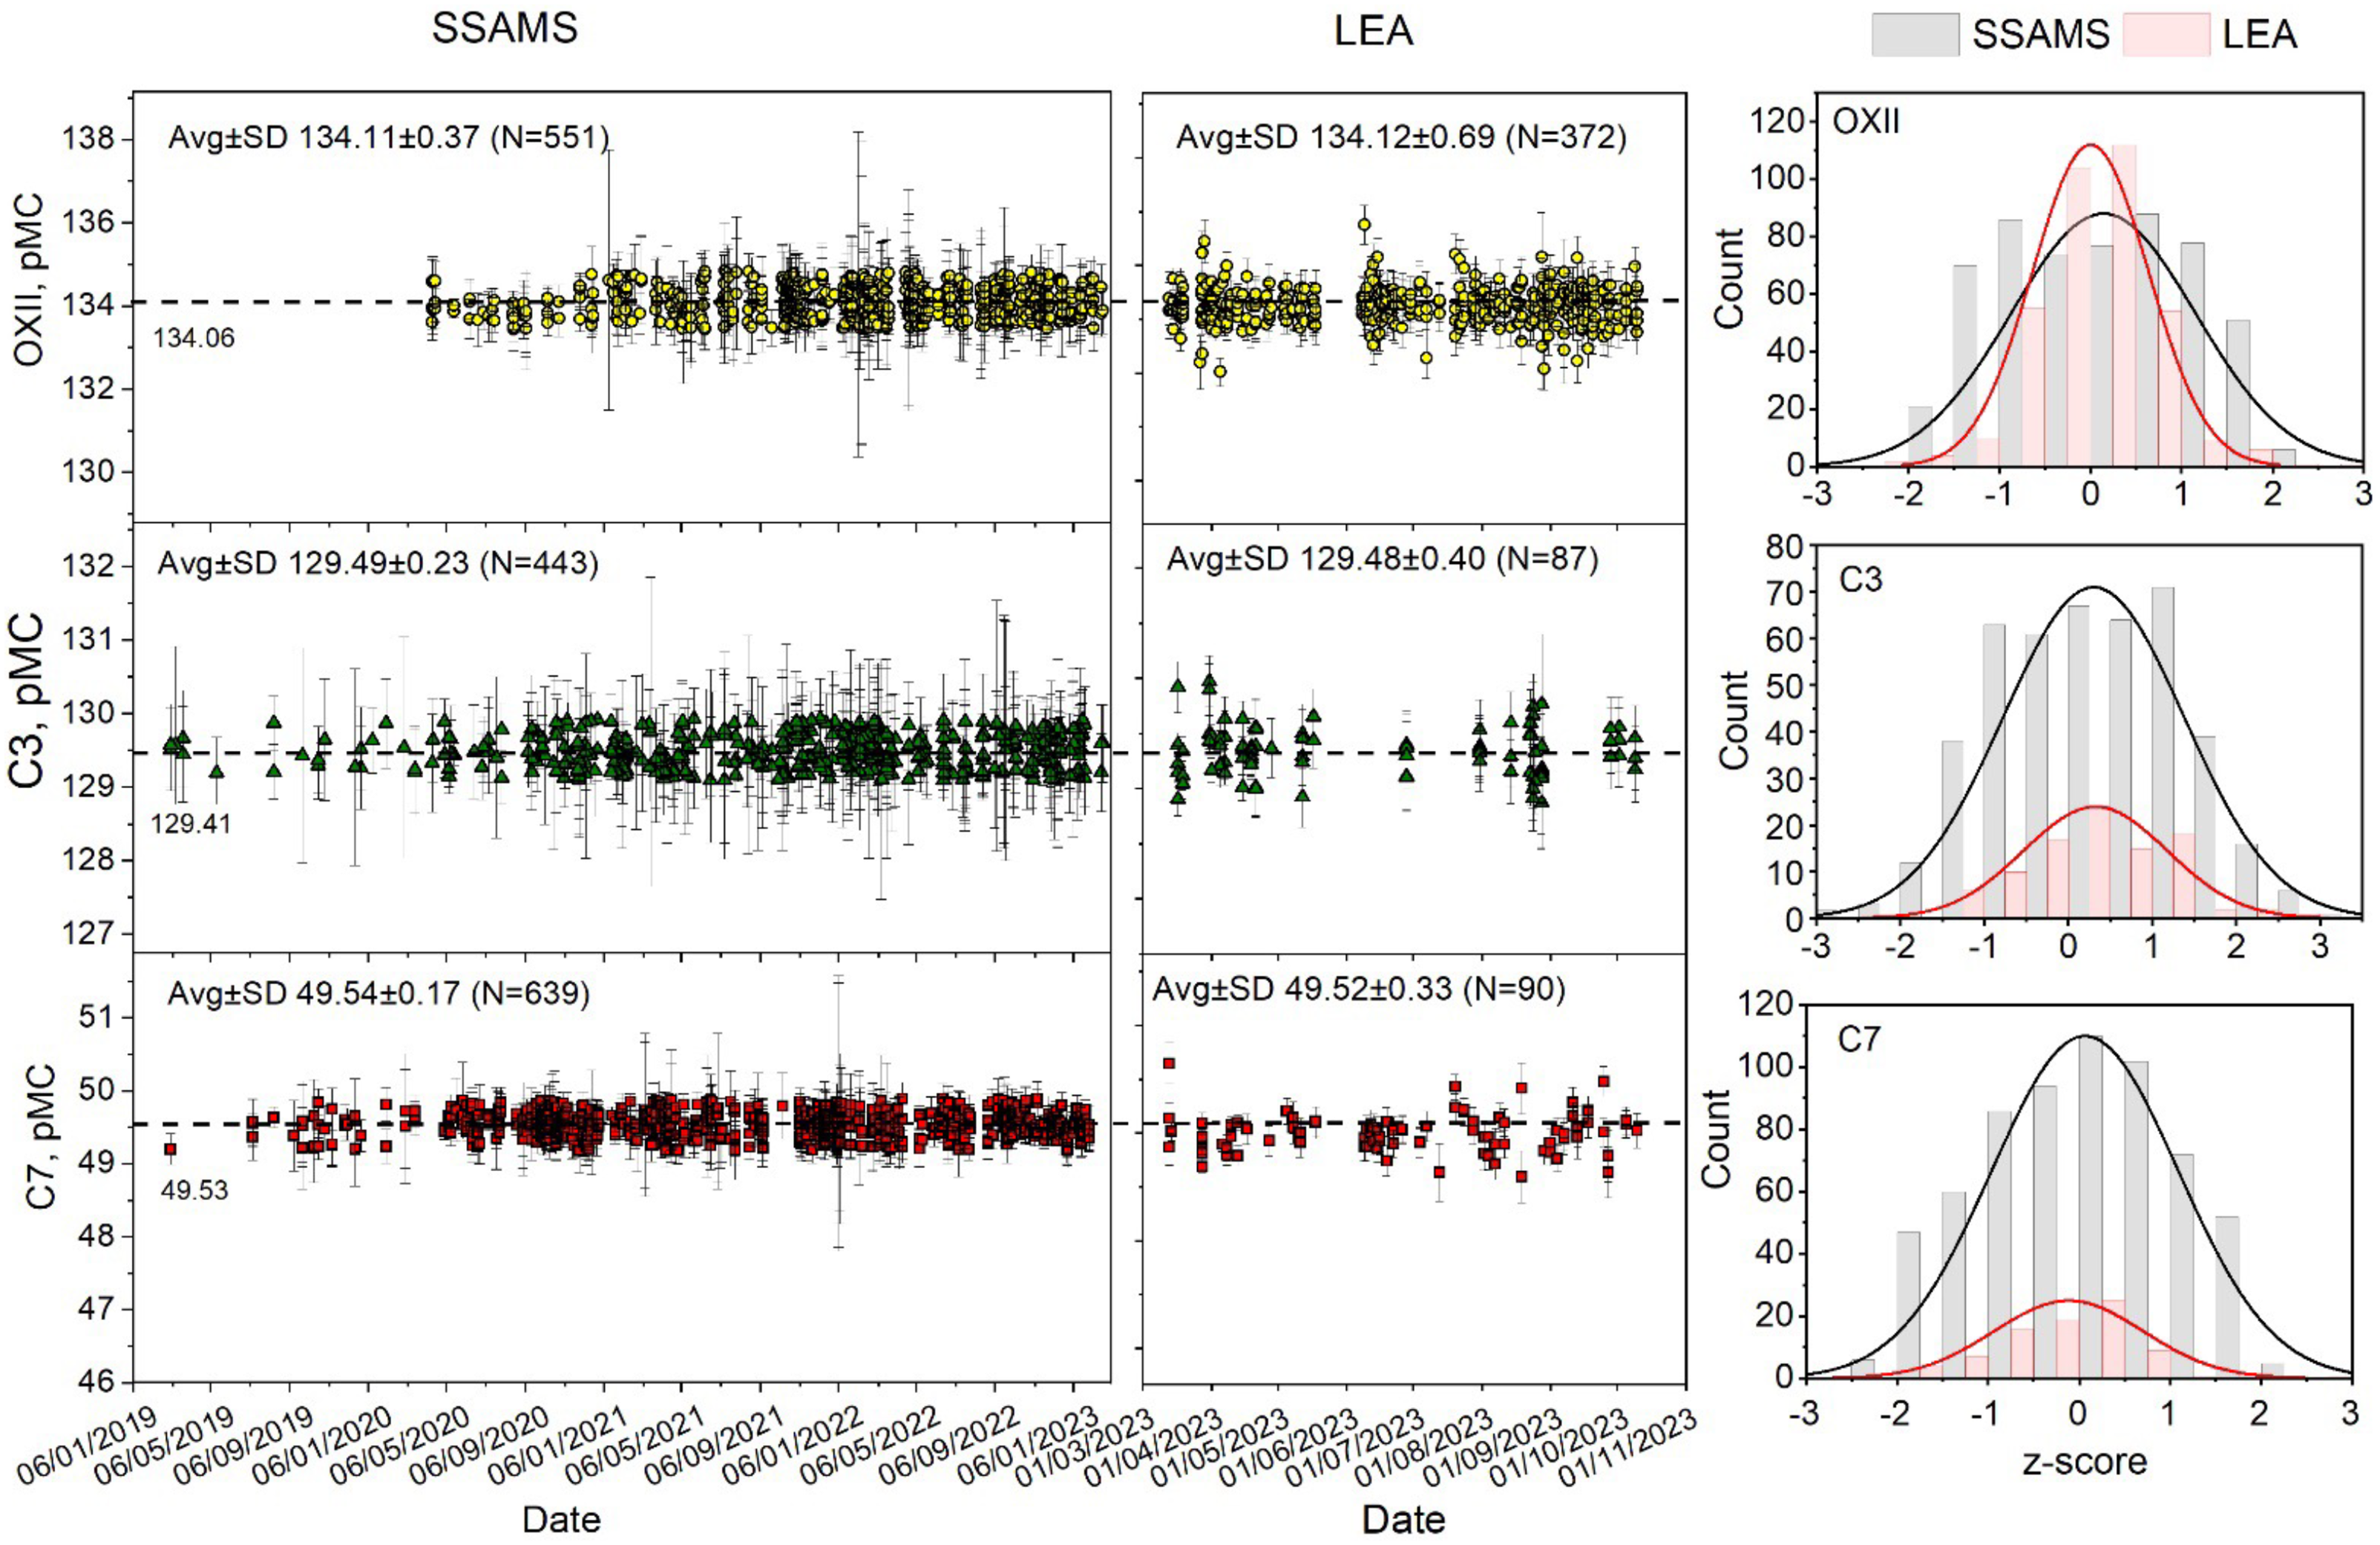
To assess and compare the performance of the SSAMS and LEA, an extensive dataset was collected over five years for SSAMS, and all measured standards measured by LEA since its installation. This comprehensive dataset comprises thousands of known standards, with LEA employing hundreds, all of which were normalized to OXII. OXII is used as the primary normalization standard. For each wheel, five OXII targets are processed individually. Each target undergoes blank correction, 14C/12C fractionation correction, and normalization to the nominal OXII value. An average normalized value is then computed from these five targets, and the corresponding pMC values are subsequently calculated. Because individual target values can slightly deviate from the average, the pMC values are very close to—but not exactly—the nominal value. C3, C7, and other quality control standards are employed as independent secondary standards. The results, depicted in Figure 4, highlight the precision of both SSAMS and LEA systems, with SSAMS recording averages for OXII 134.11±0.37 pMC, C3 129.49±0.23 pMC, and C7 49.54±0.17 pMC, and LEA closely mirroring these averages with OXII 134.12±0.69 pMC, C3 129.48±0.40 pMC, and C7 49.52±0.33 pMC. It demonstrates a close match between the measured values obtained by SSAMS and LEA systems and the nominal values, with all measurements falling within the range of ± 3 sigma. This level of precision reaffirms the reliability and accuracy of both SSAMS and LEA in 14C analysis. However, while the average measured values closely approximate their nominal counterparts, there are still observable outliers. These outliers, however, fall within the expected range when considering a 3-sigma deviation. This observation is typical and indicates that despite minor deviations, the overall dataset reflects a high degree of accuracy and consistency in the performance of SSAMS and LEA systems.
Measurement results of standard materials (OXII, C3, and C7) with SSAMS and LEA.

Overall, an evaluation of both machines demonstrates their good performance, particularly in terms of measurement accuracy and background values. The LEA system stands out for its ability to achieve the desired measurement precision at a notably quicker rate. However, this efficiency comes with a trade-off: the LEA requires more frequent maintenance and servicing compared to the SSAMS. While SSAMS may take longer to reach the same level of precision, it offers the advantage of less frequent servicing needs, making it a more low-maintenance option in the long run.
Intercomparison tests
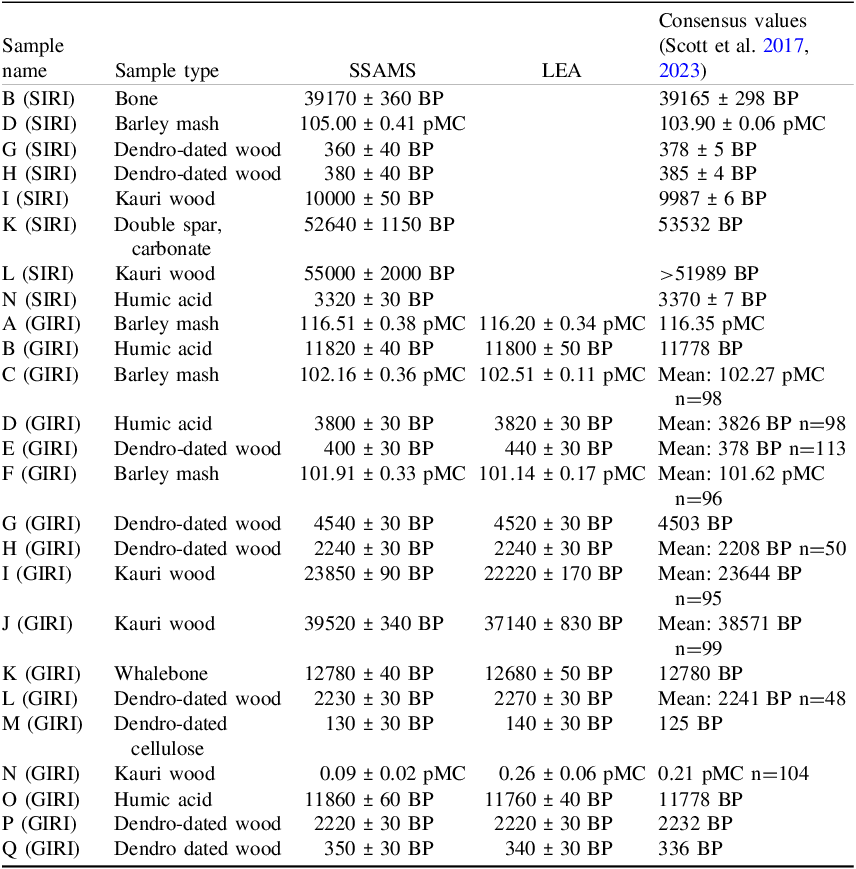
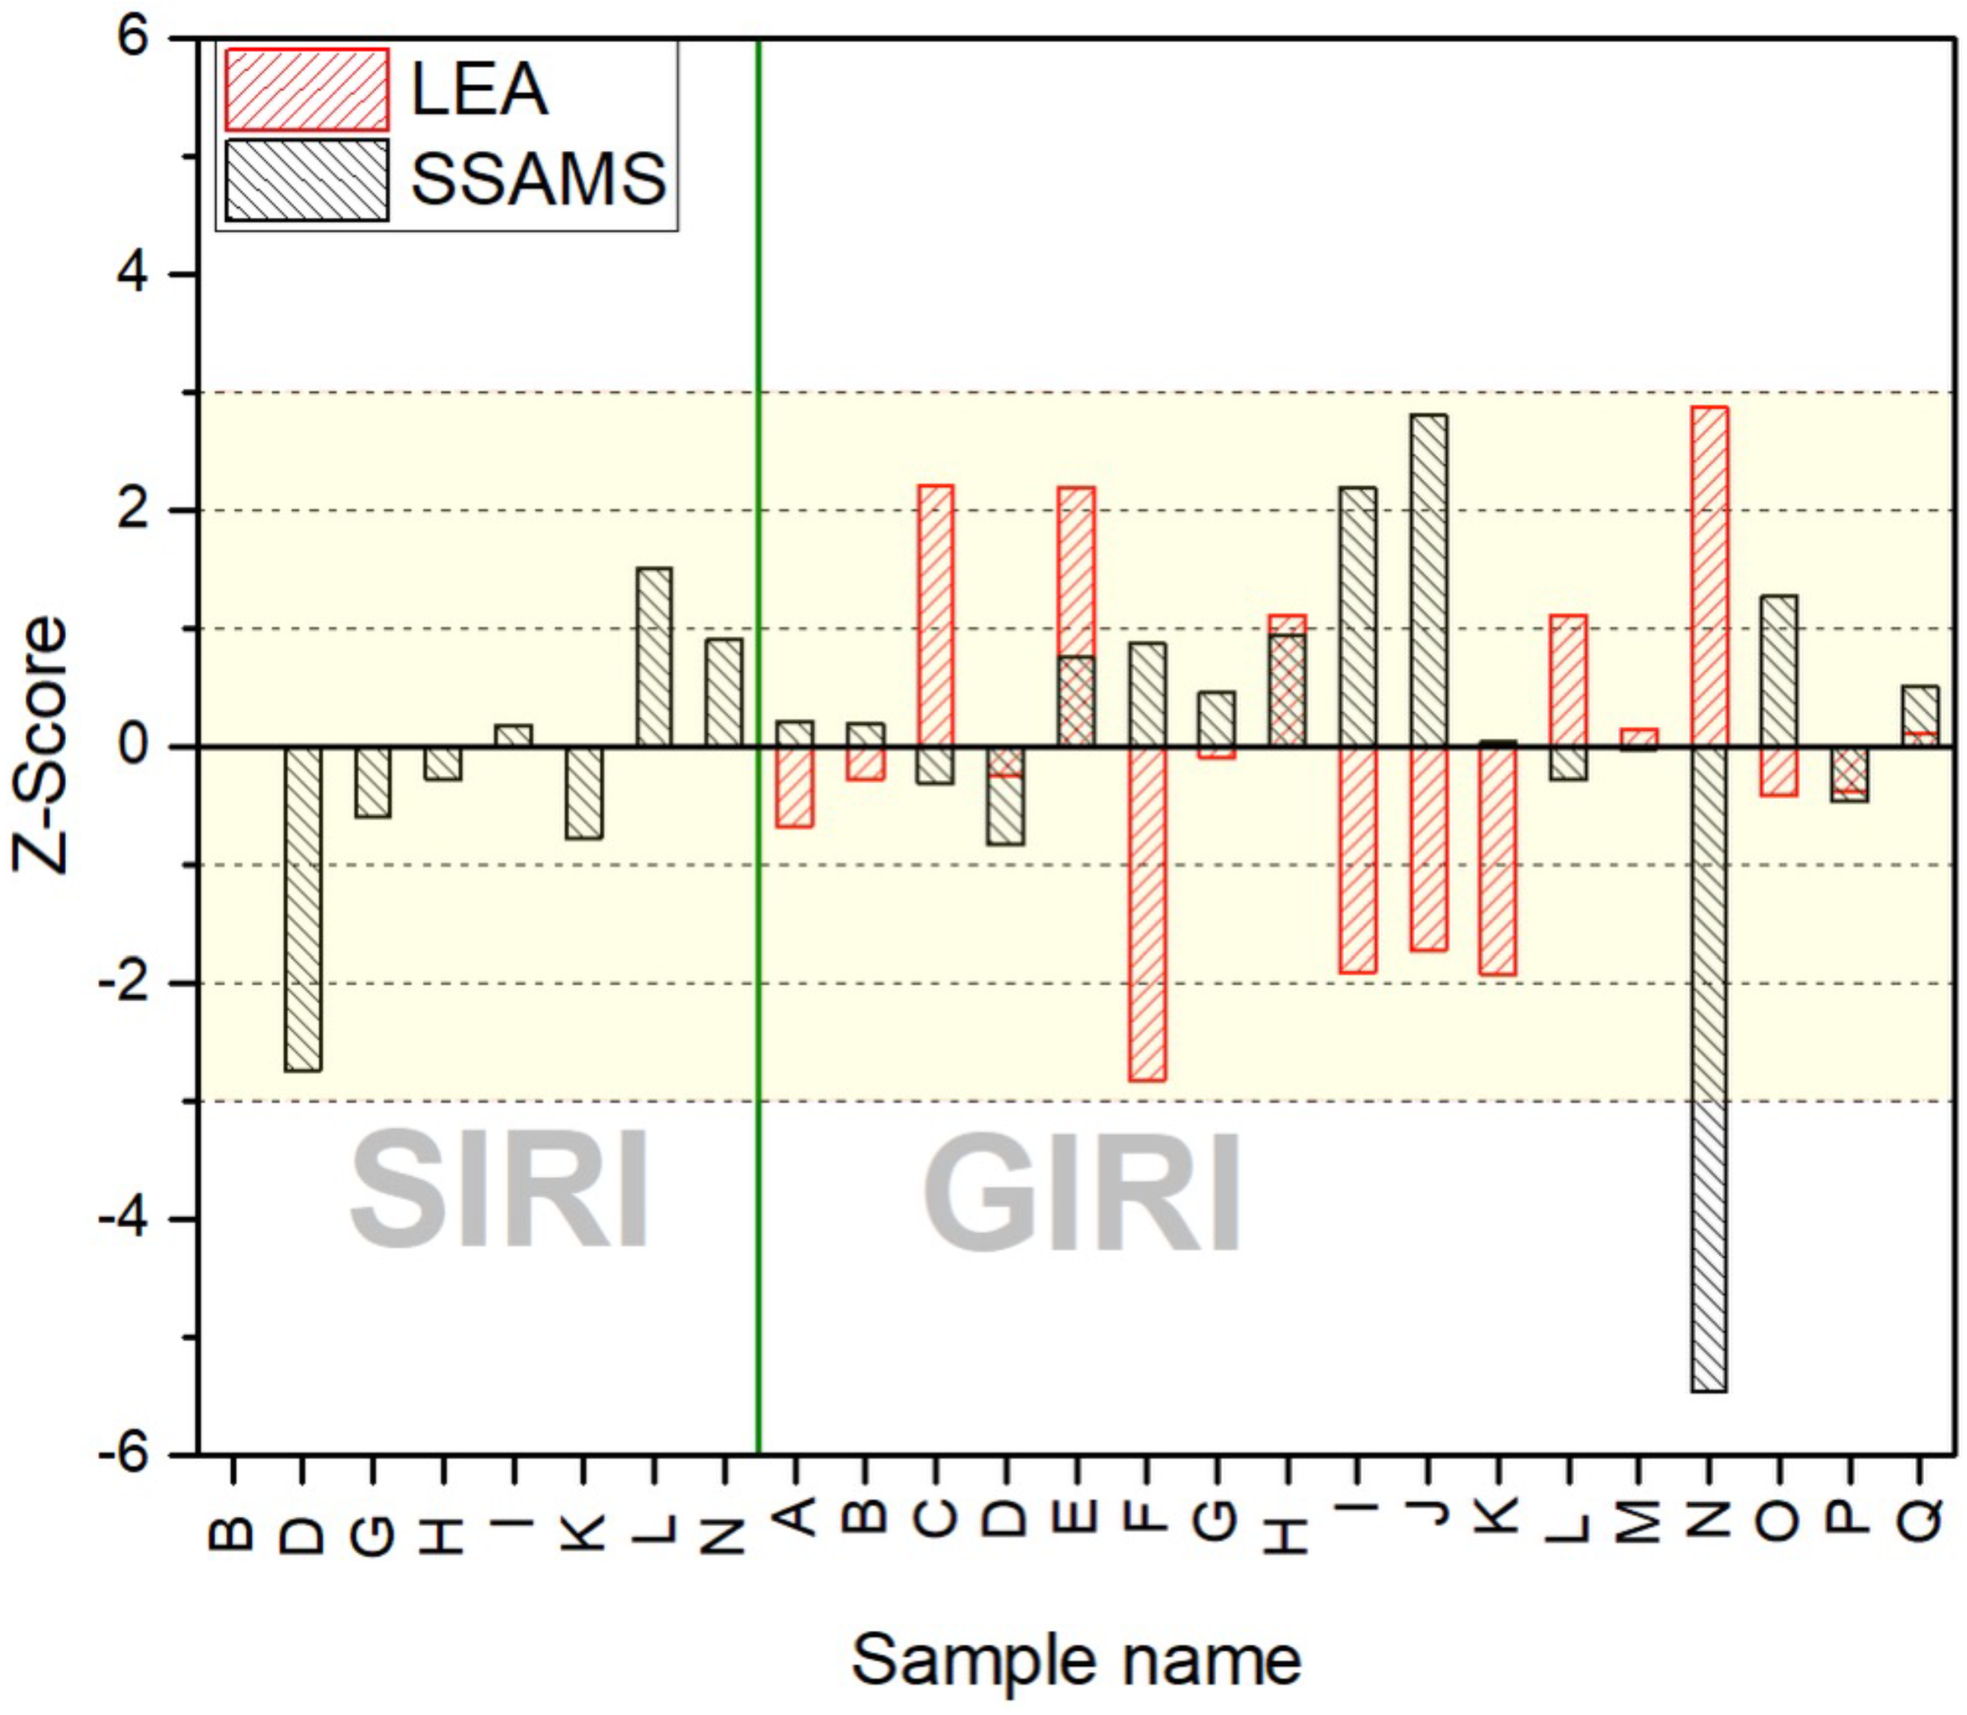
The best proof of the quality of 14C analysis is participation in intercomparison tests. These tests are very rare in the case of 14C, so when the first AMS was installed, such a test had already taken place (the Sixth International Radiocarbon Intercomparison, SIRI). However, organizers agreed to send us samples and tests were conducted to validate the measurement quality, aimed primarily for our internal purposes (Scott et al. Reference Scott, Naysmith and Cook2017). 14C was measured in various samples (bone, trees, barley mash, carbonates, and humic acid). Preparation of all samples was carried out according to the methods described earlier, except for humic acid, which did not require chemical preparation. The results (average of five repetitions) are in accordance with Scott et al. (Reference Scott, Naysmith and Cook2017) and presented in Table 2. Additional data can be found in supplementary materials (Table S1). The corresponding z-scores are shown in Figure 5.
SSAMS and LEA 14C results of SIRI and GIRI tests.

Z-score distribution across SIRI and GIRI intercomparison test.

The Glasgow International Radiocarbon Intercomparison (GIRI) was held in 2022–2023. We participated in the GIRI test with SSAMS and later measured GIRI samples with LEA after its installation. The samples received were similar to the SIRI test (wood, bone, barley mash, humic acid, and cellulose). Humic acid and cellulose did not require pretreatment, other samples were prepared by the methods described above. All of the samples included in the study are naturally occurring materials. While some of the samples have known ages, they cover a wide range of ages spanning from over 40,000 years before the present to modern times (Scott et al. Reference Scott, Naysmith and Dunbar2023). The results of the GIRI intercomparison test with both instruments, presented as an average of five independent repetitions, are shown in Table 2 (additional data is presented in supplementary materials, Table S1). The standard deviation of the five measurements is nearly the same as the uncertainty of a single run, indicating that measurement variability is comparable to individual measurement uncertainty. The standard deviation of the measurements is reported instead of the standard deviation of the mean to more accurately reflect true measurement precision.
In Figure 5, the z-score values are presented as a measure of deviation from the group mean, where each value is quantified in terms of the number of standard deviations it lies from this central value. According to accepted statistical norms, z-scores within the range of ± 3 standard deviations from the mean are typically regarded as falling within the normal variation expected for a dataset (Thompson Reference Thompson2022). Figure 5 illustrates the SIRI and GIRI intercomparison results, where most data points lie within 2σ of their consensus values. This close agreement aligns with the average z-scores: SIRI -0.22 ± 1.19, GIRI (SSAMS) 0.16 ± 1.66, and GIRI (LEA) –0.04 ± 1.52, indicating overall consistency. One sample, Kauri wood (GIRI N measured with SSAMS), lies beyond the 3σ range. This material, intended as a low-activity baseline, initially measured 0.48 pMC before blank subtraction. However, because the SSAMS background was slightly higher at the time (phthalic anhydride measured 0.39 pMC versus the usual ∼0.33 pMC), the corrected Kauri wood value dropped to 0.09 pMC. Low-activity samples are especially sensitive to minor variations in blank levels, so careful background monitoring is essential. Even small shifts can significantly impact the measured values of older samples.
Summary and conclusions
This paper presents chemical pretreatment protocols, methodological improvements and the current AMS facilities at the Center for Physical Sciences and Technology (FTMC), Vilnius, Lithuania. The Laboratory has developed specialized methods tailored to the challenges of materials such as cremated bone and low-carbon aerosol filter samples. The results of 14C measurement of standard and blank materials showed accurate and reliable radiocarbon analysis with two AMS systems (SSAMS and LEA). Low blank values of 0.33 pMC and 0.31 pMC, along with sufficient precision of of 134.11 ± 0.37 and 134.12 ± 0.69 (for OXII), were achieved for SSAMS and LEA, respectively. Participation in international intercomparison tests (SIRI and GIRI) showed the reliability of both SSAMS and LEA, which is confirmed by the z-score analysis demonstrating strong agreement with the consensus values for SIRI (−0.22 ± 1.19), GIRI (SSAMS) (0.16 ± 1.66) and GIRI (LEA) (−0.04 ± 1.52). The consistent 14C values from intercomparison tests not only confirm the efficiency of sample preparation methods at the Vilnius Accelerator Mass Spectrometry Laboratory but also demonstrate the reliable and well-matched performance of the two AMS systems.
Supplementary material
To view supplementary material for this article, please visit https://doi.org/10.1017/RDC.2025.10120