
Introduction
Crystalline metallic materials are highly desirable in the industry because most of them have suitable thermal and controllable mechanical properties. Some metallic systems could be formed even in an amorphous state at an ultra-rapid solidification rate. Amorphous metals have been popular in recent years because of their unique properties such as high strength and excellent corrosion resistance.( Reference Inoue 1 – Reference Nishiyama, Amiya and Inoue 4 ) The common metallic glass systems are Zr-, Cu-, Fe-, Ni-, and Mg-based alloy systems.( Reference Inoue 5 ) Owing to the recent technical improvements, it has become easier to produce bulk metallic glasses (BMGs) with high glass-forming ability (GFA) via inexpensive manufacturing processes. The GFA was a factor to evaluate possibilities of specific alloy systems to form BMGs, which forming chances could be determined by three empirical rules (proposed by Inoue( Reference Inoue 1 , Reference Inoue 5 )), T rg [reduced glass transition temperature( Reference Turnbull 6 , Reference Lu, Liu, Liu, Miller and Liaw 7 )], R c [critical cooling rate( Reference Inoue 1 , Reference Inoue 5 , Reference Yuan, Bao, Lu, Zhang and Yao 8 )], ΔT x [ = T x − T g, supercooled liquid region( Reference Inoue 1 , Reference Inoue 5 )], and γ [=T x/(T l + T g)( Reference Lu, Liu, Liu, Miller and Liaw 7 , Reference Lu and Liu 9 )], etc. Therefore, related BMG research has become more important.
Zr-based alloys are suitable BMG candidates due to a broad supercooled liquid region and a high GFA in Zr-based alloys.( Reference Inoue 5 ) The elements, Ag and Al, are usually added to the Zr-based BMG systems to improve corrosion resistance, mechanical properties, and GFA.( Reference Inoue, Zhang and Masumoto 10 , Reference Inoue and Zhang 11 ) Forty-eight Ag–Al–Zr ternary alloys were prepared in this study using the copper mold casting method to determine the metallic glass regions in the Ag–Al–Zr ternary system. Ag–Al,( Reference McAlister 12 ) Ag–Zr,( Reference Karakaya and Thompson 13 ) and Al–Zr( Reference Murray, Peruzzi and Abriata 14 ) binary phase diagrams have been widely studied; however, only a few studies( Reference Rieger, Nowotny and Benesovsky 15 , Reference Kotur and Verbovytsky 16 ) have documented the phase equilibria information on the Ag–Al–Zr ternary system. In these two studies, determination of intermetallic phases formation was conflicted, thus need to be investigated further.
In the backdrop of the mentioned studies, this one attempts to investigate the phase equilibria of the Ag–Al–Zr ternary system at 773 K (500 °C).
Experimental procedures
Metallic glass region determination of Ag–Al–Zr ternary alloys
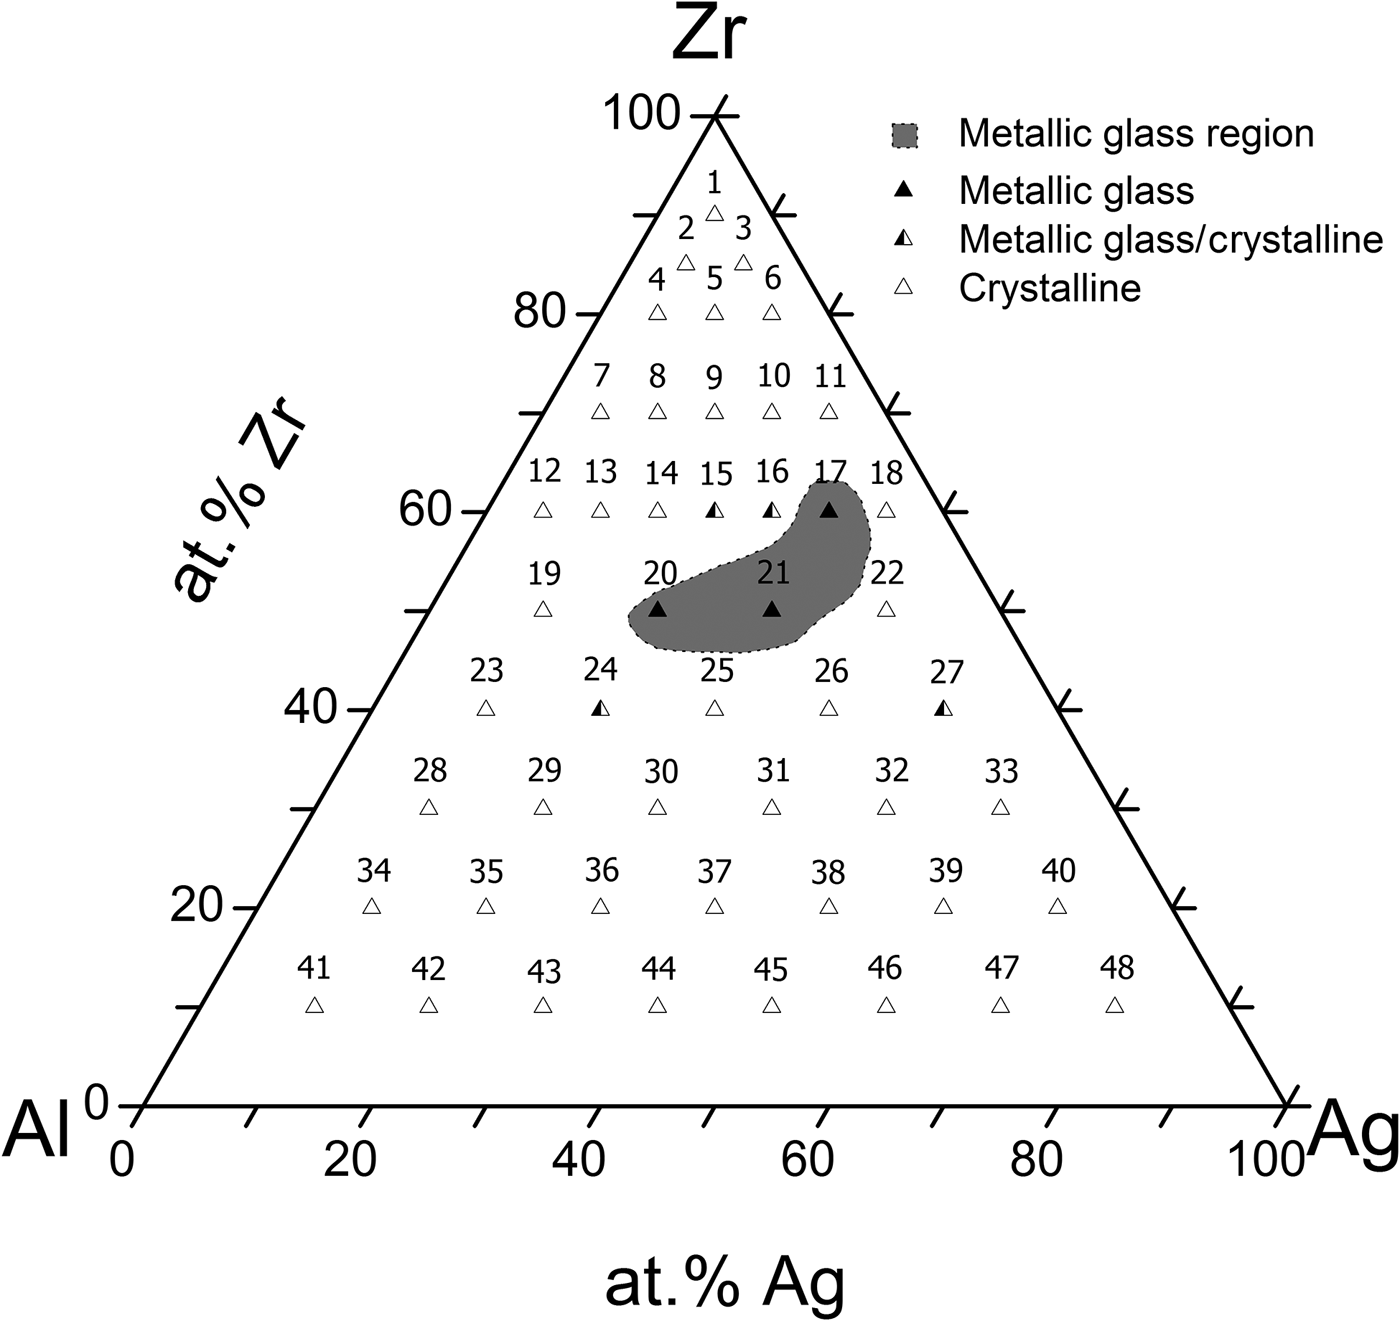
Forty-eight Ag–Al–Zr ternary alloys for the metallic glass region determination were prepared using Zr (Alfa Aesar, Ward Hill, Massachusetts), Ag (Alfa Aesar), and Al (Alfa Aesar) shots with over 99.9 wt% purity. Each alloy specimen weighed 3.000 ± 0.001 g. The detailed composition is shown in Fig. 1. The corresponding amounts of pure elements were weighed and placed in a Cu crucible in a commercial arc melting furnace (Miller Gold Star 602, Miller Electric, Appleton, Wisconsin). The argon gas was purged into the arc melting chamber to reduce the possible oxidation of the alloy. The three elements were melted together to form a button-shaped Ag–Al–Zr alloy. This button-shaped alloy was flipped in the arc melting furnace and re-melted more than five times to ensure all elements were mixed homogeneously in the molten state. The well-mixed alloy was then taken from the arc melting furnace with the self-made copper cushion attached to the top of a copper mold with a hollow channel to form alloy ingots with 2, 3, and 4 mm diameter. To maintain a rapid cooling rate of the Ag–Al–Zr alloys, the copper mold was immersed in liquid nitrogen for 10 min before the attachment to the arc melting furnace. A vacuum pump was attached to the copper mold, so that the molten metallic solution could be filled in the copper mold smoothly during the arc melting process.
Distribution of alloy numbers, metallic glass, and crystalline regions in the Ag–Al–Zr ternary system.

After cooling, the alloy ingot was removed from the Cu mold and cut into the pieces of 3-mm diameter for further analyses. The alloy specimen was analyzed by metallography and x-ray diffraction. The microstructures were examined using an optical microscope (OM, Olympus BX-51M, Olympus Corporation, Tokyo, Japan), followed by scanning electron microscope (SEM, Hitachi TM-1000, Japan). SEM with an energy x-ray dispersive spectrometer (EDS, Bruker Quantax 70, Bruker Corp., Karlsruhe, Germany) was used to determine the precipitation phase compositions. The alloy sample was also analyzed with an x-ray diffractometer (XRD, Bruker D2 Phaser, Karlsruhe, Germany) and its diffraction pattern was obtained. The phases could be identified from the XRD patterns by comparing with data provided by JCPDS (Joint Committee of Powder Diffraction Standard). Differential scanning calorimetry (DSC, TA Instruments DSC 2010, New Castle, Delaware) and differential thermal analyzer (DTA, Rigaku Thermo plus TG8120, Tokyo, Japan) at a heating rate of 10 K/min were used to measure the glass transition temperature, liquidus temperature, crystallization temperature, and thermal stability of the alloy. High-resolution transmission electron microscopy (HR-TEM, Philips Technai F20 G2 FEI-TEM, Amsterdam, the Netherlands) was employed to obtain the structural information to determine the presence of crystalline or amorphous properties of these alloys.
Phase equilibria of the Ag–Al–Zr ternary system
Sixteen Ag–Al–Zr alloys were prepared for phase equilibrium experiments using Ag, Al, and Zr shots. Each alloy specimen weighed 2.000 ± 0.001 g. The preparation method for the phase equilibrium alloys was similar to those mentioned in Section 2.1. After the preparation of the arc melting furnace, the button-shaped alloy was encapsulated in a quartz tube in at 0.1 N/m2 vacuum. Those sealed tubes were placed in a furnace (Lindberg, Blue M, USA) at 773 K (500 °C) for 1440 h to ensure that these alloys reached the equilibrium state. Hereafter, sample tubes were removed from the furnace and quenched immediately in iced water.
The alloy ingot was taken from the quartz tube and cut into two parts. One half of the alloy specimen was used for metallographic analysis by OM and SEM to observe the microstructures, followed by the crystalline analysis by SEM with EDS to obtain element compositions; another half one was pulverized and analyzed with an XRD. The phases formed in the alloys were identified by comparing with the JCPDS’ database. The obtained information of microstructures, compositions, and diffraction patterns was examined and cross-compared to identify the stable phases existed in each equilibrated alloy.
Results and discussion
Crystallography of the Ag–Al–Zr ternary system
Metallic glass regions
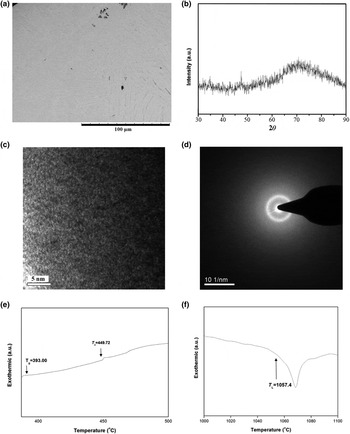
Figure 2(a) shows the backscattered electron image (BEI) micrograph of alloy #17 (Zr–10 at.% Al–30 at.% Ag), presenting a single phase without any precipitation phases. The XRD pattern of alloy #17 is presented in Fig. 2(b), where no obvious sharp peaks were observed. Before preparing the alloy ingot, the pure copper mold was immersed in liquid nitrogen. The molten liquid alloy quickly contracted in the Cu mold and rapidly solidified under a great temperature gradient.
(a) BEI micrographs, (b) XRD pattern, (c) TEM image, (d) SAED pattern of the dendrite structure, (e) DSC curve, and (f) DTA curve of alloy #17 (Zr–10 at.% Al–30 at.% Ag).

HR-TEM was applied to analyze the crystalline property of the central region of alloy #17 to delineate its structural properties. Figure 2(c) shows a TEM image of the amorphous state in alloy #17. The selected area electron diffraction (SAED) pattern for the metallic region is also shown in Fig. 2(d). Only a ring was observed in the SAED pattern indicating that alloy #17 might contain an amorphous structure. Based on the XRD, DSC, and TEM analytical results, alloy #17 can be considered to be metallic glass.
The DSC curve of alloy #17 is shown in Fig. 2(e). The endothermic shift and slope of the curve changed at 666 K (393 °C) and 722.87 K (449.72 °C) as determined by the DSC software (TA Universal Analysis 2000). These two temperatures should be the glass transition temperature (T g) and crystallization temperature (T x), respectively. The liquidus temperature (T l) of alloy #17 is 1330 K (1057.4 °C), which was determined by DTA and shown in Fig. 2(f). Similar results of metallic glass regions were discovered in alloys #20 and #21 as well. The thermal properties of these alloys, such as the glass transition temperature (T g), crystallization temperature (T x ), liquidus temperature (T l), and supercooled liquid region ΔT x ( = T x − T g), are presented in Table I. The T rg (reduced glass transition temperature, which equals to T g/T l) and γ value [equals to T x/(T g + T l)], of these three alloys are listed in Table I that aided in the evaluation of the GFA of Ag–Al–Zr alloys. Based on two of three empirical rules,( Reference Inoue 5 ) the system consisted of three components, and the difference in atomic size ratio of Ag/Al was up to 22%. Furthermore, the larger values of ΔT x 1,5, T rg 6,7, and γ 7,9 were easier for the formation of metallic glasses. Therefore, alloys #20 (Ag20Al30Zr50) and #21 (Ag30Al20Zr50) are supposed to have the best GFA in the Ag–Al–Zr ternary system.
Estimated GFA parameters referred to thermal analysis results.

Metallic glass/crystalline regions
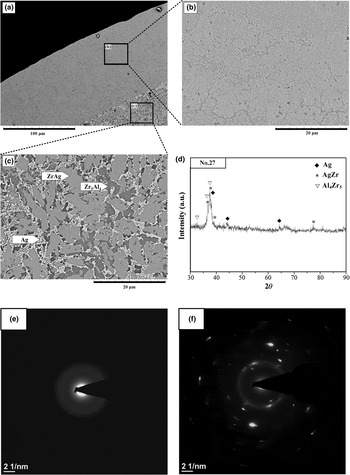
Figure 3(a) shows the BEI microstructure image of alloy #27 that has a composition of Zr-10 at.% Al-50 at.% Ag. Alloy #27 showed two different microstructures. In the skirt part of alloy #27 [Fig. 3(b)], no precipitation phase was found, and this is likely to be a single phase. However, there were three different contrast regions observed in the central part of alloy #27, as shown in Fig. 3(c). By electron probe x-ray microanalyzer (EPMA; JEOL JXA-8200; JEOL, Ltd., Tokyo, Japan) EPMA's analysis for alloy #27, the compositions were found as Zr–3.1 at.% Al–95.3 at.% Ag (bright), Zr–6.8 at.% Al–46.7 at.% Ag (gray), and Zr–48.7 at.% Al–3.4 at.% Ag (dark). They would be identified as the Ag, AgZr, and Al4Zr5 phases.( Reference Karakaya and Thompson 13 , Reference Murray, Peruzzi and Abriata 14 ) Figure 3(d), which is the XRD result of alloy #27, also confirms the existence of the Ag, AgZr, and Al4Zr5 phases. Figures 3(e) and 3(f) show the SAED pattern for the outer and central parts of alloy #27. The typical amorphous ring pattern is shown in Fig. 3(e). Ring and spot patterns shown in Fig. 3(f) indicate that the central region might be a crystallized amorphous phase or a crystalline phase with very fine grains. The result of SAED is consistent with the one of XRD. Both SAED and XRD can explain why broad and characteristic peaks appear in the x-ray diffraction pattern, as shown in Fig. 3(d). Alloys #15, #16, and #24 are examined by the same method and their results are similar. Alloys #15, #16, #24, and #27 were presented in metallic glass/crystalline regions.
BEI micrographs of (a) skirts part, (b) and (c) were a partial enlarged image of alloy #27 (Zr–10 at.% Al–50 at.% Ag); (d) XRD pattern, and SAED pattern for (e) outside and (f) center parts of alloy #27.

Crystalline regions
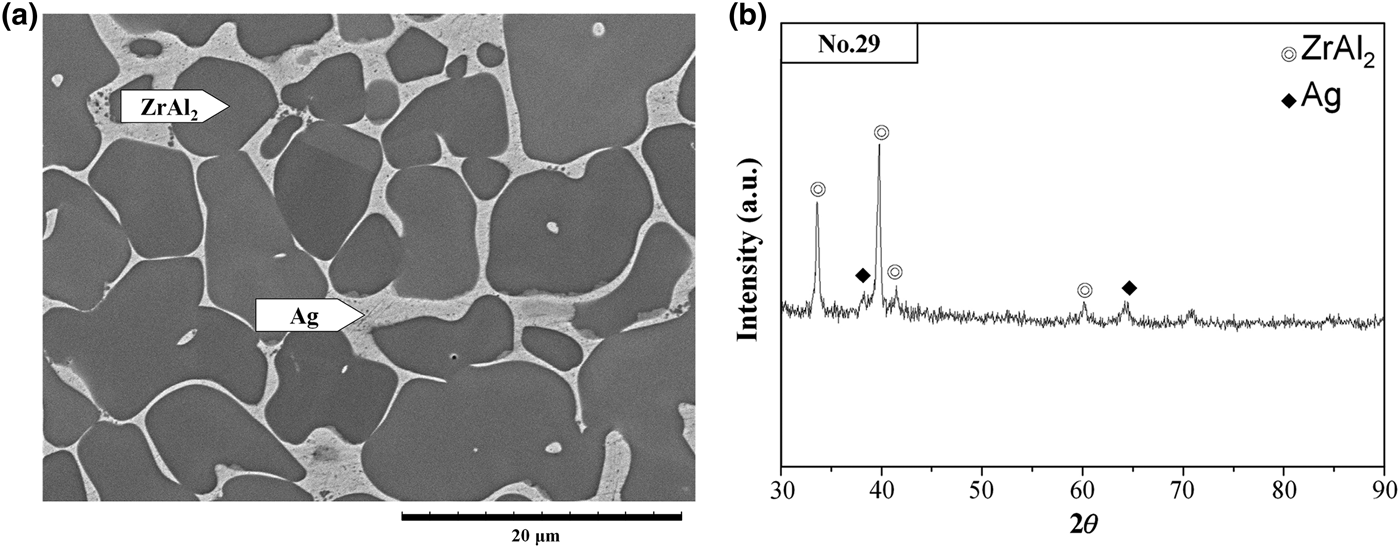
Figures 4(a) and 4(b) show BEI micrograph and XRD pattern of alloy #29 (Zr-50 at.% Al-20 at.% Ag), respectively. Two different contrast regions were observed in Fig. 4(a). According to the XRD pattern of alloy #29, two phases, Ag and Al2Zr phases, were observed in Fig. 4(b). The compositional analysis based on EPMA and XRD indicated the presence of a micro-island-shaped region with a dark color at Zr–1.4 at.% Al–97.4 at.% Ag, which should be the Ag phase.( Reference McAlister 12 ) The composition of the matrix with a bright color is Zr–63.7 at.% Al–4.5 at.% Ag. The phase in this region would likely to be Al2Zr.( Reference Murray, Peruzzi and Abriata 14 ) No amorphous phase was found in alloy #29 using the copper casting method and it had only a crystalline structure. Similar results were obtained for other alloys except for #15, #16, #17, #20, #21, #24, and #27 among the 48 samples. These Ag–Al–Zr alloys showed their crystalline structure, thus they are marked in a crystalline region.
(a) BEI micrograph and (b) XRD pattern of alloy #29 (Zr–50 at.% Al–20 at.% Ag).

In this study, 48 Ag–Al–Zr ternary alloys were prepared and analyzed using the same methods. All alloys formed by the copper mold method are examined and results are presented schematically in Fig. 1. The three different outcomes, viz., metallic glass, metallic glass/crystalline, and crystalline, can be distinguished by XRD and DSC in the Ag–Al–Zr system also shown in Fig. 1. The metallic glass range in the Ag–Al–Zr ternary system is in the composition ranges of Ag20–30Al10–30Zr50–60.
Phase equilibria of the Ag–Al–Zr ternary system at 773 K (500 °C)
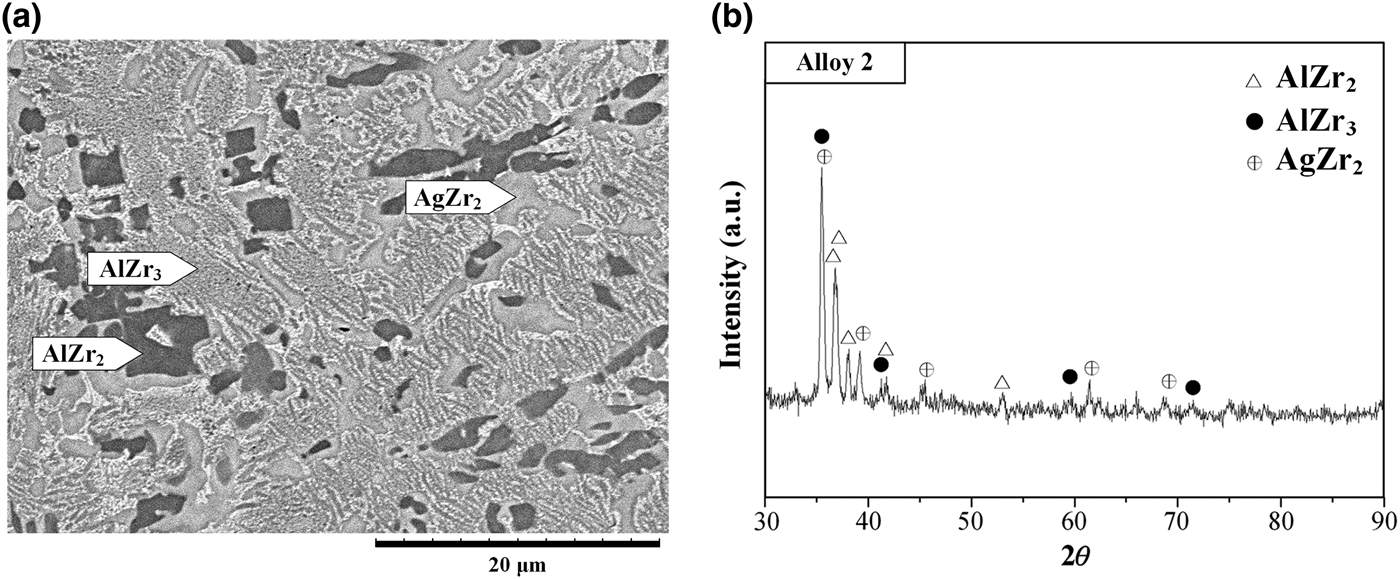
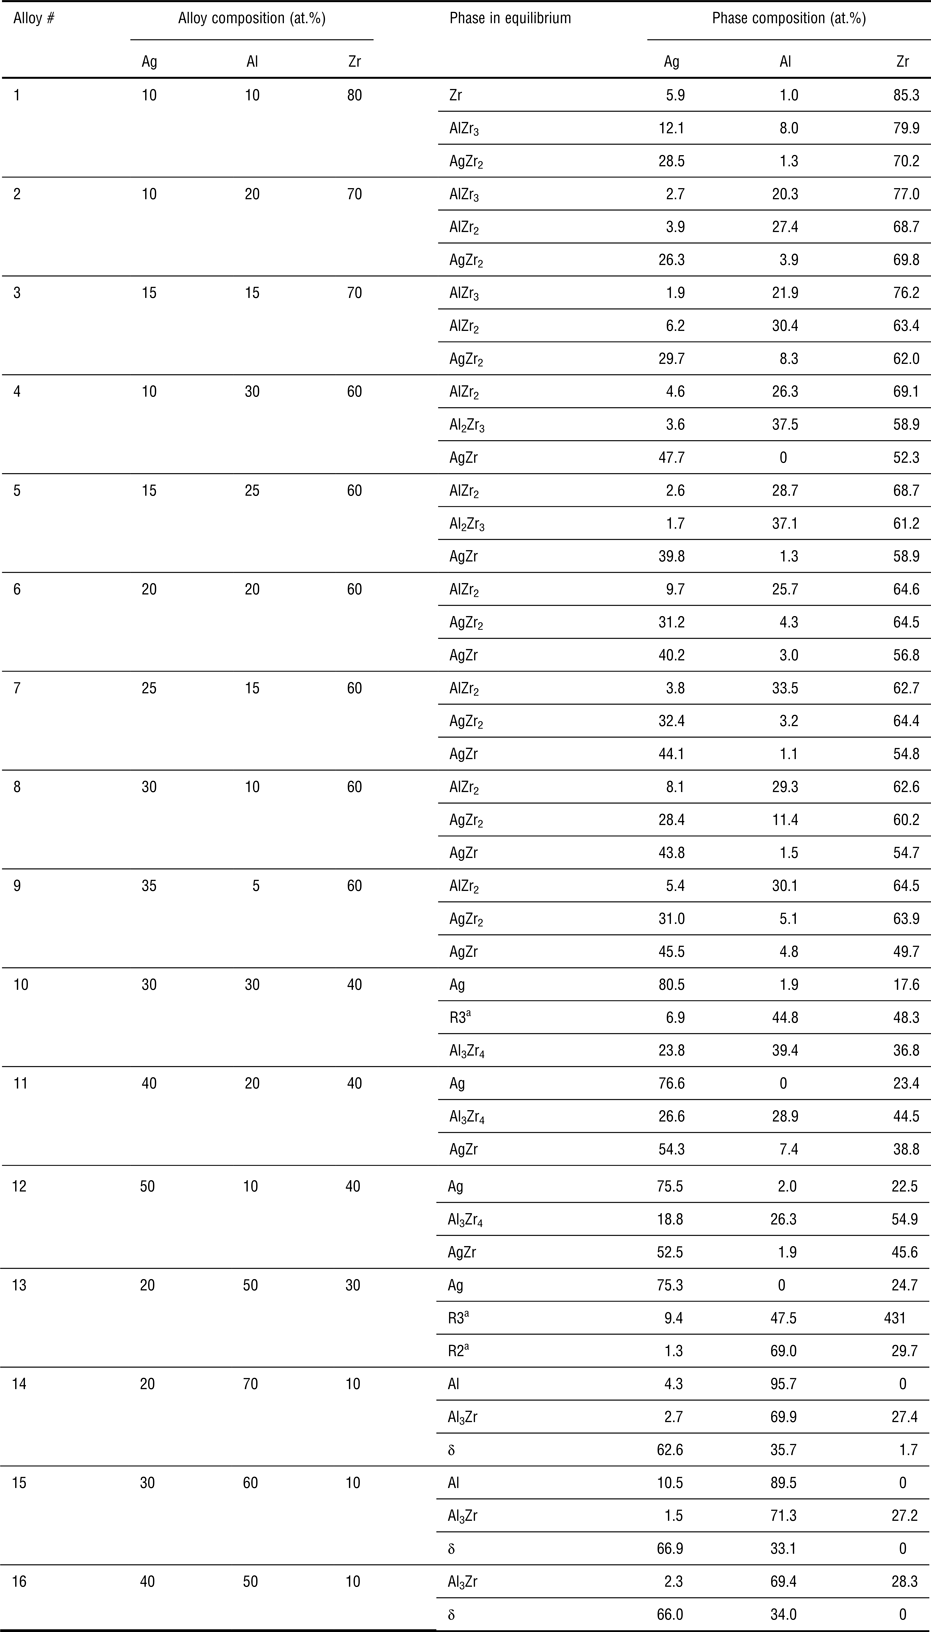
Sixteen Ag–Al–Zr alloys with different compositions were prepared and analyzed. Table II lists their nominal compositions and corresponding equilibrium phases. These alloys were aged at 773 K (500 °C) for 1440 h. The BEI micrograph of alloy #2 (Zr–20 at.% Al–10 at.% Ag) is shown in Fig. 5(a), which present three different contrast regions. The EPMA and EDS analyses indicated the compositions of dark, light gray, and gray regions to be Zr–27.4 at.% Al–3.9 at.% Ag, Zr–3.9 at.% Al–26.3 at.% Ag, and Zr–20.3 at.% Al–2.7 at.% Ag, respectively. There should be AlZr2, AgZr2, and AlZr3 phases with a scant solubility of a third element.( Reference Karakaya and Thompson 13 , Reference Murray, Peruzzi and Abriata 14 ) According to the XRD pattern of alloy #2, three phase peaks, AlZr2, AgZr2, and AlZr3, were observed and shown in Fig. 5(b).( 17 ) The EPMA and EDS analysis results for phase compositions are consistent. Therefore, a three-phase tie triangle of AgZr2, AlZr3, and AlZr2 phases exists in alloy #2. There are also similar results in alloy #3, where a tie triangle of AgZr2, AlZr3, and AlZr2 phases exists. These results are listed in Table II.
(a) BEI micrograph and (b) XRD pattern of alloy #2 (Zr–20 at.% Al–10 at.% Ag).

Phase equilibria of the Ag–Al–Zr ternary system at 773 K (500 °C).
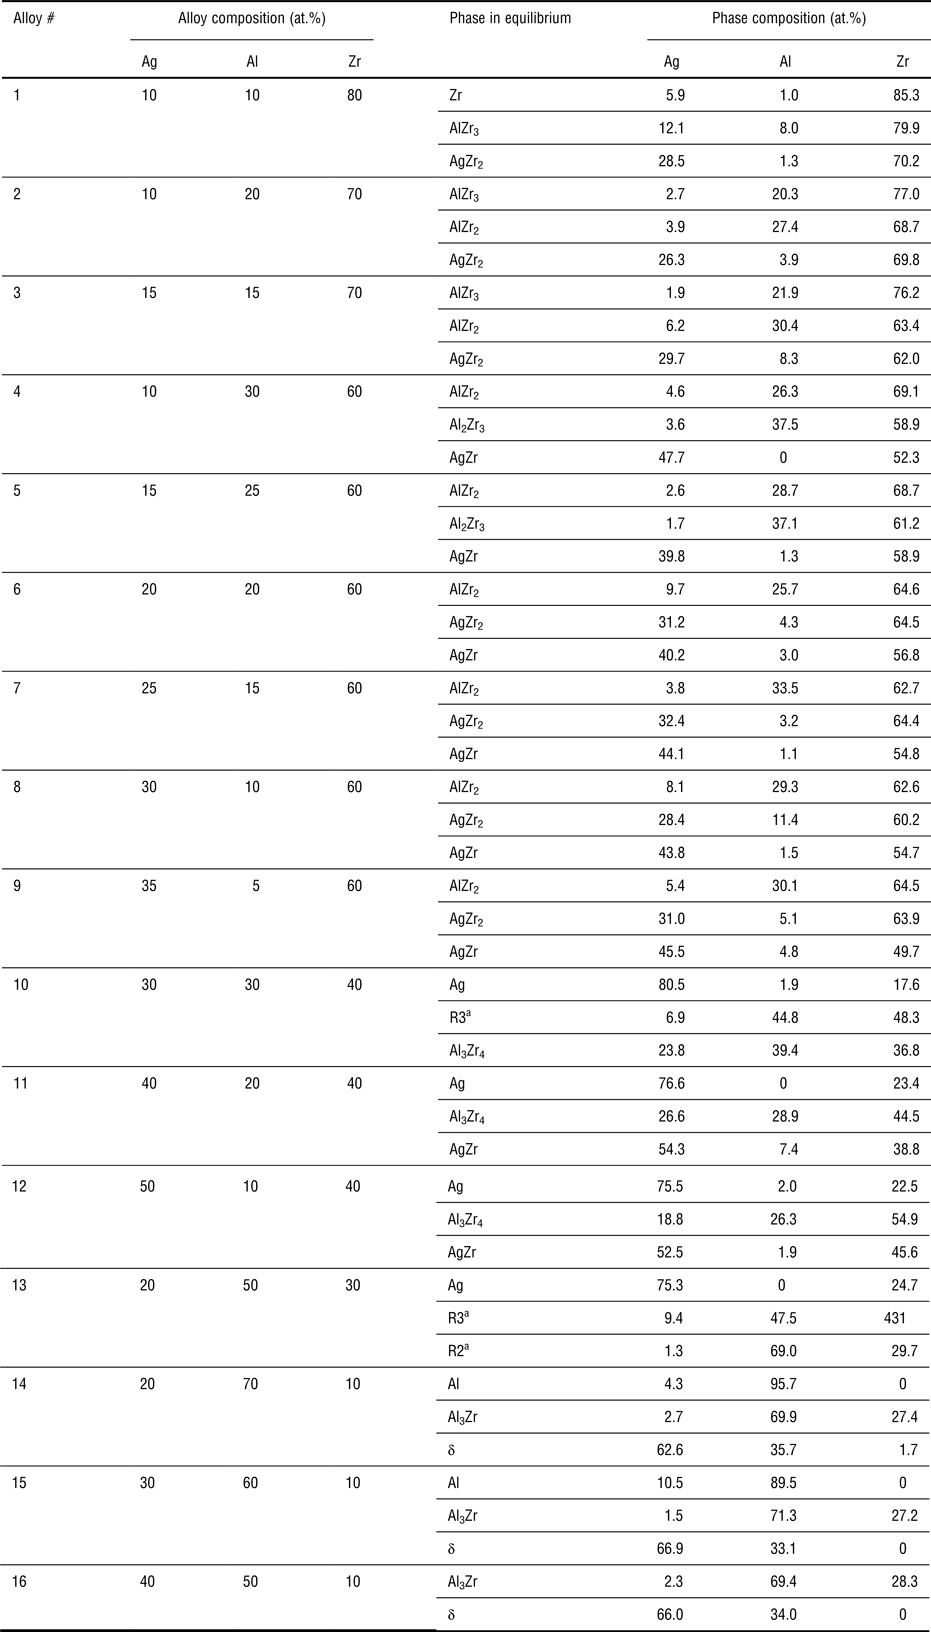
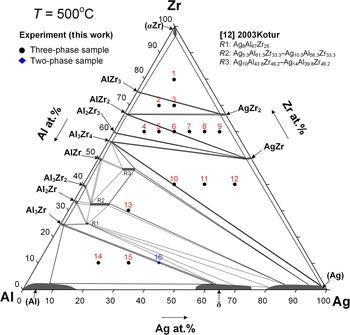
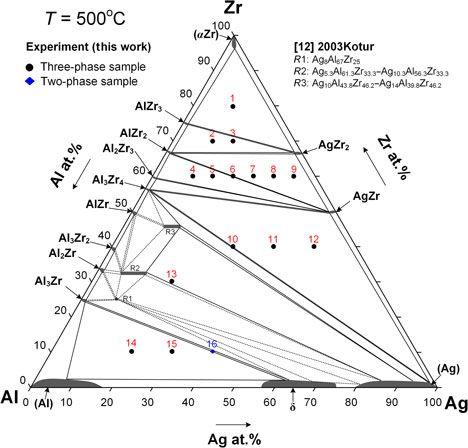
a Compositions for R1, R2, and R3 are determined in( Reference Kotur and Verbovytsky 16 ) (2003Kotur) as: R1 (Ag8Al67Zr25), R2 (Ag5.3Al61.3Zr33.3–Ag10.3Al56.3Zr33.3), and R3 (Ag10Al43.8Zr46.2–Ag14Al39.8Zr46.2).
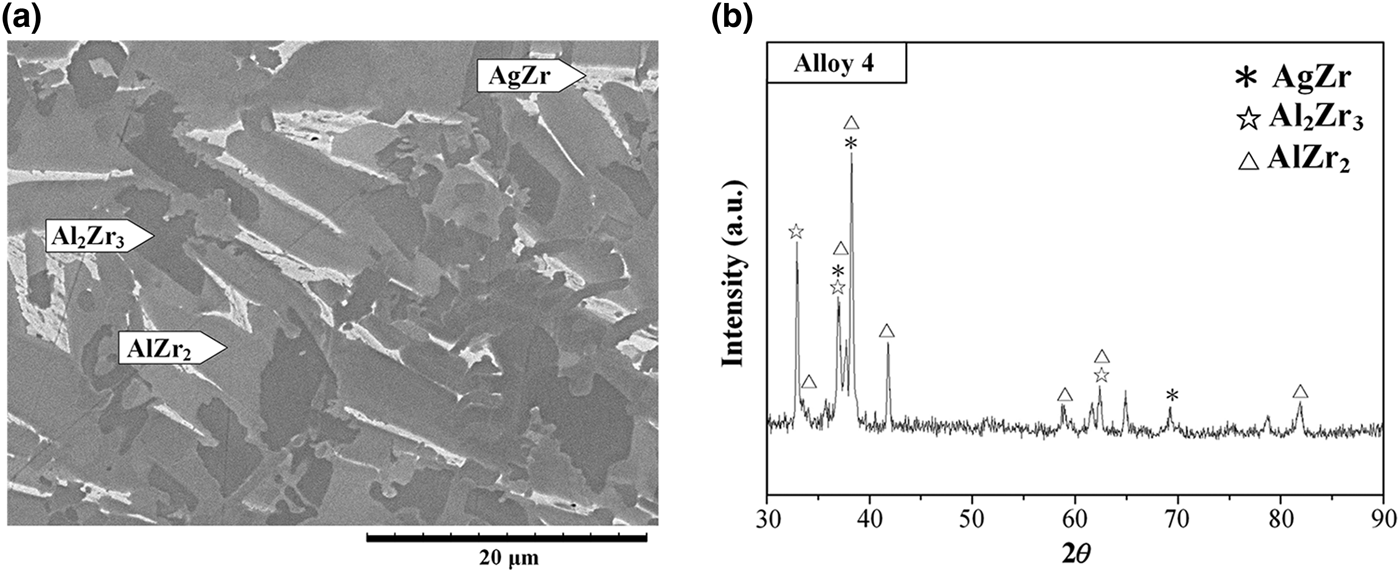
Similar to alloy #2, three different contrast regions are found in alloy #4 (Zr–30 at.% Al–10 at.% Ag) as shown in Fig. 6(a). Their compositions are Zr–47.7 at.% Ag (bright), Zr–26.3 at.% Al–4.6 at.% Ag (gray), and Zr–37.5 at.% Al–3.6 at.% Ag (dark). They are likely to be the AgZr, AlZr2, and Al2Zr3 phases, respectively.( Reference Karakaya and Thompson 13 , Reference Murray, Peruzzi and Abriata 14 ) The AgZr, AlZr2, and Al2Zr3 phases are also determined by the x-ray diffraction results, as shown in Fig. 6(b). A similar result was observed for alloy #5 composed of AgZr + AlZr2 + Al2Zr3 tie triangle region among these alloys at 773 K (500 °C).
(a) BEI micrograph and (b) XRD pattern of alloy #4 (Zr–30 at.% Al–10 at.% Ag).

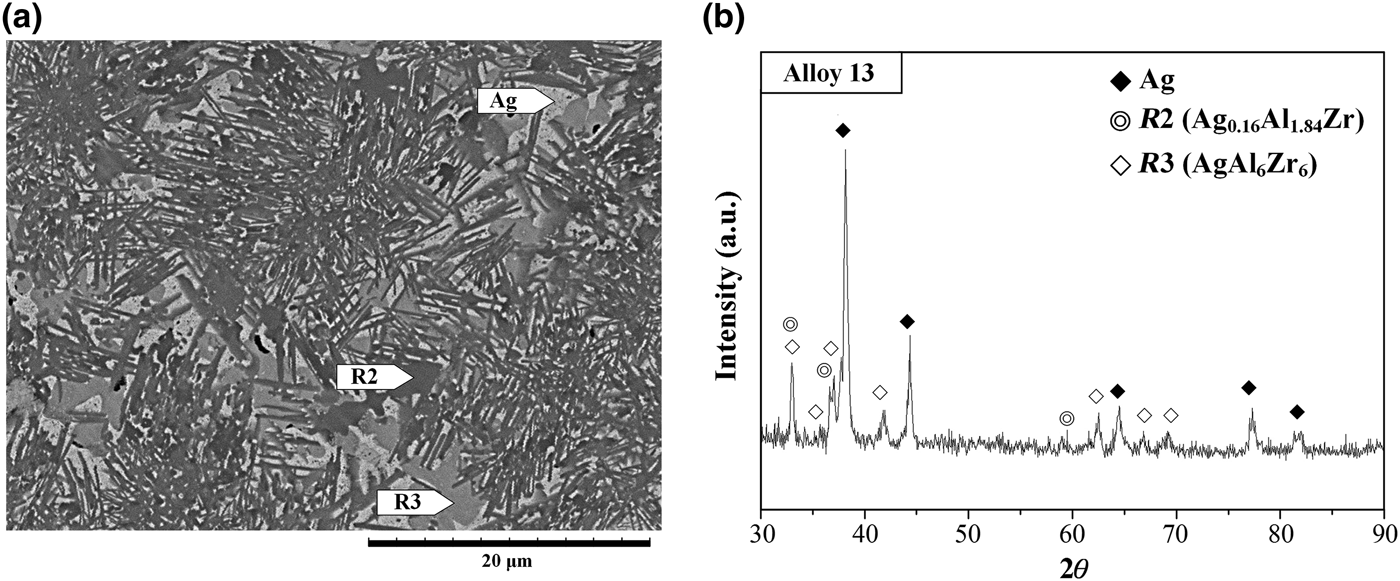
The compositions of alloy #13 (Zr–50 at.% Al–20 at.% Ag) were determined by SEM as three-phase regions. The compositions of these phases as determined by EDS are Zr–75.3 at.% Ag (bright), Zr–47.5 at.% Al–9.4 at.% Ag (gray), and Zr–69 at.% Al–1.3 at.% Ag (dark), as shown in Fig. 7(a). Kotur and Verbovytsky( Reference Kotur and Verbovytsky 16 ) investigated the Zr–Ag–Al ternary system at 500 °C and determined three intermetallic compounds, ZrAg0.32Al2.68, ZrAg0.16–0.31Al1.84–1.69 and Zr6Ag1.30–1.82Al5.70–5.18. However, before Kotur and Verbovytsky's( Reference Kotur and Verbovytsky 16 ) results, Rieger et al.( Reference Rieger, Nowotny and Benesovsky 15 ) had already determined Zr3Ag2Al as the stable ternary phases at 850 or 1100 °C. But the temperature in the work of Rieger et al.( Reference Rieger, Nowotny and Benesovsky 15 ) was not certain and the Zr3Ag2Al phase was found neither in this work nor in that of Kotur and Verbovytsky.( Reference Kotur and Verbovytsky 16 ) According to the XRD analysis and database comparison, the XRD peaks were found to be R2, R3, and Ag phases [as shown in Fig. 7(b)], being in accordance with the earlier report.( Reference Kotur and Verbovytsky 16 )
(a) BEI micrograph and (b) XRD pattern of alloy #13 (Zr–50 at.% Al–20 at.% Ag).

The equilibrium phases found in the equilibrated ternary alloys of the Ag–Al–Zr system at 773 K (500 °C) were determined experimentally and summarized in Table II. According to the experiments for these 16 equilibrated alloys and comparison with related binary systems (Ag–Zr, Al–Zr, and Ag–Al systems), the isothermal section of the Ag–Al–Zr ternary system at 773 K (500 °C), as shown in Fig. 8, was proposed and two ternary intermetallic phases, R2 and R3, were determined as well.
Isothermal section of the Ag–Al–Zr ternary system at 773 K (500 °C).

Conclusions
The metallic glass and crystalline regions in the Ag–Al–Zr ternary system were determined by the copper mold method. The metallic glass region in the Ag–Al–Zr ternary system is Ag20–30Al10–30Zr50–60. Alloys #20 (Ag20Al30Zr50) and #21 (Ag30Al20Zr50) are supposed to have the best GFA in the Ag–Al–Zr ternary system. The isothermal section of the Ag–Al–Zr ternary system at 500 °C was established experimentally. Two ternary intermetallic phases were determined and consistent well with the results of earlier studies.
Acknowledgments
The authors acknowledge the financial support from the National Science Council of Taiwan, Republic of China (Grant No. NSC 102-2221-E-011-024) and the Ministry of Education (MoE) Top University Projects – 100H451401. The authors are also thankful for the help from Mr. S.C. Laiw and Ms. Y.Y. Wu for FE-SEM and HR-TEM operation and analysis.