


Introduction
Connections between glacier hydrology and glacier dynamics have been a focus of research for decades. Spring speedup events have represented a testing ground for our understanding of the relationship between glacier sliding and water pressure (Reference Hooke, Calla, Holmlund, Nilsson and StroevenHooke and others, 1989; Reference JanssonJansson, 1995; Reference Iken and TrufferIken and Truffer, 1997; Reference GudmundssonGudmundsson, 2002; Reference Harper, Humphrey and GreenwoodHarper and others, 2002; Reference Mair, Nienow, Sharp, Wohlleben and WillisMair and others, 2002). Glacier surges have been attributed to disruption or instability of the subglacial drainage system in one manner or another (e.g. Reference KambKamb and others, 1985), and probably represent an extreme example of the sensitive coupling between glacier sliding and basal hydrology. Here we use the subglacial drainage of Hidden Creek Lake (HCL), dammed by Kennicott Glacier, Alaska, USA (Fig. 1), to probe the relationship between glacier sliding and glacier hydrology. HCL drains annually over a period of 2–3 days, producing a flood in the Kennicott River, the glacier outlet stream (Reference Rickman and RosenkransRickman and Rosenkrans, 1997). We review evidence constraining the nature and timing of the hydrologic perturbation in the 2000 flood. We then document the dynamic response of the glacier in both its horizontal and vertical movement and can interpret this in light of a simple model of the subglacial hydrology–sliding system.
Top: map of Kennicott Glacier and its position in the Wrangell–St Elias National Park of Alaska. Side-glacier lakes ponded by Kennicott Glacier are noted. HCL drains annually through the glacier to the terminus. Bottom: detail of boxed area in top map, showing the survey station and set of markers tracked over the course of the 2000 field campaign. Outline of area of HCL in proximity to the ice dam is shown by shading. Of particular interest are the two markers BL1 and MLN, roughly 1.2 km onto the glacier from HCL. Motion depicted by arrows is almost entirely north–south. Locations of boreholes (BH) are marked by the crosses. Total station was located at site marked by the triangle, placed on the small knob to which D. Trabant was chained for roughly 1 month in summer 2000.

Methods
Four types of measurement were undertaken as part of our investigation: surveys of markers on the ice surface, as well as measurement of water discharge and water chemistry in the Kennicott River, and of lake level in Donoho Falls Lake (henceforth DFL; Fig. 1). The last three datasets have been presented in detail elsewhere (Reference AndersonAnderson and others, 2003a, Reference Anderson, Longacre and Kraalb).
Primary among these data for documenting the glacial response to the flood are repeat surveys of an array of targets positioned to document the response of the glacier to the filling and emptying of HCL (Fig. 1; see also Reference WalderWalder and others, 2005). Surveys were conducted using total station measurements of vertical and horizontal angles, and distance as determined by a laser range finder. Most targets were located on the ‘ice dam’, the part of the glacier that intrudes up the valley of Hidden Creek, but two targets (BL1 and MLN) were located 1.2 km from the lake margin. As this is ∼25% of the width of Kennicott Glacier in this reach, we expect that the motion of BL1 and MLN is representative of the glacier in this reach. The target array was surveyed typically 4–6 times per day, from day 186 through day 210. HCL reached peak stage on day 206.7 and drained by day 210. The probable error in survey measurements after correction for refraction is about 10 mm; for comparison, total displacement of the targets was several meters.
Water discharge and chemistry were measured at the pedestrian bridge across the Kennicott River, ∼500m from the glacier terminus (Reference AndersonAnderson and others, 2003a). Discharge was measured using US Geological Survey protocol to establish a relationship between stage and discharge. Stage was measured at 15 min intervals using a sonic ranger sensor attached to the bridge. Water chemistry samples were collected at least twice daily.
The level of DFL (Fig. 1) was measured using a pressure transducer placed 50 m above the bottom of the basin. We also measured temperature with sensors placed in the bottom of the dry lake basin, below the level at which the pressure transducer could be placed. As water temperature was steady and close to 0˚C, but air temperature was not, we could infer whenever the temperature sensors became submerged.
Results
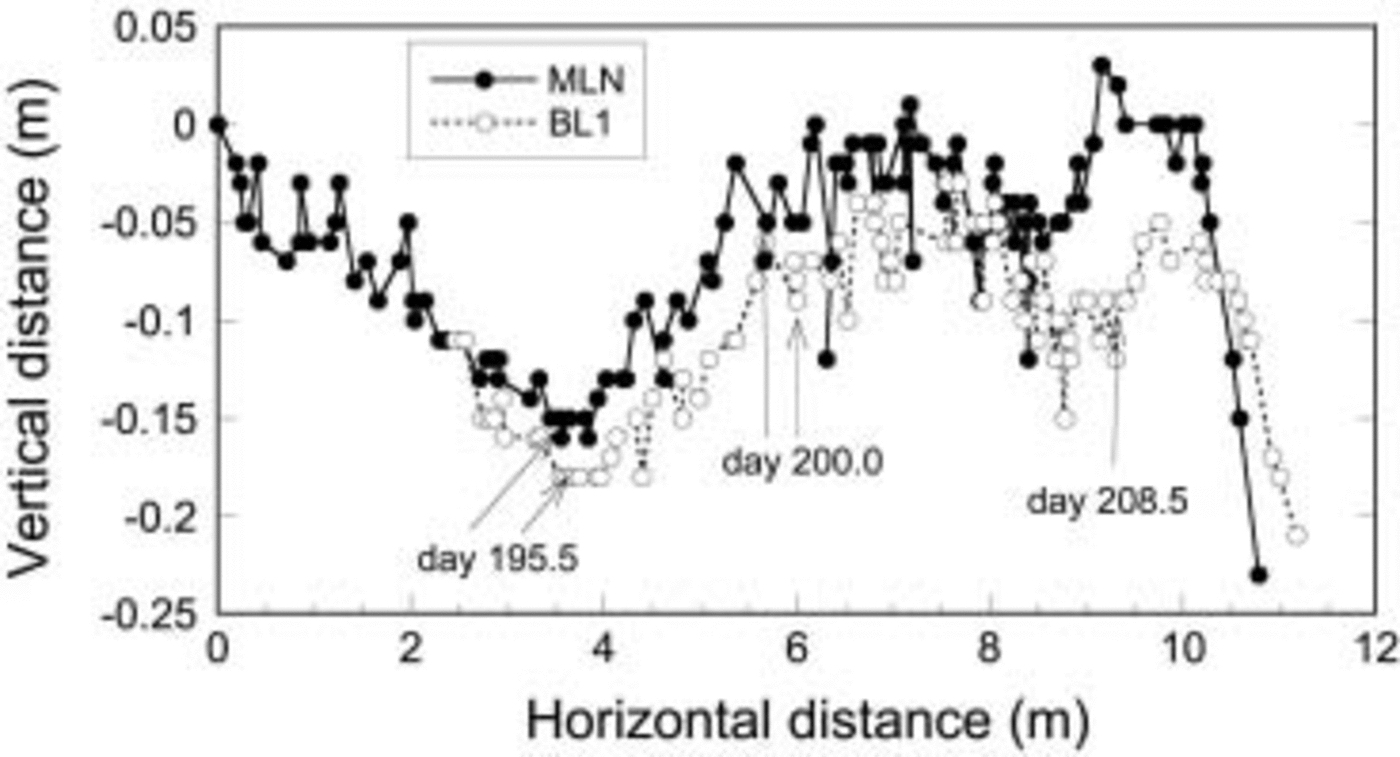
Figure 2 shows the trajectories of targets MLN and BL1, projected into a vertical plane. Although horizontal motion was nearly due south, we report the full vector magnitude of the horizontal displacement in each measurement epoch. The direction of motion in plan view was steady until about day 208.6, after which a slight shift to the west occurred (Fig. 3). The steady downward drift prior to day 195.5 is interrupted by abrupt shift to upward vertical motion, or uplift, of the ice surface from day 196 through day 200. The ice surface then again declines in elevation before a second pulse of uplift that coincides with HCL drainage. Finally, the ice surface abruptly declines in elevation, and is doing so as the record terminates.
Plan view of target trajectories. For ease of comparison, BL1 easting is reduced by 35 m, northing reduced by 205 m. Days of some measurements are indicated. Note the significant change in direction upon speed-up.

In Figure 4a we show the vertical motion after removing the mean downward drift of the targets, determined in the period prior to day 195.5. We call this ‘bed separation’, an interpretation we will defend in the next section. For both targets, the mean downward drift removed from the distance series was a linear trend with slope 0.039. This is slightly more than the 0.03 slope of the glacier surface in this reach; the additional downward drift likely reflects melting of the ice surface, which was snow-free over the measurement period.
(a) Time series of vertical motion after removal of mean downward drift due to surface melt and bed-parallel motion, determined for the period prior to day 195.5. (b) Time series of surface speed at two targets.

We calculated the ice surface speed by interpolating horizontal displacement at an interval of 0.25 days and differentiating the resulting time series (Fig. 4b). Target speeds were moderate, with a mean value of about 0.4 md–1, until day 206. There was a period of generally increasing speed at both targets, from roughly 0.5 md–1 to 0.7md–1, from day 196 to day 200. During this first subtle speed-up, apparent bed separation increased to about 0.25 m (Fig. 4a). The upward slope of the ice surface trajectory during this event, as measured from the slope of Figure 2, is 0.06.
A second speed-up started on day 208, about 2 days after HCL began to drain, with speed reaching 1.2md–1. The second speed-up lasted for 1.5–2 days before declining rapidly. This speed-up was accompanied by an increase in apparent bed separation of about 0.08–0.12m (Fig. 4a). The upward slope of the target trajectory is again about 0.06 during the second pulse of rapid motion from day 208.5 to day 210 (Fig. 2).
Trajectories of two targets on ice surface, showing significant departures from mean bed-parallel motion. The MLN record begins 6 days prior to BL1. The vertical coordinate of BL1 has been adjusted so that the two records coincide at the time of first measurement of BL1. Both targets begin to rise on day 195.5.
We now compare the timing of changes in apparent bed separation with other events (Fig. 5). The start of the second increase in apparent bed separation, which occurred as HCL drained, coincided closely with initiation of filling of the previously empty basin of Donoho Falls Lake (DFL), which lies halfway between HCL and the terminus (Fig. 5a). Furthermore, both periods of ice surface uplift, days 196–200 and 208–210, coincide with low chloride (and other solute) concentrations in the Kennicott River (Fig. 5b). Anderson and others (Reference Anderson2003a, Reference Anderson, Longacre and Kraalb) argue that low solute concentrations in the Kennicott River reflect decreased drainage of solute-rich subglacial distributed-system water during periods of high subglacial water pressures. Although all these records point to high water pressure during the speed-up and uplift of the ice surface during the outburst flood, one record appears to contradict this. The water level in BH7, a borehole near target BL1, fell during drainage of HCL (Fig. 5a). As this borehole did not reach the glacier bed, however, the water level does not tell us anything directly about water pressure locally at the glacier bed. Two other boreholes in the ice dam also fell in water level, in those cases directly tracking drainage of HCL (Reference AndersonAnderson and others, 2003a).
Comparison of other records with vertical displacement time series at MLN. (a) Time series of outflow discharge and water surface elevation from HCL, water depth in DFL and water level in borehole 7. (b) Records of Cl concentration in Kennicott River water and the drift-corrected vertical displacement record at MLN (from Fig. 4a). Shading highlights intervals when ice surface at MLN is rising.

Discussion
The general trend of target movement for the first few days of the record (Fig. 2) represents motion parallel to the mean bed slope, and melt of the ice surface on which the targets rest. Bed-parallel motion of the ice surface reflects basal ice processes of enhanced ice deformation and regelation sliding over small-scale bumps in the bed (Reference PatersonPaterson, 1994). We have tentatively interpreted measured vertical uplift after this bed-parallel motion is removed (Fig. 4a) as indicative of bed separation caused by sliding of the glacier over large-scale bumps on the bed (cf. Reference AndersonAnderson and others, 2004). As we have insufficient coverage of the glacier surface with displacement markers to allow assessment of the longitudinal horizontal strain rate, we cannot assess the degree to which the vertical signal reflects thickening or thinning due to longitudinal velocity gradients in the glacier. We note, however, that Reference GudmundssonGudmundsson (2002) found, using a borehole strainmeter, that only about 20% of the decimeter-scale vertical uplift at Unteraargletscher, Switzerland, was attributable to vertical strain. We believe that our assumption of no vertical strain is not grossly misleading.
That BL1 and MLN display similar signals when the bed-parallel motion trend is removed indicates that, whatever is causing their motion, the two targets are behaving coherently. These targets are roughly 300 m apart, which is slightly less than one ice thickness in this region (Reference AndersonAnderson and others, 2003a). As longitudinal coupling is thought to extend over distances much greater than one ice thickness (Reference Kamb and EchelmeyerKamb and Echelmeyer, 1986), it is not surprising that targets BL1 and MLN show similar motion histories.
We argue that the dilation of subglacial sediment upon shear deformation cannot explain the uplift signal, for several reasons. First, the total uplift is quite large. Given the small incremental change in volume one might expect upon shear of subglacial sediments, it would require a very thick sediment cover to accomplish the 0.3–0.4m of uplift. It is also worth noting that the degree of dilation of such materials upon shear depends upon their initial porosity; it can even be of the wrong sign, i.e. deflation upon shear (personal communication from N. Iverson, 2004). The monotonic increase of uplift (what we call bed separation) during the period of rapid horizontal motion would require just the right rate of addition of water into the till to allow its inflation to match the observed rate of uplift. Finally, the rapid rate of drop of the ice surface, beginning on day 207, is inconsistent with deformation of subglacial sediments. The time-scale, T, for dewatering of subglacial sediment will be controlled by the length scale, L, and the hydraulic diffusivity, κ, of the material, T = L 2/κ. If L is one to several meters, as required by the need for significant uplift, and κ is 10–6m2 s–1 (personal communication from N. Iverson, 2004), the characteristic time will be order tens of days. In contrast, the time-scale for return to bed-parallel motion is 1 day.
We see two episodes of speed-up and uplift in the motion records of targets BL1 and MLN. The first episode, starting day 196, is barely perceptible in the horizontal speed record (Fig. 4b) but is clearly evident in the 0.25 m of uplift shown in Figure 4a. We interpret the uplift as due to bed separation by the growth of cavities in the lee of bumps in the bed. These cavities apparently remained enlarged, despite the lack of significant enhanced sliding in the ensuing days. One interpretation of this sustained bed separation is that water pressure sufficient to prevent collapse of cavities, but insufficient to further increase sliding speed, was maintained in the subglacial hydrologic system. Such high pressure would have been conducive to maintaining a head gradient that would prevent lake drainage. The lake continued to fill over this interval.
We interpret the second speed-up event as a response to the large perturbation to the subglacial water system caused by the passage of the floodwaters through the subglacial drainage system. A number of independent records suggest high water pressures occurred subglacially during drainage of HCL, as one would expect. The most direct indicator of subglacial water pressure during HCL drainage is the filling of DFL, a normally dry ice-marginal basin located ∼10km down-glacier from HCL. The DFL ‘pressure gauge’ went high during a period bracketing peak discharge out of HCL (Fig. 5a). The pre-existing conduit system between the region of the lake and the terminus would have been overwhelmed during the rising limb of the flood hydrograph, causing water to back up into cavities, the englacial drainage system (including moulins) and other storage areas, including the basin of DFL.
The time of high water pressure as indicated by the DFL record was also coincident with a plunge in chloride and other solute concentrations in the Kennicott River (Fig. 5). Chloride is particularly useful to trace subglacial distributed-system water at Kennicott Glacier, as it has a bedrock source (Reference Anderson, Longacre and KraalAnderson and others, 2003b). This allowed Reference AndersonAnderson and others (2003a) to use a mixing model to show that low chloride concentration during the flood was not simply due to dilution by lake water, but also reflected a lack of soluterich subglacial water in the river. A reduction in flow of solute-rich water out of the distributed system is expected when subglacial conduits are pressurized. Together, the DFL water level, Kennicott River chemistry and HCL outflow hydrograph all show or imply high subglacial conduit water pressures during the HCL outburst. Therefore, the tight coincidence of these high-water-pressure indicators and the second pulse of bed separation and enhanced surface speed at BL1 and MLN are highly suggestive of a strong linkage between water pressure and sliding speed.
It is curious that BH7 fails to show a peak in water pressure at the time of the flood (Fig. 5a), as might be expected if high water pressure enhances the sliding rate locally. Instead, water level in the borehole began to drop at the same time DFL began to fill and the glacier in the immediate vicinity of BH7 sped up. We hypothesize that this can be explained in two ways. First, we note that BH7 did not connect to the bed, and does not therefore necessarily record basal water pressures; rather, it might record water levels in an englacial reservoir that is unconnected to the basal system. Second, even if BH7 does record basal pressures, stress coupling (Reference Kamb and EchelmeyerKamb and Echelmeyer, 1986) causes sliding speed to depend upon water pressure averaged over some large area of the bed, likely several ice thicknesses in extent. Such an averaging length scale would surely have encompassed the flood pathway through a subglacial conduit, as the ice thickness is roughly 350 m, and the distance to the west wall of the glacier (the furthest possible distance to the conduit) is roughly 1 km (Fig. 1). We note that the daily average water level in BH7 dropped by roughly 40m over the course of the outburst. This could reflect the establishment of hydraulic connections to lower-pressure sites nearby, perhaps allowed by englacial fracturing associated with the flood (Reference WalderWalder and others, 2005).
Horizontal speed, bed separation and DFL lake level simultaneously and abruptly declined at day 209.8. DFL drained at least as rapidly as it filled. The glacier in the vicinity of HCL simultaneously slowed down by a factor of two, from about 1.2 to about 0.6md–1. For the rest of the survey record, the surface speeds remained between 0.5 and 0.7md–1. Bed separation decreased rapidly, although less rapidly than the horizontal speed. Bed separation at both targets fell below the value of pre-flood bed separation within 1 day.
We interpret this response to the termination of the flood V both the slowing of the sliding, and the reduction in bed separation V to reflect the reduction in pressures in the subglacial system. Water within the diffuse linked-cavity system was then able to drain into the enlarged, now low-pressure, conduit system. As cavities were no longer being enlarged by sliding, and as water pressure within the system was declining, cavity roofs were left to collapse by ice deformation. If the bed separation were to return to pre-day 195 levels (i.e. 0 in Fig. 4a), and the bed separation dropped by 30–50% of this in one day, then the e-folding time-scale for collapse is roughly 1 day. This is not unreasonable for 300–400m thick ice, and reasonable values of the flow-law parameter for ice (Reference PatersonPaterson, 1994).
The data we have presented bear upon the mechanism for triggering the lake outburst. While a range of evidence shows that the glacier sped up in response to drainage of HCL, no evidence supports the view that a glacier sliding event directly triggered lake drainage (e.g. Reference Knight and TweedKnight and Tweed, 1991). The abrupt increase in sliding speed occurs not before the lake begins to drop, but 1.5 days later.
The trigger mechanism is more likely associated with the state of the hydrologic system, and in particular the presence of a significant conduit in the region of the lake. The glacial hydrologic system likely consists of (1) englacial storage elements that set the macro-porosity of the glacier, consisting of crevasses, moulins and fractures, (2) a set of cavities in the lee of bedrock bumps, which are connected through a set of smaller orifices, and (3) one or more major conduits that route the water to the terminus (e.g. Reference Fountain and WalderFountain and Walder, 1998). This system evolves on an annual basis, in response to meltwater inputs to the englacial system. As basal water pressure increases due to transmission of meltwater into the connected englacial system, cavities grow by block sliding of the glacier up the stoss sides of bumps. This is recorded in the upward trajectories of the targets (Fig. 2). Importantly, the conduits must re-form each year, and do so by extending from the terminus up-glacier (Reference Nienow, Sharp and WillisNienow and others, 1998; Reference Mair, Nienow, Sharp, Wohlleben and WillisMair and others, 2002). Reference AndersonAnderson and others (2004) have interpreted the termination of spring speed-up sliding at Bench Glacier, a small glacier in the Chugach Range of Alaska, as reflecting the up-glacier expansion of an efficient conduit system under the glacier. This served to remove water from the glacier faster than it was being input through melt, and therefore bled off water pressure.
A plausible scenario for the triggering of the HCL outburst in 2000 is as follows. As the snowline at the time of our observations was well up-glacier of HCL, considerable meltwater had been introduced to this region of the glacier by this time. This presumably promoted the subtle enhancement of motion, which we attribute to basal sliding, and either formed or enlarged cavities at the bed. The observation that the uplift at sites MLN and BL1 was maintained for the 10 days prior to the HCL outburst implies, according to our interpretation, that in that area, at that time, basal cavities were isolated from an efficient drainage path, such as a Röthlisberger (R) channel. We hypothesize that such an efficient drainage path opened up by day 207. One possibility is that an up-glacier-extending conduit reached the region near HCL, but down-glacier of MLN and BL1, by day 206.5. That the MLN and BL1 targets did not speed up suggests that they were far enough from the conduit not to respond to the pressure drop. The low-pressure conduit served to generate a head gradient toward the conduit, and bled pressures from the linked-cavity network lying between the lake and the conduit. The head gradient that had been lakeward at the edge of the glacier then reversed, and a monotonic gradient was eventually established between the lake and the conduit. Through feedbacks that are well described in the literature, this ultimately transformed one connection through the linked-cavity network between the lake and the main conduit into a discrete tunnel system tapping the lake, leading to an outburst flood (e.g. Reference RöthlisbergerRöthlisberger, 1972; Reference ClarkeClarke, 2003; Reference Flowers, Björnsson, Pálsson and ClarkeFlowers and others, 2004).
Conclusions
Outburst floods can be used to probe the dynamical response of a glacier to changes in the subglacial hydrologic system. All records indicate that water pressures in the distributed system were raised during at least the central part of the flood, suggesting that water was either backed up into the linked-cavity system, or injected into it from the pressurized conduit during its growth phase. In the aftermath of the flood, bed separation that had been maintained by high water pressures dropped as englacially and subglacially stored water was discharged through the enlarged conduit and lost from the system.
Glacier sliding and bed separation 10 days prior to the flood, and subsequent maintenance of the high water pressures necessary to prevent collapse of the enlarged cavities, suggest that a low-pressure conduit system was not present in the vicinity of HCL in that period. We hypothesize that such a conduit did extend into this region around day 206.5, setting up the head gradient necessary to allow leakage of the lake toward the conduit, and triggered the outburst.
The HCL outburst cycle at Kennicott Glacier constitutes a natural experiment that has yet to be fully exploited as a probe of the connection between glacier sliding and glacier hydrology. Data on the dynamic response of the main glacier that we report here were collected serendipitously; as our focus was on deformation of the ice dam, the two targets MLN and BL1 served as constraints on far-field response. A fuller documentation of glacier motion throughout the floodway over the entire melt season, and instrumentation of moulins and marginal lakes as natural probes of the evolution of the water-pressure field, are warranted.
Acknowledgements
We gratefully acknowledge support for this research from the US National Science Foundation, Office of Polar Programs. R.S.A. and S.P.A. acknowledge support through NSF OPP-9818251. S.P.A., A.G.F., J.S.W. and D.C.T. were supported in their investigations of the Kennicott outburst floods through NSF OPP-9812945, 9812973, 9812129, 9912180 and 9912306. We also appreciate discussions of the glacial outburst process with M. Kessler, constructive reviews by M. Funk, M. Nolan and M. Truffer, and careful editorial handling by G. Flowers. Mention of trade names is for identification purposes only and does not imply endorsement by the US Geological Survey.



