
Introduction
Electron field emission (EFE) is considered as the only electron emission process compatible with the vacuum electronics due to the fast response time, low power consumption, cathode-ray-tube-like colors, and wide viewing angles.[Reference Itoh, Tanaka and Tonegawa1, Reference Talin, Dean and Jaskie2] However, incorporation of cold field emitters in practical electronic devices is still quite challenging due to the stringent requirements of long cathode lifetime with high stability. Since the discovery of the excellent EFE properties of Q-carbon composite structure,[Reference Haque and Narayan3] there has been a significant increase of interest in studying the emission stability of this material for practical device applications. The carbon-based field emitters such as carbon nanotubes, diamond, nano-diamond, and diamond-like carbon (DLC), have been investigated, however, reliable commercial devices such as field emission lighting elements, frictionless motors, flat panel displays, etc. are still challenging to develop due to several barriers.[Reference Manikandan, Kennedy, Kavitha, Kaviyarasu, Maaza, Panigrahi and Mudali4] Over the decades, diamond has been considered as one of the most promising materials for cold-cathode applications owing to its negative electron affinity (NEA).[Reference van der Weide, Zhang, Baumann, Wensell, Bernholc and Nemanich5, Reference Cui, Ristein and Ley6] However, the ideal single crystal diamond cannot provide the required amount of electrons for the field emission, and the band structure of diamond is unsuitable for the transport of those electrons to the surface. Usually, the diamond surface is terminated by hydrogen to obtain NEA for enhanced EFE properties. But exposing the hydrogen-terminated diamond surface to high fields and to oxygen ambient for several days is enough to replace some of the surface hydrogen with different oxygen groups. This diminishes the NEA and thereby reduces the percentage of the emitting surface area, and worsens the EFE performance.[Reference Harniman, Fox, Janssen, Drijkoningen, Haenen and May7] Therefore, researchers have tried nanometer size or highly defective crystallites having much degraded physical properties than the crystalline diamond, such as polycrystalline diamond, nitrogen-incorporated ultrananocrystalline diamond, and DLC.[Reference Glesener and Morrish8–Reference Zhu, Kochanski and Jin11] The EFE characteristics from the DLC and amorphous carbon can be compared with vacuum breakdown at the high electric field and the electron affinity was found to be positive in these materials, which is undesirable for good field emission characteristics.[Reference Latham12, Reference Diamond13] The field emission from DLC film has been found to be related to the surface roughness.[Reference Robertson14] But the roughness in the DLC film is quite low and not easy to control. A change in the sp2 surface bonding characteristics at a relatively low applied electric field was also observed in the DLC films during the EFE measurements, which significantly affects the EFE properties.[Reference Robertson14] The poor thermal stability and high intrinsic stress in DLC films lead to the degradation of electrical and optical properties and result in the peeling of the film from the substrate during high-temperature EFE tests.[Reference Isono, Tanimoto, Iijima, Kusumawan, Harigai, Suda, Takikawa, Kamiya, Kaneko, Kunitsugu and Taki15] Moreover, damages on the surface, such as the formation of crater, tip-hill-like structures, cracking, amorphization or just traces of surface melting, have been observed after EFE measurements from DLC and CVD diamond.[Reference Talin, Felter, Friedmann, Sullivan and Siegal16, Reference Gröning, Küttel, Schaller, Gröning and Schlapbach17] These factors significantly affect the EFE performance and reliability of devices, and cause serious problems in different EFE-related applications of these materials.[Reference Poa, Silva, Lacerda, Amaratunga, Milne and Marques18] The carbon nanotube has also been considered as a promising material for field emission applications.[Reference Ghosh, Kumar, Maruyama and Ando19, Reference Kennedy, Fang, Futter, Leveneur, Murmu, Panin, Kang and Manikandan20] However, the fabrication and alignment of carbon nanotubes are found to be quite difficult. The growth mechanism of both carbon nanotube and diamond require high temperature and very precise environments.[Reference Das and Singh21] Additionally, the dependence of EFE characteristics on the quantity and type of adsorbed molecules present in the carbon nanotubes and a considerable spread in electronic properties of carbon nanotubes are responsible for the lack of control and uncertainty in the emission characteristics.[Reference Bocharov and Eletskii22] So far, EFE has only been observed from the edges of graphene and graphene oxide sheets.[Reference Ye, Moussa, Ferguson, Baski and El-Shall23, Reference Manikandan, Kavitha and Kennedy24] Since the field emission is only from edges, nanotubes, and graphene composites display nonuniformity which is difficult to control for device applications.[Reference Kleshch, Bandurin, Orekhov, Purcell and Obraztsov25, Reference Fujii, Honda, Machida, Kawai, Ishida, Katayama, Furuta, Hirao and Oura26] Researchers also observed local peeling of the graphene edge from the substrate due to the ponderomotive force during the field emission.[Reference Kleshch, Bandurin, Orekhov, Purcell and Obraztsov25] Overall, poor uniformity, lack of control during fabrication and field emission, low current stability, and structural instability and poor robustness during emission measurements have hindered the commercial development of the aforementioned carbon-based field emitters.
The discovery of Q-carbon heralds a new era for field-emission devices, as it can address the problems related to the structural and emission instability with its excellent mechanical robustness, chemical inertness, adhesion, and excellent emission properties.[Reference Narayan and Bhaumik27] The Q-carbon is fabricated by melting and ultrafast quenching of amorphous carbon using pulsed laser annealing over a large area on different substrates. Studies on Q-carbon have shown that it is harder than diamond (40–70% harder),[Reference Narayan, Bhaumik, Gupta, Haque and Sachan28] has high thermal conductivity, robust ferromagnetism at room temperature,[Reference Narayan and Bhaumik27] and it shows extraordinary Hall effect,[Reference Bhaumik, Nori, Sachan, Gupta, Kumar, Majumdar and Narayan29] and record BCS high-temperature superconductivity upon doping with B.[Reference Narayan, Bhaumik, Gupta, Haque and Sachan28] Q-carbon overcomes the aforementioned problems related to the carbon-based practical EFE devices. Q-carbon is considered among the most promising candidates for large area field emitter applications because of its controlled fabrication processes and outstanding field emission characteristics such as low threshold voltage for electron emission and high field enhancement factor.[Reference Haque and Narayan3] The Q-carbon films can be deposited over a large area using a laser scanning system with a high deposition rate at room temperature. This is a prerequisite for producing fast response wide commercial flat-panel displays for practical applications. Another hindrance for the practical realization of carbon-based field emitters is the absence of long-term field emission stability. Most of the studies have been conducted on the low threshold fields, high field emission current densities, and failure of the emission device. However, complete studies on the fundamental factors that contribute to the field emission stability are still lacking. In this paper, we report the study on the long-term stability of the field emission current density from Q-carbon using different techniques such as Raman spectroscopy, high resolution scanning electron microscopy, and electrical measurements. We obtained very high stability of EFE current over time at different current density levels and over a large range of temperatures.
Experimental
To fabricate the Q-carbon composite films, amorphous carbon films of ~500 nm thickness were deposited on r-sapphire by ablating a high quality (99.99% pure) graphite pulsed laser deposition (PLD) target. The separation between the substrate and the target (placed on a rotating target holder) was ~4 cm. The r-sapphire substrate was cut into 1 cm × 1 cm pieces from a standard commercially available 2-inch wafer. The substrates were cleaned using the standard procedure: 5 min acetone vapor cleaning, ultrasonic cleaning with methanol (5 min), and finally dried with N2 gas. A stainless steel high vacuum chamber was used to deposit the amorphous carbon films at a pressure of ~1 × 10⁻⁶ torr. A Krypton Fluoride (KrF) pulsed excimer laser, with 248 nm wavelength, pulse duration 25 ns, 5 Hz repetition rate and 2 J/cm2 laser fluence, was used for the deposition. The as-deposited DLC films with a mixture of sp3/sp2 bonding were annealed by an Argon Fluoride (ArF) pulsed laser (193 nm wavelength and 20 ns pulse duration) to form Q-carbon nano-composite films. An energy density in-between 0.6 and 0.7 J/cm2 was used to melt the amorphous carbon films in a super-undercooled state. A high quenching rate leads to the formation of the Q-carbon nano-composite structure. The whole process (melting and quenching) takes only 200–250 nanoseconds to complete.
The Raman spectroscopy of the Q-carbon nano-composite films was performed by a WITec confocal micro-Raman system with an excitation wavelength of 532 nm. During the measurements, 1800 lines/mm grating and a 100X_objective (spot size ~2 mm) lens in backscattering configuration were chosen. The Raman instrument was calibrated using a piece of crystalline Si which shows a characteristic peak at ~520.7/cm. The intensity of the laser beam was monitored to avoid any damage to the sample.
A FEI Verios 460 L field electron scanning electron microscope (FESEM) with sub-nanometer resolution was used to perform the high-resolution imaging of the Q-carbon nano-composite film. Using Image J software, we calculated the percentage of the actual area of the Q-carbon region in the sp2 rich amorphous carbon matrix.
The EFE characteristics of the Q-carbon nano-composite films were analyzed in a high vacuum chamber under 5 × 10⁻⁷ Torr pressure. The distance between the Q-carbon nano-composite cathode film and the tungsten anode was 100 µm. The surfaces of our samples and the anode were kept perfectly parallel to avoid an inhomogeneous electric field. We did not use any further processing treatment to obtain emission from the Q-carbon film. After the test, we did not observe any macroscopic surface damage on the film, which is expected as the applied field was kept low and the film was found to be robust. The area of the film was greater than 25 mm2. A detailed set-up for the EFE measurements of Q-carbon has been described in our previous work.[Reference Haque and Narayan3]
Characterization results
FESEM
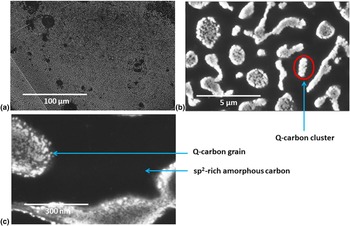
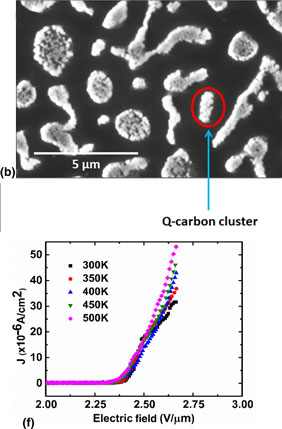
Figures 1(a)–1(c) show FESEM images of the Q-carbon composite structures at different magnifications. The low-magnification image shown in Fig. 1(a) indicates that the laser annealed Q-carbon composite structure can be fabricated over a large area. Figure 1(b), a high magnification image of the same structure, shows individual Q-carbon clusters. The sp2 rich amorphous carbon surrounds the sp3 rich Q-carbon grains in each of these clusters. The amount of Q-carbon coverage (in the form of clusters) in the amorphous carbon matrix is considerably less, which is evident from these two figures. Figure 1(c) is a very high magnification image of the same structure, which shows the presence of Q-carbon grains inside a cluster. The sp2-rich grain boundaries are present in-between the grains, which provide the conducting pathway to the electrons during the EFE measurements. The high density of the grain boundaries inside the Q-carbon clusters connected with the amorphous carbon matrix provides an efficient EFE device.
(a) Large area Q-carbon composite film on a c-sapphire substrate, (b) Q-carbon clusters and the amorphous carbon in-between the clusters, and (c) high magnification image of the Q-carbon composite structure showing individual Q-carbon grains in a cluster.

Raman spectroscopy
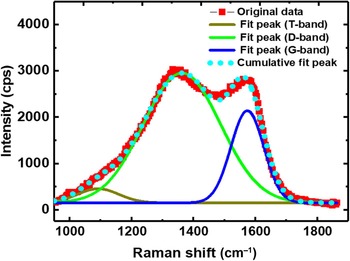
Figure 2 shows the Raman spectrum of the Q-carbon structure. This spectrum confirms the presence of both D and G peak at 1343 and 1568/cm, respectively, meaning that the Q-carbon film consists of sp3-bonds mixed with sp2-bonds.[Reference Chuang, Sun, Cheng, Huang and Lin30] The peak fitting of the Raman spectrum using the Gaussian distribution function gives the percentage of sp3 carbon of around 80–82%. The rest of the carbon remains in sp2 form. These results are in agreement with the early studies on Raman and EELS analyses of Q-carbon structures.[Reference Haque and Narayan3, Reference Narayan and Bhaumik27] The Raman spectrum of the carbon structures is also sensitive to the ratios of bonds present in the structure and the local environment as well. Deconvolution of the Raman spectrum also reveals that the position of the G-band, at 1582/cm for PLD grown DLC film, is shifted to 1568/cm after the pulsed laser annealing. The redshift in the G-band of Raman spectrum is due to the increase in the sp3-bonds in the amorphous carbon structure.[Reference Humphreys and Khachan31] The higher sp3 fraction in the Q-carbon structure could be responsible for very low or NEA. The sp2 bonded carbon present in the structure provides the conductivity to the charge carriers taking part in the electron emission process. As a result, the Q-carbon composite structure provides an ideal platform for excellent EFE characteristics. The Raman spectra of the as-deposited DLC film before laser annealing, and the amorphous carbon regions (in between the Q-carbon clusters) are provided in the supplementary document. The microstructure of Q-carbon is controlled by the degree of undercooling.
Raman spectrum of Q-carbon.

EFE properties
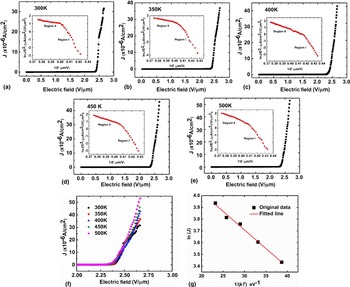
Figures 3(a)–3(e) show the field emission current density-electric field (J-E) characteristics of the Q-carbon composite film at room temperature and above (up to 500 K). These EFE plots demonstrate exponential characteristics for the applied field values above the turn-on field. Such a fine field emission property can be ascribed to the coexistence of sp3-bonded carbon with the sp2-bonded carbon at a suitable ratio in the Q-carbon clusters, providing an ideal platform for excellent EFE. The Q-carbon consists of sp3 bonded tetrahedra which are packed with over 80% packing efficiency.[Reference Narayan, Bhaumik, Gupta, Haque and Sachan28] The sp2-bonded carbon exists in-between sp3-bonded tetrahedron. The tetrahedrally bonded carbon acts as field emitters, whereas the sp2-bonded carbon provides a good conduction path for transporting electrons during the EFE tests.[Reference Lin, Chang, Yokoyama, Chuang, Tsai, Wang and Lin32] The observed EFE capacity of Q-carbon field emitter (J~53 µA/cm2 at E~2.66 V/μm) is significantly larger than from other forms of carbon-based field emitters.[Reference Lin, Chang, Yokoyama, Chuang, Tsai, Wang and Lin32] The EFE experiment was repeated several times, and the magnitude of the turn-on electric field and the maximum current density did not fluctuate with time. The EFE characteristics were reproducible during subsequent voltage cycles without any hysteresis effects.
The field emission current density versus applied electric field plots at (a) 300 K, (b) 350 K, (c) 400 K, (d) 450 K, and (e) 500 K. Inset in figures (a) – (e) represent the F–N plots of the corresponding EFE data. (f) Shows the field emission current density versus applied electric field plots in the same frame measured at five different operating temperatures. (g) Arrhenius plot of the of the EFE current density for the Q-carbon field emitter. The solid line is the linear approximation of the experimental points obtained at different temperatures under a constant applied electric field.

The data from the EFE measurements were plotted in accordance with the Fowler–Nordheim (F–N) expression and are shown in the insets of corresponding J-E plots in Figs. 3(a)–3(e). The F–N expression for semiconductors can be represented by[Reference Stratton33, Reference Li, Liang and Wang34] the following equation.
 $$J = A\left( {\displaystyle{{\beta^2E^2} \over \emptyset}} \right){\rm \; exp}\left( { - \displaystyle{{B\emptyset^{3/2}} \over {\beta E}}} \right){\rm \; exp}\left( - \displaystyle{{\Delta W^s - \Delta W^P} \over {2KT}}\right)$$
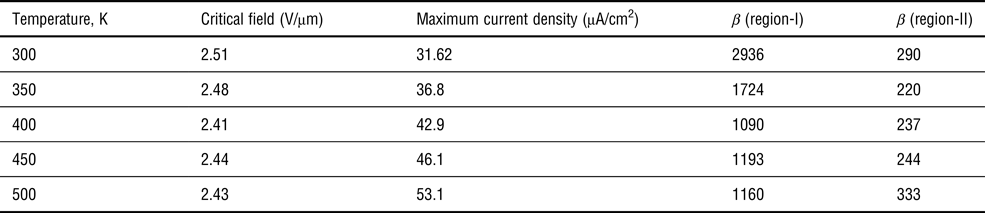
where, J denotes the field emission current density, E denotes the applied electric field between the tungsten anode and Q-carbon cold cathode emitter (E (=V/d) is the ratio between the applied voltage V and the distance d between the metal anode and the field emitter plane d), Φ denotes the work function, β is the field enhancement factor which characterizes the intensification of the applied electric field as a function of the morphology of the emitter, T is the absolute temperature, and k is the Boltzmann constant. The surface potential barrier for sp3-bonded nanostructures due to surface states is represented by ΔWS, and the decrease of the surface potential barrier due to field penetration is expressed by ΔWP. The two well-known constants A and B have values: A = 1.54 × 10⁻⁶ A eV V−2, and B = 6.83 × 10³ eV−3/2 V−1 μm. The J–E plots in Figs. 3(a)–3(e) fit well to the F–N relation at the low field region and it deviates from the linearity due to the current saturation of Q-carbon after a certain applied electric field. This saturation region is marked as region II in the F–N plots. This type of current saturation is also observed in high resistivity Si and Ge,[Reference Borzyak, Yatsenko and Miroshnichenko35] wide bandgap In2O3 nanowires,[Reference Li, Liang and Wang34] and CNT emitters.[Reference Lim, Jeong, Shin, Kim, Kim, Park, Choi, An, Bae and Lee36] In accordance with the classical field emission model, the slope of the F–N plots can be determined by the combined parameter (φ 3/2/β), where φ is the workfunction of the Q-carbon emitter, and β is the field enhancement factor for the emitting spots. In these plots, this parameter varied between 22 eV3/2 and 203 eV3/2. The EFE current density increases with β or decreases with φ. The β is the ability of an EFE surface to enhance the local electric field at the emission spots. The β is normally expressed in terms of the ratio of local electric field (E local) to the applied electric field (E), which justifies its association with the generation of the local field rather than the applied field. At low electric field (region I) the EFE property mainly depends on the surface states of the Q-carbon structure. The F–N plots deviate from the linearity when the applied electric field is above a critical field value. The critical field values thus obtained are tabulated in Table I, which vary in-between 2.41 and 2.51 V/μm. We have explained this nonlinear behavior by an electronic model in our earlier work, where the surface potential barrier decreases with increasing applied electric field and hence the emission current density increases rapidly after a critical value of the applied electric field.[Reference Haque and Narayan3] The field penetration surpasses the surface potential barrier at this critical value and lowers the barrier height tremendously for the electrons to overcome during the EFE process. Therefore, region II is the slow current variation region also termed as “saturation” region.[Reference Fursey37] Although the operating voltage is an important parameter for different EFE related applications, the stability of emission current density and the durability of the emitter are also essential. Degradation of the emission performances can be evaluated by measuring the stability of the EFE current intensity with time at a constant applied voltage.
Field enhancement factor in the temperature range from 300 to 500 K.

Temperature dependence of field emission
We analyzed the temperature-dependent EFE characteristics of the Q-carbon composite structure. Studies have shown that in p-type semiconductors and in some highly resistive n-type semiconductors, a highly resistive depletion zone is formed with the penetration of electric field at the surface of the emitter during EFE measurements.[Reference Baskin, Lvov and Fursey38] Similar to the operation mechanism of a reverse biased diode, this depletion region limits the current flow, and produces a saturation region. Therefore, region II in the F–N plot shows saturation behavior of the EFE device due to the limited supply of carriers in the depletion region. Since the thermal generation of free charge carriers in the depletion zone strongly affects the supply of the charge carriers to the emitter surface, this model predicts a strong dependence of the current density on operating temperature. Accordingly, we observed an increase in the emission current density (1.58 times at 2.65 V/μm applied electric field) with in situ heating of the Q-carbon composite sample from room temperature to 500 K. In this region, the dependence of the EFE current density on temperature follows Arrhenius law, J ~ exp(−E a/kT), where E a is the characteristic activation energy in the Q-carbon sample and k is the Boltzmann constant. At constant applied electric field (in the middle of region II) the ln(J) versus 1/kT demonstrates a linear behavior with slope equal to 0.032, which has been shown in Fig. 3(g). This slope represents the thermal activation energy in eV during the electron emission tests of Q-carbon samples. We also observed a slight decrease in the activation energy with a decrease of the applied electric field. The total difference of the activation energy (ΔEa) in the Q-carbon composite sample at the beginning and the end of the region II is ~2 meV. The observed increase in the emission current density with temperature from Q-carbon field emitter is related to the interband states. These states might have small activation energy possibly due to the different energy levels in the band gap. At high temperature, the electrons from these states could be elevated to the conduction band due to the dependence of free carrier density on the thermal energy. Another possibility could be the emission of electrons towards the anode via vacuum medium directly from those interband states, however, the probability for this phenomenon to take place is less.[Reference Chen, Huang, Liu, Deng and Xu39] The possible application of temperature dependence of emission current density from Q-carbon field emitter could be thermoelectric conversion devices, where low operation temperature and high conversion efficiency are required.
Stability analyses
Stability over time
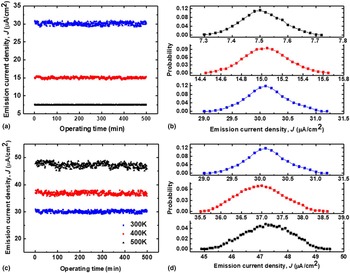
The stability experiments on a Q-carbon EFE device determine the reliability of the emission device and therefore the robustness of the emitter. We analyzed the stability of the Q-carbon field emitter by measuring the variation in the field emission current density as a function of time and at different temperatures. Figures 4(a) and 4(c) represent the time evolution of the emission current density from Q-carbon composite sample at different emission current densities. The emission current density was found to be very stable even after 500 min of continuous operation, which is significantly superior to the EFE stability of many other carbon-based EFE devices.[Reference Chuang, Sun, Cheng, Huang and Lin30] In all of our stability analyses, the emission current fluctuations were less than 7%.
(a) Room-temperature emission current densities as a function of time, (b) probability distribution of corresponding emission current densities fitted by Gaussian function, (c) emission current densities at 2.64 V/μm under different operating temperatures (300, 400, and 500 K) as a function of time, and (d) probability distribution of corresponding emission current densities fitted by Gaussian function.

Stability at different current levels
Figure 4(a) represents the room-temperature current stability for three different field emission current densities at different applied electric fields. The current data were collected at every minute for more than 500 min. It can be observed that the fluctuation increases with increasing field emission current density. We fitted the Gaussian function in the distribution of current densities at different current levels, which has been shown in Fig. 4(b). From this analysis, we obtained important parameters such as the mean value, standard deviation and FWHM (full width at half max) for the Q-carbon composite sample. These parameters along with the corresponding applied electric field are presented in Table II. We observed an increase in the standard deviation, ~5 times for the current density from 7.5 to 30.1 µA/cm2, and broadening in the FWHM with increasing EFE current density. The field emission parameters obtained from this study implies better stability of the EFE current even at a high level of current density.
Mean, standard deviation and FWHM obtained from the Gaussian fitting of the Q-carbon EFE data.

Stability at different temperatures
We also analyzed the current histories of the Q-carbon field emitter device at different temperatures by studying the fluctuation behavior of the current density using the Gaussian function. Figure 4(c) presents the emission current density as a function of time at 300, 400, and 500 K under the constant applied electric field (2.64 V/μm). We fitted the Gaussian function in the distribution of field emission current densities, which gives us continuous probability distributions. Figure 4(d) shows the corresponding probability distribution plots. The mean value, standard deviation and FWHM for the Q-carbon field emitter are important parameters, which have been extracted from the fitted curves. Table II summarizes the fitted values for comparison. It is evident from this study that the room-temperature field emission current density has less distribution compared with that at elevated temperatures. The FWHM broadens with temperature showing that the current fluctuation increases with EFE operating temperature. The standard deviation from the Gaussian fitting profile also increases with temperature. Nevertheless, from room-temperature to 500 K, the fluctuations in the current density are within the limit that can be considered as good for practical applications.
The relatively narrower field emission current distributions from the Q-carbon film during all of the measurements imply the highly stable field emission characteristics along with no physical degradation over time of operation. At the end of this study, we examined the surface of the emitter by optical and electron microscopy to ensure structural stability and did not cause any physical damage. We also performed I-V tests before and after the EFE measurements. No significant variations in the I-V plots before and after the EFE tests also confirm the robustness of the Q-carbon sample during the electron emission process. The I-V plots before and after the EFE tests are shown in the supplementary section.
Discussion
The excellent EFE stability in Q-carbon can be attributed to the unique bonding characteristics of this novel phase of carbon. One of the key mechanisms behind the field emission current fluctuations from carbon-based cold-cathodes is the adsorption of gaseous species onto the emitting surface. These types of contaminants can modify the local work function of carbon structures at the emitting surface, which may cause a change in the field emission current density over time. Due to its superior chemical inertness with high atomic packing fraction, the Q-carbon composite film is less susceptible to the adsorption of contaminant gases or other organic/inorganic species.[Reference Narayan, Gupta, Bhaumik, Sachan, Cellini and Riedo40] Therefore only a small amount of change occurs in the work function (in the local regions) during the EFE tests over time, which has a negligible effect on the emission current density. Thus, the Q-carbon shows an excellent stability during the field emission measurements with an excellent lifetime of this emitter.
Similar to the polycrystalline diamond the composite structure presented in this work has sp3 rich Q-carbon grains, which are surrounded by sp2 rich grain boundaries (amorphous carbon). In the sp3 rich Q-carbon composite structures, the sp2 bonded carbon provides the percolation path, which helps to attain more current density during the EFE measurements. From the Raman analysis, it is confirmed that the Q-carbon consists of a small fraction of sp2-bonded carbon atoms which are uniformly distributed among the highly packed sp3-bonded carbon tetrahedron.[Reference Narayan, Gupta, Bhaumik, Sachan, Cellini and Riedo40] This unique structure of Q-carbon provides the necessary conduction to the free carriers inside the Q-carbon grains during the electron emission process. Since sp3 bonded carbon structure usually exhibits very low barrier or NEA, the electrons in the Q-carbon face a very negligible potential barrier for emission and the Q-carbon device can emit electrons easily at a very low applied electric field. In fact, NEA for Q-carbon was established using Kelvin probe force microscopy in our earlier studies.[Reference Narayan and Bhaumik27] When an external electric field is applied, the large local electric field is generated around the sp2-bonded amorphous carbon structure due to the termination of the field lines.[Reference Carey, Forrest, Khan and Silva41] This helps to obtain efficient EFE devices from the Q-carbon composite structure, where sp2 and sp3-bonding characteristics play an important role in the complementary process. The optimum amount of sp2 and sp3 bonding in the Q-carbon as well as in the surrounding amorphous carbon structure are needed for efficient field emission from the Q-carbon based field emitter devices. The high thermal conductivity of the sp3 rich grains act as a heat sink and help to maintain an efficient EFE process. Additionally, the distribution of sp2 carbon in sp3 matrix creates a dielectric inhomogeneity, which enhances the field enhancement factor.[Reference Carey, Forrest and Silva42] Furthermore, the energy levels of the sp2 carbon are located close to the Fermi level of the material and raise the Fermi level towards the conduction band. Thus the presence of uniformly distributed sp2 carbon reduces the work-function and thereby helps to obtain good EFE properties of the Q-carbon composite structure.[Reference Satyanarayana, Hart, Milne and Robertson43, Reference Guo, Sun, Huang and Sun44] Earlier we investigated the correlation between excellent EFE properties and morphology of Q-carbon composite structure.[Reference Haque and Narayan3] The electron emission from Q-carbon grains is explained by a band diagram model where we proposed the modification in the electronic states at the surface of Q-carbon under in the presence of an applied electric field. The observed increase in current density and the decrease in turn-on field in Q-carbon field emitter with temperature could be due to the further modification in the electronic structures, such as the defect levels which facilitate the transportation of electrons through sp3-bonds. This could be one of the predominant factors affecting the EFE characteristics due to the change in temperature of the emitter. Moreover, the optimum sp3-to-sp2 ratio is also another important factor, which is explained as follows.[Reference Chuang, Sun, Cheng, Huang and Lin30] In Q-carbon the sp3 bonded C tetrahedra impart the low or NEA of diamond and also a physical and chemical inertness, which are pre-requisite for field emission display applications.[Reference Robertson45] The excess amount of sp2 bonded C, which provides the conduction pathway to the electrons, deteriorates the enhanced properties of the sp3 rich structure for the EFE. Therefore, maintaining an optimum sp3/sp2 ratio is very crucial in an EFE device, which seems to be present in the Q-carbon structure. A preliminary FESEM study of the samples after the high-temperature EFE experiments did not reveal any noticeable structural change. At the same time, we cannot rule out a minor change due to the rise in temperature that causes electrical property change leading to better field emission properties. Raman spectroscopy was employed to characterize the microstructural changes of the Q-carbon composite structure after the temperature-dependent studies. No appreciable changes in the position of the D band and G bands and the ratio between these two peak intensities were observed, implying a highly stable characteristic of Q-carbon. Our studies have shown higher density of states near the Fermi level in Q-carbon, which may enhance the field emission characteristics.
Summary
Detailed microstructural analysis and field emission current stability measurements have been carried out for the Q-carbon composite samples fabricated by PLA of amorphous carbon thin films. The characteristics of the emission current from the Q-carbon cold-cathode at different current levels over a long time have been studied. It is observed that the fluctuation in EFE currents increases with increasing current density level. The effect of the operating temperature on the stability of the EFE current density has also been investigated. Particularly the current in the saturation region has been found to be sensitive to temperature and increase by ~58% with temperature from 300 to 500 K. This was attributed to the interband defect levels. Along with the excellent emission stability, the Q-carbon composite structure demonstrates outstanding thermal sensitivity during EFE tests, which can open new frontiers for applications in sensor and heat controlled electron sources. The fundamental study reported here has certainly improved our understanding of electron emission mechanisms in the presence of an applied electric field in Q-carbon, and can thus serve as a platform to understand other important characteristics of Q-carbon field emitters for display device application.
Supplementary material
The supplementary material for this article can be found at https://doi.org/10.1557/mrc.2018.172.
Acknowledgments
This work was financially supported by the Army Research Office (Grant No. W911NF-17-1-0596). This work used the analytical instrument facility (AIF) at North Carolina State University, which is supported by the State of North Carolina and National Science Foundation. We are very pleased to thank Lews Reynolds, Punam Pant and John Prater for the useful feedback. We also want to acknowledge the Fan Family Foundation Distinguished Chair Endowment for Professor J. Narayan.