I. INTRODUCTION
Depth-sensing indentation at micro- and nanoscale levels is the most advanced experimental method for the determination of mechanical properties such as hardness, elastic modulus, or fracture toughness of very small volumes of materials and in particular of thin films.Reference Pharr1 The well-established procedure of Oliver and PharrReference Oliver and Pharr2, Reference Oliver and Pharr3 can be applied to load–displacement curves to deduce hardness and elastic modulus. This standard method is based on the assumption of purely elastic unloading phase for an elastic–plastic contact. Many materials, however, exhibit under certain conditions (loading and unloading rates, long holding time, temperature) a time-dependent behavior, and as a result, conventional methods may not provide an adequate determination of material properties. Indeed, the unloading behavior can be viscoelastic, and if the viscosity effects are not corrected, the calculated modulus can be seriously erroneous and dependent on the testing conditions. Many studies dealing with the investigation of creep under load during indentation tests can be reported for both sharp and spherical indenter geometries.Reference Chudoba and Richter4–Reference Oyen14 These different works are focused on the use of indentation to assess creep (stress exponent in the case of metallic surfacesReference Goodall and Clyne9) or the viscoelastic properties using Maxwell, Voigt, or Maxwell–Voigt rheological models by describing the displacement response during a step loadReference Fischer-Cripps7 or by describing all the loading–hold–unloading curves as a function of the testing conditions, especially the effect of the loading rate.Reference Oyen and Cook5, Reference Oyen6, Reference Oyen14 Ngan et al.Reference Ngan, Wang, Tang and Sze8 have proposed a correction formula to eliminate the creep effects often observed with the formation of a characteristic nose at the beginning of the unloading phase. For all these interesting studies, the main problem, to develop or improve their approaches or models, deals with the determination of the true contact depth and then the true projected contact area, during viscoelastic–plastic contacts, especially for conical or pyramidal indenter geometries. In Ref. Reference Oyen14, Boltzmann hereditary integrals are used to generate displacement-time solutions for loading at constant rate and creep. For sharp Berkovich indenter, plastic deformation occurring mainly along edges complicates the viscoelastic analysis. Tweedie and Van VlietReference Tweedie and Van Vliet13 have quantified the postindentation recovery of bulk polymers and showed up to 80% of indentation depth within recovery time of about 105 s.
Moreover, it is interesting to note that creep test during indentation is a very complex mechanical experiment, especially when using a spherical indenter. Indeed, during the holding time after loading, as observed by several authors on different materials, such as some metalsReference Fischer-Cripps7, Reference Goodall and Clyne9 or polymeric surfaces,Reference Oyen and Cook5, Reference Oyen6, Reference Kaufman and Klapperich11–Reference Oyen14 the penetration of the tip increases progressively as a function of time. For a spherical indenter with a tip radius R, this variation of the penetration depth generates a progressive decrease of the average contact pressure (the applied normal load F n is assumed to be constant during holding time), and simultaneously the imposed strain, proportional to the ratio a/R (with a, the contact radius) as defined by TaborReference Tabor15, increases. Such evolution of stress and strain is complex and can not be reproduced with others classical macroscopic tensile or compressive tests.
In this article, we present first original results obtained using a microindentation system equipped with an optical system, allowing in situ observations of the contact geometry during the loading, the holding, the unloading, and then the postindentation recovery phases. With our specific device, the true contact geometry can be directly determined from optical observations without any help of analytical model, as a function of creep and recovery time. Evolution of the true contact geometry can be determined as a function of temperature or the initial imposed strain at the end of the loading phase. Using interference fringes, we are able to estimate with high accuracy the evolution of both indentation depth and volume during the viscoelastic postindentation recovery within recovery time up to 106 s.
II. EXPERIMENTAL AND NUMERICAL DETAILS
A. Experimental setup
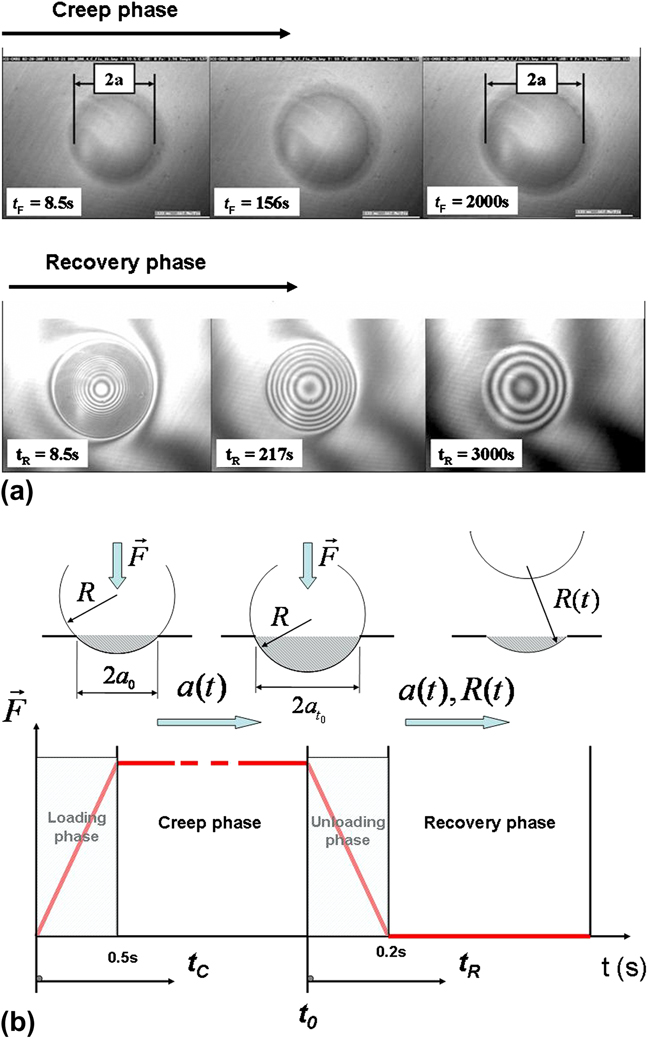
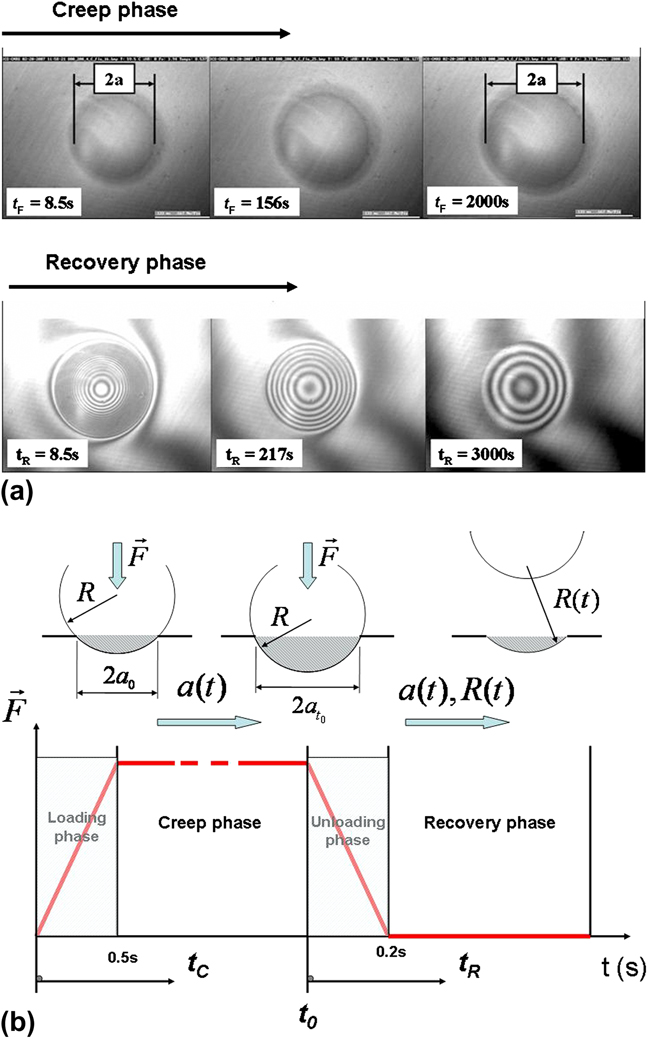
The creep and recovery phenomena during indentation with spherical indenter were directly monitored using a homemade experimental device that allows in situ observation of the projected contact area during indentation tests, as depicted in Fig. 1. This experimental device has been initially developed for the analysis of scratch experiments on amorphous polymeric surfaces.Reference Gauthier and Schirrer16, Reference Gauthier, Lafaye and Schirrer17 With contact size of about 100 μm, the true contact radius of contact between the indenter and the deformed surface can be determined without any help of analytical models, such as the Oliver and Pharr model, which is not really efficient in the case of elastic or viscoelastic contacts.
In situ observation of (a) the contact area during creep and (b) the residual imprint during recovery phase, respectively, as a function of the creep time and the recovery time, during indentation of a polymethylmethacrylate surface with a spherical indenter. (c) Evolution of the applied normal load as a function of the different imposed times.
Microindentation measurements with spherical indenter with a tip radius R = 400 μm were carried out at different temperatures (−20 °C ≤ T ≤ 100 °C) and creep durations (10 s ≤ t 0 ≤ 105 s). Thermal drift is ±0.5 °C. The applied normal load was chosen to perform tests at different initial ratios a 0/R varying between 0.1 and 0.2, these values being selected to prevent full yielding of the polymethylmethacrylate (PMMA) surface. The applied normal load does not drift over time, indeed our experimental system applied a dead weight.
As shown in Fig. 1, a constant load is applied to the sample during creep time (t 0), and the contact radius a(t) is described during the creep phase as a function of the creep time (t C). The loading phase duration is equal to 0.2 s, and measurements of the contact radius start for a time equal to 0.5 s. After the creep phase, the indenter is removed rapidly from the surface and a glass plate slides over the residual imprint. The interference fringes generated can provide an accurate estimation of the residual depth (Fig. 1). The difference in height between two white (or black) fringes (∆h) is equal to half the wave length (λ) of the monochromatic light beam used. Hence, the radius of the residual imprint a(t) and the curvature R(t) of the residual imprint during the recovery phase can be determined as a function of the recovery time (t R). Note that the end of the creep phase, when t C = t 0, corresponds to the start of the recovery phase at t R = 0. This original technique allows the experimental study of the viscoelastic postindentation recovery of the residual imprint as a function of the indentation conditions (creep duration, tip radius, and temperature). More details about the indentation apparatus adapted for creep tests into amorphous polymeric materials can be found in Ref.Reference Chatel, Gauthier, Pelletier, Le Houerou, Favier and Schirrer18.
B. Theoretical analysis
As defined initially by TaborReference Tabor15 on metallic surfaces, the average strain imposed during indentation with a spherical indenter for elastic–plastic contact is proportional to the ratio a/R. As demonstrated in a recent article,Reference Pelletier, Gauthier and Schirrer19 this relationship can be extended to polymeric surfaces exhibiting low ratio E/σ y (with E, the elastic modulus, and σ y, the yield stress) with a small influence of the local friction coefficient, by comparison with scratch experiments. In first approximation, the representative strain can be expressed as follows:
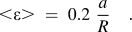
To estimate the evolution of the strain during creep phases, due to the variation of the contact geometry (contact radius), we have introduced the following expression:

where a(t) and a 0 are, respectively, the contact radius as a function of creep time and the initial value of the radius at t C equal to 0.5 s (see Fig. 1). The tip radius R is assumed to be constant during the creep phase. In a similar way, during the recovery phase, the evolution of the representative strain proposed is equal to

where a(t) is the radius of the residual imprint as a function of recovery time, R(t) is the evolution of the residual imprint curvature, and  is the initial value of the radius at t 0 corresponding to the holding time (see Fig. 1).
C. Finite element modeling
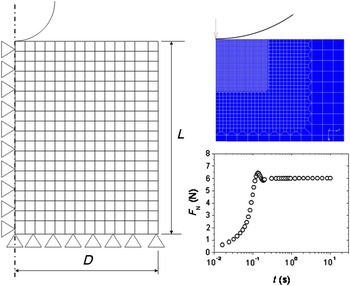
The axisymmetric contact model is described in Fig. 2. The dimensions of the mesh and the sphere, considered infinitely rigid here, are used to study the viscoelastic behavior of material during a sphere/plane contact for a ratio a/R up to 0.5. The 3332 mesh elements are quadratic with four nodes and a Gauss point. The mesh is refined around the contact area. This model has been validated elastically from the equations of Hertz.Reference Johnson20 To reproduce the real experimental loading conditions, a specific numerical model is used and corresponding tables of load for microindentation test are included in the numerical model. For example, the simulation runs include the existence of an “overshoot” phenomenon, classically observed during experiments, when the normal load is applied (Fig. 2) and also a possible drift of the sensors over time. Hence, when numerical results are compared with experimental data, errors and discrepancies are not related to a problem of load control.
Axisymmetric numerical model of a sphere/plane contact and evolution of the normal applied load with time introduced in finite element simulation to reproduce the experimental loading conditions (<ε 0> = 4%, R = 400μm, T = 30 °C).

Note that the ratio a 0/R and the average contact pressure (p m) at t F = 0.5 s are also identical to the values observed experimentally. It is possible to consider that the boundary conditions on numerical simulations are identical to the experimental conditions.
III. RESULTS AND DISCUSSION
A. Influence of the temperature
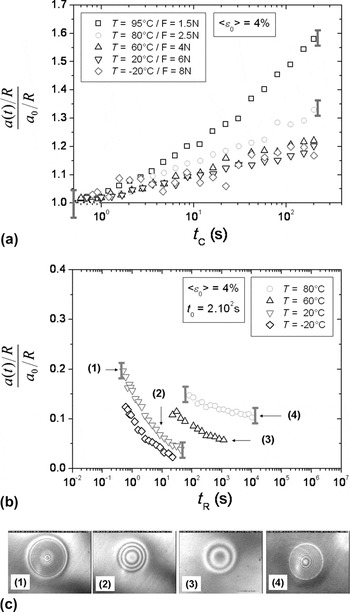
Figure 3(a) shows the evolution of the representative strain as a function of creep time for different temperatures and an initial mean contact strain of 4%. The normal forces applied to obtain the desired mean contact strain at different temperatures are also indicated. We observe that the representative strain increases with time. The measurement error decreases as the size of the contact increases. The curves corresponding to the three lowest temperatures overlap. Above a temperature of 80 °C, the curves no longer overlap and a nonlinear behavior is observed for those corresponding to the two highest temperatures. At 80 °C, this specific phenomenon appears for a holding time of 5 s.
Evolution of the representative strain as a function of the creep time t C (a) and of the recovery time t R (b) at different temperatures (R = 400 μm, t 0 = 200 s, <ε 0> = 4% fixed at the end of the loading phase). Optical observations of residual imprint during recovery phase.

Figure 3(b) presents the evolution of the proposed representative strain [Eq. (3)] during recovery phase as a function of time for different temperatures, an initial mean contact strain of 4%, and a holding time of 200 s. At the two lowest temperatures, the curves almost overlap and allow complete healing of the imprint. Above a temperature of 60 °C, the curves no longer overlap and indicate a nonlinear viscoelastic behavior during the recovery phase. Permanent strain is clearly observed for the curve corresponding to a temperature of 80 °C. The test performed at 95 °C could not be analyzed as the interference fringes were too close to be counted, despite an observation period of 104 s.
Figure 3(c) shows a typical view of the in situ contact area during the creep and subsequent recovery phases of the measurement. The true contact area increases as a function of the creep time. The decrease in the number of interference fringes during the recovery phase reflects the diminishing size of the residual imprint.
The polymeric surface during the creep phase exhibits the nonlinear behavior of the viscoelastic contact on PMMA. The geometrical nonlinear behavior, generated by the spherical indenter used, may not only explain the global evolution observed in Fig. 3(a) that is probably a material phenomenon, as demonstrated by the values recorded at the highest temperatures. Thus, the creep tests at high temperature display nonlinear behavior during postindentation recovery, and permanent strain is observed especially for the two highest temperatures, indicating that plasticity has evolved in the deformed volume. When the test is performed too close to the α transition, the nonlinear viscoelastic and viscoplastic behavior, developed in the volume, may modify the strain mechanisms, which might explain this discrepancy.
As shown in Fig. 3(b), complete healing of the residual imprint may be obtained despite the nonlinear behavior observed during the creep phase. The occurrence of nonlinear behavior during the recovery phase can be predicted from the observation of nonlinear behavior during the creep phase. However, in the opposite, the observation of nonlinear behavior during the recovery phase is not directly related to nonlinear phenomenon during the creep phase, as observed at T = 60 °C in Fig. 3(b).
B. Influence of the initial imposed strain
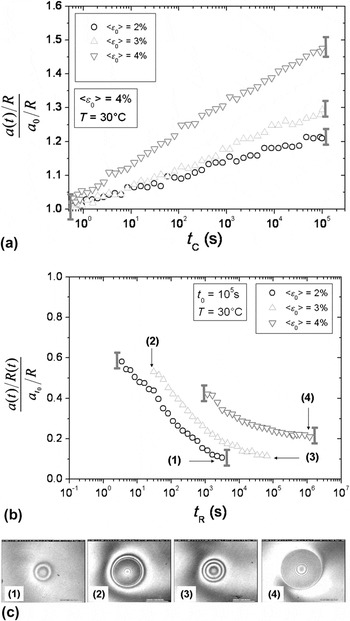
Figure 4(a) shows the evolution of the representative strain as a function of creep time for different mean contact strains and a temperature of 30 °C. The representative strain increases with creep time. The curves do not overlap, and as the initial mean contact strain increases, the creep of the contact becomes more important. Figure 4(b) depicts the evolution of the representative strain as a function of the recovery time for different initial mean contact strains imposed during the creep phase, a temperature of 30 °C and a holding time of 105 s. Curves do not overlap and permanent strain is observed for those corresponding to the two highest initial mean contact strains.
Evolution of the representative strain as a function of the creep time t C (a) and of the recovery time t R (b) for different initial strain values <ε0> (R = 400 μm, T = 30 °C, <ε 0> fixed at the end of the loading phase). Optical observations of residual imprint during recovery phase.

During the creep phase, the viscoelastic behavior depends on the initial mean contact strain imposed on the polymer. When the initial mean strain is greater than 2%, one may consider that the viscoelastic behavior of a sphere/plane contact is not linear. Indeed, as reported in Fig. 4(b), during the recovery phase, the curve corresponding to an initial mean contact strain of 2% tends to 0. By contrast, nonlinear viscoelastic behavior of PMMA is typically observed for the curves corresponding to the two highest initial mean contact strains, and these curves may also display permanent strain, that is, plasticity may appear under the contact with time only with the increase of the imposed strain [Eq. (1)]. A study of the influence of the holding time enabled us to verify that the behavior is also nonlinear for larger values of the contact strain.
C. Mean contact pressure
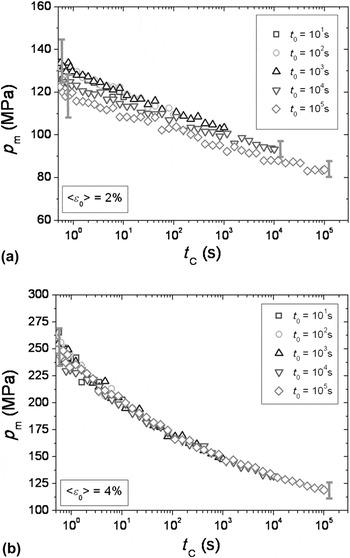
Figure 5 presents the evolution of the mean contact pressure as a function of the creep time for different holding times, a temperature of 30 °C and an initial mean contact strain of 2% [Fig. 5(a)] and 4% [Fig. 5(b)]. Note that the threshold of yielding of PMMA appears at a true strain of 3% in a uniaxial compression test. The mean contact pressure decreases with the creep time. Results, described in Fig. 3, indicate that the behavior during creep for an initial mean contact strain of 4% is nonlinear, and this would seem to be at the origin of the nonlinear behavior observed during the recovery. A study of the recovery for two initial mean contact strains and different holding times should help to validate this hypothesis.
Evolution of the average contact pressure p m during creep phase, as a function of contact time for different creep durations (a) with an initial mean contact strain of 2% and (b) with an initial mean contact strain of 4% (R = 400 μm, T = 30 °C).

The evolution of the mean contact pressure, presented in Fig. 5, is not a relevant parameter to predict the onset of plastic strain. The mean contact pressures obtained for the two initial mean contact strains are almost identical for a long creep time, but recovery behavior is roughly different.
D. Finite element modeling
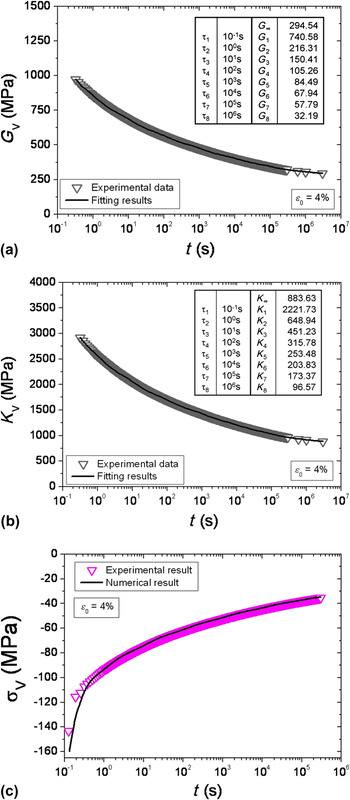
The viscoelastic constitutive law used in the numerical analysis of a contact is the viscoelastic Maxwell model. The digital tool available suggests writing the generalized Maxwell model from the description of the deviatoric modulus and the bulk modulus. This script is used regularlyReference Samyn, Van Schepdael, Leendertz, Gerber, Van Paepegem, Degrieck and De Baets21 especially in consideration the relaxation on the spherical part of the tensor of rigidity. For a relaxation test, the generalized Maxwell model is written as follows:


where Gi and Ki correspond to fitting parameters, and G ∞and K ∞ correspond to relaxed deviatoric modulus and relaxed bulk modulus. In this study, Poisson’s ratio is considered constant and equal to 0.35. Identification has been made using relaxation tests as required by the constitutive law. A relaxation test involves applying a constant strain on a sample and measuring the stress relaxation as a function of time. Several tests are performed for different true strains and equal to 0.75%, 1.4%, 2.4%, and 4%. These specific values correspond more or less to the range of initial imposed strain after creep phase during indentation.
To adjust the fitting parameters Gi and Ki describing the constitutive law for each chosen characteristic times, a number of characteristic times τi has to be chosen, at least equal to the number of decades explored during creep and relaxation tests. In our case, to reproduce experimental data with a good correlation, we have to impose a number of characteristic times equal to 8. Figure 6 shows evolution of deviatoric modulus (G V) and bulk modulus (K V) during uniaxial relaxation test as a function of time for a true strain applied equal to 4%. Evolution of corresponding true stress as a function of relaxation time is also compared with results obtained with numerical analysis, using identified rheological parameters (inset in Fig. 6).
Evolution of deviatoric modulus (G V) and bulk modulus (K V) during relaxation test as a function of time for a true strain applied equal to 4% (T = 30 °C). Evolution of true stress as a function of relaxation time determined experimentally with compressive test and comparison with results obtained with numerical analysis, using identified rheological parameters.

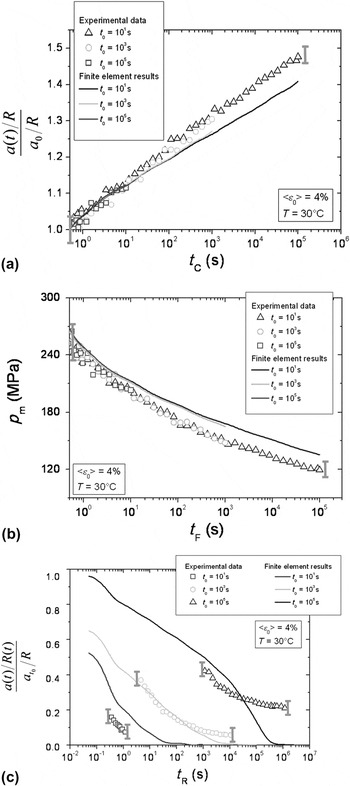
Figure 7(a) shows the evolution of representative strain defined by as a function of creep time for different holding times and an initial mean contact strain equal to 4%. Results deduced from numerical analysis using identified rheological parameters (Fig. 6) are compared to experimental results. We observed a good correlation between results obtained by numerical analysis and experimental data. Nevertheless, the representative strain proposed corresponding to the holding time equal to 105s was underestimated compared to experimental results.
Comparison of numerical analysis and experimental results for a sphere/plane contact. (a) Evolutions of the representative strain proposed during creep phases; (b) evolutions of the average contact pressure as a function of creep time; and (c) evolution of the representative strain during recovery phase proposed as a function of recovery for different holding times and initial mean contact strain 4% (R = 400μm, T = 30 °C).

In the case of the average contact pressure as a function of creep time for different holding times, the results obtained by numerical analysis are in good agreement with experimental results [Fig. 7(b)]. Nevertheless, we may note that the average contact pressures determined by finite element modeling (FEM) significantly overestimate the experimental values. Figure 7(c) exhibits the evolution of representative strain proposed [Eq. (3)] as a function of recovery time for different holding times and an initial mean contact strain equal to 4%. The numerical results follow more or less well the experimental results. For a holding time equal to 10 s, the simulation correctly describes the experimental data. For a holding time equal to 103 s, complete healing of the residual imprint is also simulated; however, the trends of the curves are opposed. The nonlinear behavior obtained during the recovery phase is not modeled by the constitutive law introduced in finite element (FE) analysis [Eqs. (4) and (5)]. For a holding time equal to 105 s, the simulation results do not include the specific behavior of PMMA and the permanent strain experimentally observed. Finite element simulations assuming only viscoelastic behavior, even using macroscopic rheological parameters identified experimentally with compressive tests, are not sufficient for a good description of the experimental data especially during recovery phase. But, the description of viscoelastic strain and stress fields determined by FEM at the end of the creep phase can be useful to provide a first analyse of the recovery phenomenon after indentation.
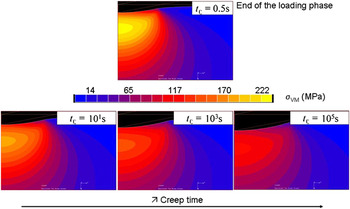
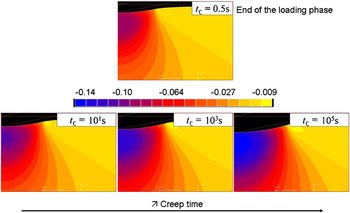
Figures 8 and 9 depict Von Mises equivalent stress and viscoleastic strain fields, respectively, for a creep duration (t C = 0.5 s) at different holding times (<ε 0> = 4%, R = 400 μm, T = 30 °C) determined by FEM. As previously mentioned in Figs. 5 and 7(b), when studying the evolution of the average contact pressure, the Von Mises stress beneath the spherical indenter decreases with creep time. The maximal value in the contact zone is reached at the end of the loading phase, just before the beginning of the holding phase. The level of the Von Mises stress located at a distance from the contact surface corresponding more or less to the Hertz point is greater than 220 MPa (Fig. 8). This value deduced from FE analysis is higher than the yield stress of the material and could explain the initial yielding phenomenon. In parallel, as a function of the decrease of the Von Mises stress with the holding time, we observe in Fig. 9 that the strain in the normal direction (along the indentation axis) increases progressively in intensity to reach a very high value, close to 14% for a creep time t C = 105 s. It is interesting to note that the location of the maximal strain is shifted with time from the bulk to the surface of the contact zone. Such variation of the location of the maximal strain may also explain the lack of linearity observed during recovery phase that appears to be directly related to the creep phase and more exactly to the strain field imposed at the end of the holding time. To numerically reproduce the experimental curves recorded during recovery phase [Fig. 7(c)], a strain criterion has to be developed to correctly describe the viscoelastic–plastic strain field beneath the spherical indenter as a function of the testing conditions. As mentioned in Ref. Reference Pelletier, Gauthier and Schirrer19 for elastic–plastic contact, friction between the indenter and the deformed surface has also to be accounted for in numerical simulations. Indeed, during indentation with spherical indenter, local friction is known for a given ratio a/R to increase the strain intensity and to locate the plasticity in the near surface region.
Von Mises equivalent stress fields determined by finite element modeling (FEM) for after the loading phase (t C = 0.5s) and after different holding times (10, 1000, and 100000 s), for <ε 0> = 4%, R = 400μm, and T = 30 °C.

Strain fields in the normal direction determined by FEM after the loading phase (t C = 0.5 s) and after different holding times (10, 1000, and 100000 s), for <ε 0> = 4%, R = 400μm, and T = 30 °C.

IV. CONCLUSION
Using a specific microindentation apparatus that allows in situ observations of the contact during creep phase and also of the residual imprint and its evolution during recovery phase, we propose a new analytical approach, describing the effects of viscoelastic properties of polymeric surfaces during indentation tests. We demonstrate the influence of the indentation conditions, such as the temperature or the holding time, on the mechanical response of the surface during creep and recovery phases. As a function of the imposed holding time during creep, some similar phenomena are observed especially at high temperature, and recovery is slightly affected. An original study of the recovery is presented to obtain information on the healing properties of a residual imprint. The self-healing properties appear to be logically related to the mechanical state reached in the contact zone during the previous creep phase.
The viscoelastic rheological parameters of the generalized Maxwell model have been identified and then introduced in FEM to reproduce numerically indentation tests, assuming only viscoelastic contacts at room temperature. According to FE simulations, the observed nonlinear behavior is certainly due to apparition of plasticity in the deformed volume beneath the indenter tip that depends mainly on the initial imposed strain.