Introduction
Diversity in herbivores, both at the genetic and the species levels, imposes a major challenge to integrated pest management strategies. For example, deviating herbivore genotypes may reflect resistant strains (Asser-Kaiser et al., Reference Asser-Kaiser, Fritsch, Undorf-Spahn, Kienzle, Eberle, Gund and Jehle2007; Cheney et al., Reference Cheney, Hadapad and Zebitz2008; Gund et al., Reference Gund, Wagner, Timm, Schulze-Bopp, Jehle, Johannesen and Reineke2012), or strains responding differently to attractive odors (Najar-Rodriguez et al., Reference Najar-Rodriguez, Bellutti and Dorn2013), impairing for example management tactics based on microbial or olfactory tools. Diversity at the species level may go unnoticed particularly if species are closely related, but molecular techniques may contribute to a correct identification and subsequent choice of effective management methods (Chen & Dorn, Reference Chen and Dorn2009; Franck & Timm, Reference Franck and Timm2010; Jung et al., Reference Jung, Jung and Kim2013; Silva-Brandao et al., Reference Silva-Brandao, Almeida, Moraes and Consoli2013).
Tortricid fruit feeders (Lepidoptera: Tortricidae), which are generally of great economic significance (Rothschild & Vickers, Reference Rothschild, Vickers, van der Geest and Evenhuis1991; Chen & Dorn, Reference Chen and Dorn2010a ; Nguyen et al., Reference Nguyen, Sýkorová, Šíchová, Kůta, Dalíková, Čapková Frydrychová, Neven, Sahara and Marec2013), have attracted increasing attention in the last decade with respect to such diversity, especially some species of the genera Grapholita and Cydia (Fuentes-Contreras et al., Reference Fuentes-Contreras, Espinoza, Lavandero and Ramírez2008; Chen & Dorn, Reference Chen and Dorn2010b ; Kirk et al., Reference Kirk, Dorn and Mazzi2013b ; Wei et al., Reference Wei, Cao, Gong, Shi, Wang, Zhang, Guo, Wang and Chen2015). In the oriental fruit moth Grapholita (= Cydia) molesta Busck (Lepidoptera: Tortricidae) feeding on apple fruit (Malus domestica), we found that different management methods selected for prevalence of different genotypes (Zheng et al., Reference Zheng, Qiao, Wang, Dorn and Chen2015). Using microsatellite and mitochondrial gene (COI and COII) markers, this investigation showed that populations from fruit-bagged and unbagged orchards were genetically slightly, but significantly differentiated. By studying populations of Cydia strobiella L. (Lepidoptera: Tortricidae) feeding on spruce tree cones, field pheromone trapping followed by DNA-based analyses revealed genetically distinct populations including a cryptic species (Svensson et al., Reference Svensson, Wang, Lassance, Anderbrant, Chen, Gregorsson and Loefstedt2013). Cryptic species denominate two or more distinct species that are, or have been, classified as a single nominal species because they are morphologically completely or nearly indistinguishable (Bickford et al., Reference Bickford, Lohman, Sodhi, Ng, Meier, Winker, Ingram and Das2007; Rebijith et al., Reference Rebijith, Asokan, Kumar, Krishna, Chaitanya and Ramamurthy2013), whereby the closest relatives of each other can be addressed as sibling species (Bickford et al., Reference Bickford, Lohman, Sodhi, Ng, Meier, Winker, Ingram and Das2007).
Investigations on insect diversity have successfully been based on mitochondrial DNA (Barcenas et al., Reference Barcenas, Unruh and Neven2005; Pramual et al., Reference Pramual, Kuvangkadilok, Baimai and Walton2005; Li et al., Reference Li, Duan, Qiao, Li, Wang, Men and Chen2015) with cytochrome oxidase subunit I and II (COI and COII) regions. The barcode region of COI is particularly useful for determining intra- and inter-species phylogenetic relationships (Trewick, Reference Trewick2000; Nolan et al., Reference Nolan, Carpenter, Barber, Mellor, Dallas, Mordue Luntz and Piertney2007) and for delineating species (Puillandre et al., Reference Puillandre, Modica, Zhang, Sirovich, Boisselier, Cruaud and Samadi2012; Kekkonen & Hebert, Reference Kekkonen and Hebert2014). Mitochondrial DNA sequence divergence of the same species is much lower than of closely related other species, what is helpful in species diagnosis (Moore, Reference Moore1995; Hebert et al., Reference Hebert, Cywinska, Ball and deWaard2003, Reference Hebert, Penton, Burns, Janzen and Hallwachs2004a ; Funk et al., Reference Funk, Caminer and Ron2012). Such species delimitation based on mitochondrial DNA sequence divergence depends on the taxonomic group and on the mitochondrial gene used (Moore, Reference Moore1995; Hebert et al., Reference Hebert, Cywinska, Ball and deWaard2003, Reference Hebert, Stoeckle, Zemlak and Francis2004b ). To differentiate closely related Lepidoptera species, it was proposed to use the 3% nucleotide divergence level at the mitochondrial DNA COI gene, based on the finding that lepidopteran divergence values above 3% corresponded with 196 of the 200 species recognized from previous morphological studies (Hebert et al., Reference Hebert, Cywinska, Ball and deWaard2003). Consistent with this proposed delineating value, the genetic distance between two very closely related lepidopteran species, Helicoverpa armigera and Helicoverpa zea (Lepidoptera: Noctuidae), proved to be higher than 3% (ranging from 0.031 to 0.047), whereas the intra-specific nucleotide diversity of the most intensely studied species in the same work, H. armigera, remained at least one order of magnitude lower for all regions sampled (Behere et al., Reference Behere, Tay, Russell, Heckel, Appleton, Kranthi and Batterham2007). Furthermore, the genetic distance among 484 individuals of the lepidopteran taxon Astraptes fulgerator (Lepidoptera: Hesperiidae) from northwestern Costa Rica displayed considerable divergence, ranging from 0.00 to 7.95%, and it was concluded that this taxon comprises a complex of at least 10 cryptic species, with differing ecological attributes, particularly host plant specificity (Hebert et al., Reference Hebert, Penton, Burns, Janzen and Hallwachs2004a ).
To investigate diversity in the oriental fruit moth G. molesta, China proved to be especially rewarding, as populations in this country are highly diverse (Kirk et al., Reference Kirk, Dorn and Mazzi2013a ). China lies in the range of origin of G. molesta, as indicated by molecular analyses (Kirk et al., Reference Kirk, Dorn and Mazzi2013b ; Zheng et al., Reference Zheng, Peng, Liu, Pan, Dorn and Chen2013; Wei et al., Reference Wei, Cao, Gong, Shi, Wang, Zhang, Guo, Wang and Chen2015). The oriental fruit moth occurs on several pome and stone fruit species (Rothschild & Vickers, Reference Rothschild, Vickers, van der Geest and Evenhuis1991; Natale et al., Reference Natale, Mattiacci, Hern, Pasqualini and Dorn2003; Najar-Rodriguez et al., Reference Najar-Rodriguez, Bellutti and Dorn2013), and to exclude effects of different host plants on herbivore diversity (Zheng et al., Reference Zheng, Peng, Liu, Pan, Dorn and Chen2013), we focus here on apple, which is rapidly gaining importance in China (http://faostat3.fao.org/download/Q/QC/E). For field trapping of G. molesta, we used the commercially available pheromone trap developed for monitoring, which proved to be highly selective for this tortricid in previous work in other regions of China (Li et al., Reference Li, Qin, He and Wu2008; Wang et al., Reference Wang, Zhu, Cai, Ji, Ju and Xu2013; Zheng et al., Reference Zheng, Qiao, Wang, Dorn and Chen2015).
The principal aim of this study was to gain a deeper insight into the genetic diversity of Grapholita moths in a Chinese region with extended apple cultivation, using pheromone trapping and DNA sequence analyses. We detected that trap catches were composed of two different, morphologically related species, G. molesta and – according to strict morphological identification – Grapholita funebrana Treitschke (Lepidoptera: Tortricidae). However, G. funebrana has been found to be a stone fruit borer but not an apple fruit borer throughout its distribution range (Troschel, Reference Troschel1850; Woo, Reference Woo1961; USDA, Reference Whitehead and Whittle1984; Hrdý et al., Reference Hrdý, Marek, Krampl, Kuldová and Barabas1993, Reference Hrdý, Kocourek, Beranková and Kuldová1996). We characterized this second species by flight phenology comparatively with G. molesta, and investigated its genetic diversity using mtDNA COI and COII genes. We provide, for the first time, evidence that this second species is a cryptic species in G. funebrana, likely native to China.
Materials and Methods
Field survey and morphological identification
To obtain moth samples, we hanged the commercially available delta-shaped pheromone trap designed to attract Grapholita molesta (Pherobio Technology Co. Ltd, Beijing, China) into three apple orchards along a transect of 190 km in a major apple growing area in Shaanxi Province, China. Active compound in the trap comprised (Z)-8-dodecen acetate (Z8-12: Ac), (E)-8-dodecen acetate (E8-12: Ac) and (Z)-8- dodecenol (Z8-12: OH) at a ratio of 96:3.5:0.5. Five traps were hanged into each orchard every morning, removed in the evening, and five new traps were placed on different trees, a process which continued for 5 days, yielding a total of 75 trap catches per sampling event. Eighteen sampling events per orchard took place from May to September 2012 (fig. 1). The sampling region is specialized on apple growing and is devoid of orchards with other fruit species, however, we cannot completely exclude existence of some single fruit trees different from apple, especially around houses. The sampled moths were assigned to morphospecies in the laboratory and counted. Seasonal dynamics of the species were analyzed using GraphPad Prism version 5 (GraphPad Software, 2007). To visually assign the sampled moths to the morphospecies G. molesta, we used the porrect labial palpi (extended forward) and the unscaled proboscis as the key characteristics (Horak & Brown, Reference Horak, Brown, van der Geest and Evenhuis1991). Based on our previous results from other regions, we expected a high specificity of the pheromone trap for G. molesta (Zheng et al., Reference Zheng, Peng, Liu, Pan, Dorn and Chen2013; M.H. Chen personal observation). As we found, unexpectedly a substantial number of insect specimens belonging to a morphospecies distinct from G. molesta (see section Results), we term this additional species henceforth ‘the second species’, and shift the focus of the study to it.
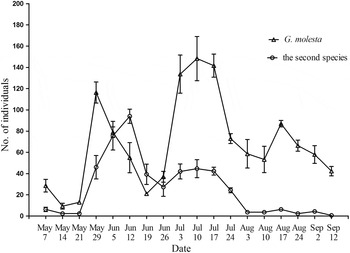
Abundance of G. molesta and ‘the second species’ as assessed by pheromone trapping at 18 sampling events throughout the season. Dates indicated represent the medium day of a 5d sampling event. Numbers of individuals are given as mean ± SD (n = 3 orchards).

To identify this second species morphologically, the male genitalia of 20 samples of the moth were dissected, and treated with 10% NaOH solution at approximately 100°C for 10 min, rinsed with distilled water, immersed in droplets of glycerol and observed using a compound light microscope (Nikon Eclipse 50i). The male genitalia of four specimens of G. funebrana adults from Switzerland and 20 specimens of G. molesta adults were also dissected using the same method. Photos were taken using a Scientific Digital micrography system equipped with an Auto-montage imaging system (Retiga-4000R, Qimaging Corporation, Austin, TX, US). Morphological identification was carried out by the first and last authors, as well as by three independent taxonomists, Willi Sauter (ETH Zurich), Chun-Sen Ma (Chinese Academy of Sciences) and Zhaofu Yang (Northwest A&F University).
Insect sampling for molecular analyses
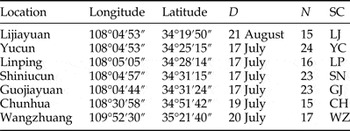
To collect moth samples for genetic diversity analysis of the second species (morphologically identified as G. funebrana, see section Results), seven apple orchards in the same region as above (Shaanxi Province, China) were sampled in July or August 2013. The area measured 150 km in length and 50 km in width (table 1). Five pheromone traps were hanged into each orchard for 24 h each, replaced daily for five subsequent days by hanging the new traps always on new trees, keeping a minimum distance of 5 m among sampled fruit trees. The moths sampled on the total 25 traps per orchard were taken to the laboratory and assigned to morphospecies. Captures of the second species could range from zero to several individuals per trap, but at most one moth per trap was used for further analysis. Samples were preserved in 10-ml Falcon tubes filled with 70% ethanol. Eight specimens of G. funebrana larvae from Czech Republic and four specimens of G. funebrana adults from Switzerland were used for comparative analysis. Several 658 bp COI barcode sequences of G. funebrana samples from different European countries had been uploaded to BOLD Systems. Those G. funebrana barcode sequences were very conservative with at most two nucleotide differences between each pair. We used the universal primers LCO1490 (5′-GGTCAACAAATCATAAAGATATTGG-3′) and HCO2198 (5′-TAAACTTCAGGGTGACCAAAAAATCA-3′) (Folmer et al., Reference Folmer, Black, Hoeh, Lutz and Vrijenhoek1994) to identify the barcode region of the larval samples from Europe. The adult specimens collected in China were first identified morphologically by the first and last authors and by the taxonomist Zhaofu Yang (Northwest A&F University), and then molecularly using the COI barcode region.
Sampling information: pheromone trapping in seven apple orchards.

D, collection date; N, number of individuals; SC, sample code.
Sample codes are made up with capital letters of the abbreviation of the location.
DNA extraction
Genomic DNA was extracted from 8 to 10 mg of individual material using the DNeasy Tissue Kit (Qiagen, Hilden, Germany). Extraction was performed according to the bench protocol for animal tissues. DNA was eluted in 200 ml of TE buffer and stored at −20°C.
Mitochondrial DNA amplification
The barcode region of cytochrome oxidase subunit I gene (COI) can be easily amplified with the universal primers LCO1490 (5′-GGTCAACAAATCATAAAGATATTGG-3′) and HCO2198 (5′-TAAACTTCAGGGTGACCAAAAAATCA-3′) (Folmer et al., Reference Folmer, Black, Hoeh, Lutz and Vrijenhoek1994), and was widely used for inter-specific and intra-specific genetic distance analysis (Hebert et al., Reference Hebert, Cywinska, Ball and deWaard2003, Reference Hebert, Penton, Burns, Janzen and Hallwachs2004a ). The barcode sequence of eight specimens of G. funebrana larvae from Czech Republic and four specimens of G. funebrana adults from Switzerland were amplified using the primer pair LCO1490 and HCO2198. Twenty moths of the second species trapped were used for amplifying the barcode sequence. Each polymerase chain reaction (PCR) mixture contained 1 × PCR amplification buffer (Takara, Dalian, China), 2 µM MgCl2, 0.2 µM of each dNTP (Takara, Dalian, China), 3.0 µl (2 µM) each of the oligonucleotide primer, 2 µl genomic DNA (10–30 ng µl−1). PCR reactions were performed on a Bio-Rad S1000TM Thermal Cycler (Bio-Rad Laboratories, Hercules, CA, USA) and consisted of an initial denaturation step at 94°C for 2 min, followed by 45 cycles of 1 min at 94°C, 1.0 min at 45°C and 1.0 min at 72°C, and then a final elongation step for 10 min at 72°C. After verification via gel electrophoresis, the PCR products were purified with a Wizard PCR Preps kit (Promega, Madison, WI, USA), and then sequenced in both directions with the PCR amplification primers on an ABI3730XL DNA analyzer (Applied Biosystems, Foster City, CA, USA) using the commercial services of Sangon Biotech (Shanghai, China).
For genetic diversity analyses, a 740 bp mitochondrial cytochrome oxidase subunit I (COI) sequence and a 683 bp cytochrome oxidase subunit II (COII) sequence, which were applied to analyze genetic diversity of G. molesta (Zheng et al, Reference Zheng, Peng, Liu, Pan, Dorn and Chen2013; Zheng et al., Reference Zheng, Qiao, Wang, Dorn and Chen2015), were adopted in the current study. The COI sequence of the second species was amplified with the primer pairs C1-J-2183 (5′-CAACATTTATTTTGATTTTTTGG-3′) and TL2-N-3014 (5′-TCCAATGCACTAATCTGCCATATTA-3′) (Simon et al., Reference Simon, Prati, Beckenbach, Crespi and Liu1994), while the COII sequence was amplified using the primer pairs TL2-J-3037 (5′-ATGGCAGATTATATGTAATGG-3′) and TK-N-3785 (5′-GTTTAAGAGACCAGTACTTG-3′) (Simon et al., Reference Simon, Prati, Beckenbach, Crespi and Liu1994). Each PCR was carried out in a total volume of 25 µl, containing 1 × PCR amplification buffer (Takara, Dalian, China), 2 µM MgCl2, 0.2 µM of each dNTP (Takara, Dalian, China), 3.0 µl (2 µM) each of the oligonucleotide primer, 2 µl genomic DNA (10–30 ng µl−1). The following thermocycling profile was used for all products: initial denaturation at 95°C for 10 min, followed by 35 cycles of 30 s at 95°C, annealing at a primer-specific temperature for 45 s (48°C for COI gene and 57°C for COII gene), 45 s at 72°C, and a final step of 15 min at 72°C. After verification via gel electrophoresis, the PCR products were purified with a Wizard PCR Preps kit (Promega, Madison, WI, USA), and then sequenced in both directions with the PCR amplification primers on an ABI3730XL DNA analyzer (Applied Biosystems, Foster City, CA, USA) using the commercial services of Sangon Biotech (Shanghai, China).
Sequence analysis
The obtained COI gene sequences amplified from ‘the second species’ from China and from G. funebrana samples from Europe using the universal primer LCO1490 and HCO2198 (Folmer et al., Reference Folmer, Black, Hoeh, Lutz and Vrijenhoek1994) were reduced to the 658 bp barcode region (Hebert et al., Reference Hebert, Cywinska, Ball and deWaard2003) for further inter- and intra-specific genetic distance analysis, whereas the inaccurate parts of the forward and reverse region in the sequences were cut off. The obtained 685 bp COI barcode regions were carefully aligned in MEGA version 6.06 (Tamura et al., Reference Tamura, Stecher, Peterson, Filipski and Kumar2013) and BioEdit version 7.0.90 (Hall, Reference Hall2007). If a single mutation was found only in one sequence of the alignment, then the original chromatograms would be checked, and the PCR product would be sequenced again to correct the possible sequencing error and to confirm the mutation.
To compare the inter-specific and intra-specific genetic distances among ‘the second species’ and further Grapholita species, and to analyze the phylogenetic relationships among them, the COI barcode region of 14 additional Grapholita species was downloaded in BOLD Systems (http://www.boldsystems.org/). The BOLD Systems sequence IDs and the GenBank accession numbers which are shown in the BOLD Systems for each sequence are: Grapholita coronillana, FBLMS377-09.COI-5P (GenBank accession number: HM376278), FBLMS378-09.COI-5P (HM391753); Grapholita lunulana, LON063-08.COI-5P (KX048522), LEFIL631-10.COI-5P (KX041352) and LEEUA247-11.COI-5P (JN274942); Grapholita mesosocia, AFTOR105-12.COI-5P (KJ592127), AFTOR113-12.COI-5P (KJ592333) and AFTOR098-12.COI-5P (KJ592218); Grapholita compositella, FBLMS376-09.COI-5P (GU706405), LEFIG110-10.COI-5P (HM875790) and CGUKC903-09.COI-5P; G. molesta, MECB610-05.COI-5P (GU096468), GBMIN18061-13.COI-5P (KC136082) and GBMIN30935-13.COI-5P (JF733841); Grapholita dimorpha Komai, GBMIN17939-13.COI-5P (KC136079), GBMIN17940-13.COI-5P (KC136077) and GBMIN17943-13.COI-5P (KC136071); Grapholita aureolana, LEFIA774-10.COI-5P (HM386916), PHLAB1004-10.COI-5P (KX042723) and LEFIA010-10.COI-5P (HM396360); Grapholita tenebrosana, LEFIB658-10.COI-5P (HM871536), LEFID506-10.COI-5P (HM873271) and LEFIJ643-10.COI-5P (JF853740); Grapholita prunivora, LPSOB765-08.COI-5P (KT133047) and LPSOB763-08.COI-5P (KT148061); Grapholita packardi, TMNBC008-06.COI-5P (KT129506), MEC661-04.COI-5P (GU095866) and MEC599-04.COI-5P (GU095867); Grapholita edwardsiana, LALPA370-10.COI-5P (JF852805), LALPA951-11.COI-5P (KT130390) and LALPA371-10.COI-5P (JF852806); Grapholita caecana, LEFIJ681-10.COI-5P (JF853768), PHLAA083-09.COI-5P (HM432298) and LASTS366-14.COI-5P (KP253317); Grapholita lobarzewskii, LEFIJ488-10.COI-5P (JF853613), PHLAV223-12.COI-5P (KM572239) and LEFIL595-10.COI-5P (KM572115); Grapholita gemmiferana, FBLMU375-09.COI-5P (HM902066) and FBLMT289-09.COI-5P (HQ955151). Genetic distance analyses were conducted with MEGA version 6.06 (Tamura et al., Reference Tamura, Stecher, Peterson, Filipski and Kumar2013) using a Neighbor-joining algorithm (Saitou & Nei, Reference Saitou and Nei1987). The relative fits of substitution models were evaluated by the Bayesian information criterion (BIC), and the lowest BIC score was considered to describe the substitution pattern the best (Tamura et al., Reference Tamura, Peterson, Peterson, Stecher, Nei and Kumar2011). MEGA version 6.06 was used to construct the Neighbor-joining tree. The standard error test for every interior branch was conducted by using the Interior-branch test in MEGA version 6.06 (Tamura et al., Reference Tamura, Stecher, Peterson, Filipski and Kumar2013).
The accurate part of COI and COII gene of the respective sequence obtained was kept for further analysis, whereas the inaccurate parts of the forward and reverse regions of COI and COII gene sequences were cut off. To analyze the genetic diversity of the second species, the obtained COI and COII mitochondrial DNA sequences of the second species were aligned in MEGA version 6.06 (Tamura et al., Reference Tamura, Stecher, Peterson, Filipski and Kumar2013) and BioEdit version 7.0.90 (Hall, Reference Hall2007). The aforementioned method (described in the first paragraph of ‘Sequence analysis’) was used to check and correct the sequence errors. The haplotypes were identified and characterized using the GENEALEX version 6.0 (Peakall & Smouse, Reference Peakall and Smouse2006). Sequences were deposited in GenBank database (accession numbers: KR866146 to KR866273).
Genetic diversity
A matrix of 133 individual sequences from the second species was submitted into the DnaSP version 5.0 (Librado & Rozas, Reference Librado and Rozas2009) and the number of polymorphic sites (S), the number of haplotypes (Nh), nucleotide diversity (π), and haplotype diversity (Hd) were calculated. To visualize the genetic relationships among haplotypes, we used NETWORK version 4.6.1 to construct the Median-joining networks of mtDNA haplotypes based on statistical parsimony (Bandelt et al., Reference Bandelt, Forster and Röhl1999).
Population expansion
Historical demography and spatial expansions were estimated for the second species using flowed statistical methods. The demographic patters of populations based on the number of pairwise mutational differences among individuals or mismatch distributions were explored by ARLEQUIN version 3.5.1.2 (Excoffier & Lischer, Reference Excoffier and Lischer2010). The mismatch distribution of pairwise nucleotide differences between haplotypes was used to assess the historical demography. For populations in demographic equilibrium, a multimodal mismatch distribution is expected, while populations with a recent sudden demographic expansion are expected to show a unimodal distribution (Slatkin & Hudson, Reference Slatkin and Hudson1991; Rogers & Harpending, Reference Rogers and Harpending1992; Excoffier, Reference Excoffier2004; Rosetti & Remis, Reference Rosetti and Remis2012). In order to test for past population expansion, the Tajima's D and Fu's Fs neutrality tests were estimated with 1000 permutations by ARLEQUIN version 3.5.1.2. The validity of the estimated stepwise expansion model was tested by the sum of square deviations (SSD) between the observed and expected mismatch as a statistical method to infer the significance with the parameter bootstrap approach (2000 replicates), with a significant P value (P < 0.05) indicating a stable population (Meng et al., Reference Meng, Shi and Chen2008; Excoffier & Lischer, Reference Excoffier and Lischer2010). The raggedness statistics (r) quantified the smoothness of the mismatch distribution with a significant P value (P < 0.05) indicating a population without recent expansion.
Results
Field survey and morphological identification
Surprisingly, moths captured by the pheromone trap designed to attract G. molesta contained a second species throughout the season. This second species was visually distinct from G. molesta, as it was lacking the white discocellular spot at the top of the forewing, which is an easily detectable feature of G. molesta. The proportion of the second species fluctuated between 2 and 67% per sampling event (representing means of 75 trap captures each), with a median of 22%, whereby the remaining percentages referred to G. molesta (fig. 1). On one occasion among the 18 sampling events, two individuals of G. dimorpha Komai (Lepidoptera: Tortricidae) have been trapped. The width of their forewing was obviously broader than in G. molesta, and the lower part of termen in their hindwing was strongly concaved, in contrast to that of G. molesta (Komai, Reference Komai1979; Yan et al., Reference Yan, Liu and Li1999). Due to the rare occurrence of G. dimorpha individuals, they were excluded from further calculations, which then focused on the two key species.
Whilst G. molesta had three flight peaks around 29 May, 10 July and 17 August, the second species had two flight peaks around 12 June and 10 July. Abundance of the second species, as assessed by pheromone trapping, exceeded abundance of G. molesta in the first half of June (fig. 1).
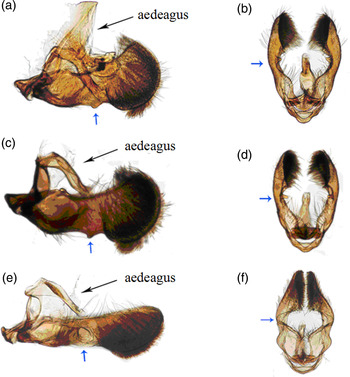
Two authors and the independent taxonomists concurred in identifying the second species morphologically as G. funebrana Treitschke. Despite its high morphological similarity to G. molesta, visual appearance showed some characteristic differences (Troschel, Reference Troschel1850; Woo, Reference Woo1961; Wu et al., Reference Wu, Kang and Hu1983), comprising (1) coloration of forewings, with those of G. funebrana being grayish brown with indistinct silvery-gray markings on the dorsum (i.e., at the lower margin of the forewing), and those of G. molesta being dull grayish brown with a row of black dots near the apex (i.e., at the end of the anterior margin of the forewing) and termen (i.e., at the outer edge of the forewing); (2) patterns on forewings, with G. funebrana lacking the white discocellular spot characteristic for G. molesta; (3) the thornlike projection off the ventral margin (i.e., at the under side) in the valva (i.e., the appendage flanking the intromittent organ) of G. funebrana (fig. 2a, b), which is lacking in G. molesta (fig. 2e, f); (4) the form of the ventral margin, with the valva not being concaved distinctly in G. funebrana (fig. 2a, b), in contrast to G. molesta (fig. 2e, f). A comparison of our specimens (ID: GF-SX-201301-GF-SX-201510) collected in China with museum specimens from Europe (Entomological Collection of ETH Zurich) revealed no difference in morphology (fig. 2a, b vs. fig. 2c, d). Samples of the specimens (ID: GF-SX-2013Gr) from China were deposited in the insect specimen collection of Northwest A&F University, Yangling. As morphological characterization alone may not be sufficient, particularly if there are still discrepancies (see section Discussion), we continued with DNA barcoding to ascertain species identification, and we continue to term the focus species as ‘the second species’.
Male genitalia of (a) G. funebrana (Europe), lateral view; (b) G. funebrana (Europe), ventral view; (c) ‘the second species’ (China), lateral view; (d) ‘the second species’ (China), ventral view; (e) G. molesta, lateral view; (f) G. molesta, ventral view. Arrows not further specified in the Figure point to the present or absent thornlike structure.

Molecular divergences between ‘the second species’ and G. funebrana
We obtained three haplotypes (GFE1 – GFE3) (GenBank accession numbers:KX23041 – KX23043) (fig. 3) of the barcode sequence from the European G. funebrana samples. These three haplotypes differed in one or two nucleotides between each other. Three haplotypes (GFC1 – GFC3) (KX23044 – KX23046) (fig. 3) of the barcode sequence from the second species from China were obtained, with two or four nucleotides differing between them. Haplotype GFC1 was shared by nine, GFC2 by six, and GFC3 by five specimens out of the total of 20 analyzed.
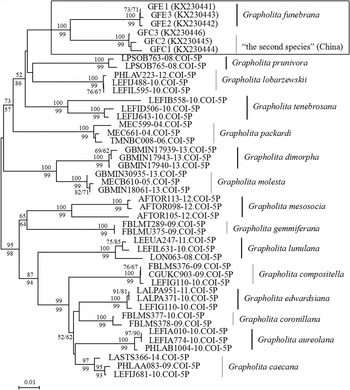
Neighbor-joining tree based on the 658 bp barcode region of the mitochondrial COI for ‘the second species’ from China and G. funebrana from Europe as well as for 14 further Grapholita species. Bootstrap values with 10000 replicates are given. The box points out the phylogram of ‘the second species’ from China and G. funebrana from Europe. GFE1 – GFE3 (with GenBank accession number in parentheses) indicate Grapholita funebrana COI sequences of European samples obtained in this analysis; GFC1 – GFC3 (with GenBank accession number in parentheses) indicate COI sequences ‘the second species’ from Chinese samples obtained in this analysis; BOLD Systems IDs indicate 658 bp COI barcode sequences of 14 further Grapholita species included; the number above each branch is bootstrap value (%), the number below each branch indicates support from standard error test (in exceptional cases with insufficient space available, this former value is given before ’/’ and the latter value is given after ’/’).

Phylogenetic relationships of ‘the second species’ from China and G. funebrana from Europe as well as 14 further Grapholita species are shown in the Neighbor-joining tree based on the 658 bp mitochondrial COI gene barcode region (fig. 3). Three branches were noted according to the 14 further Grapholita species, plus G. funebrana from Europe and ‘the second species’ from China. The two latter species were found to be included in two adjacent subbranches of the same branch, with a bootstrap value of 100% (fig. 3).
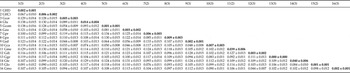
Among the 24 models, the Juke-Cantor (JC) substitution model showed the lowest BIC value of 81. The JC model was selected for analysis. The estimated inter-specific genetic distances based on the COI sequences among the Grapholita species were from 0.033 to 0.138 (table 2). The genetic distance between G. funebrana from Europe and ‘the second species’ from China was high with a value of 0.067, indicating (together with the morphological results above) a cryptic species in G. funebrana.
Pairwise genetic distances (mean ± SE) of Grapholita species by the barcode region of COI gene sequence estimated using the Juke-Cantor (JC) model.

The values in the diagonal (in bold) indicate intra-specific distances, the values below the diagonal indicate mean inter-specific distances obtained by bootstrap procedure (1000 replicates) as implemented in MEGA 6.0. Gf(E), Grapholita funebrana from Europe; Gf(C), ‘the second species’ identified as cryptic species of Grapholita funebrana from China; Gcor, Glu, Gcom, Gau, Gpr, Gpa, Ged, Gca, Cme, Gdi, Gge, Gte, Glo and Gmo indicate G. coronillana, G. lunulana, G. compositella, G. aureolana, G. prunivora, G. packardi, G. edwardsiana, G. caecana, G. mesosocia, G. dimorpha, G. gemmiferana, G. tenebrosana, G. lobarzewskii and G. molesta, respectively. The digital numbers in the parentheses indicate the numbers of barcode sequences used for analysis.
Genetic variation and genetic diversity
To gain insight into the genetic diversity of this cryptic species in G. funebrana from China, we analyzed the genetic variation of 133 individuals sampled from seven locations, based on 740 bp COI gene sequences and 683 bp COII gene sequences. A total of 71 COI haplotypes and 57 COII haplotypes were obtained, and no premature stop codon was found in the COI and COII haplotypes. The average nucleotide frequencies of A, T, G and C were 32.3, 37.9, 13.6 and 16.2% for COI, and 36.5, 38.6, 11.1 and 13.8% for COII. Similar to mitochondrial gene sequences of other insect species, the high base composition of the two genes was biased toward As and Ts (70.2% of COI and 75.1% of COII) (Zheng et al., Reference Zheng, Peng, Liu, Pan, Dorn and Chen2013). There were 64 variable sites for COI gene sequences, 25 of which were parsimony informative, whilst there were 49 variable sites for COII gene sequences, 19 of which were parsimony informative.
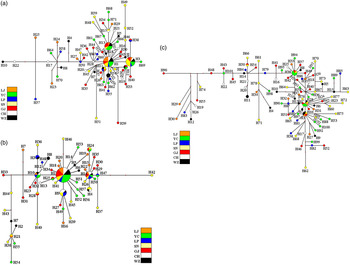
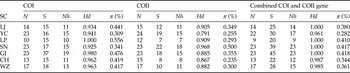
The number of COI and COII haplotypes was extremely high. The number of haplotypes (Nh) from each sampling location ranged from 11 to 19 for COI gene, from 7 to 18 for COII gene, and from 9 to 23 for the combined COI and COII gene (table 3, fig. 4). For COI gene, eight of the 71 haplotypes were shared between samples from different locations, and the other 63 were private in samples from the same location (fig. 4a). For COII gene, 12 of 57 COII gene haplotypes were shared between samples from different locations, and the other 45 COI haplotypes were private in one location (fig. 4b). For the haplotypes of the combined COI and COII gene, four of the 102 haplotypes were shared, and the other 98 were private in one location (fig. 4c). The haplotype diversity (Hd) was remarkably high ranging from 0.925 to 1.000 for COI, from 0.791 to 0.968 for COII, and from 0.961 to 1.000 for the combined COI and COII gene. The per location nucleotide diversity (π) for COI was between 0.309 and 0.556% for COI, between 0.235 and 0.500% for COII, and between 0.282 and 0.418% for the combined COI and COII gene (table 3).
Median-joining network based on both COI (a), COII (b), and the combined COI and COII haplotypes of the cryptic species of G. funebrana (= ‘the second species’) sampled in the region. Each circle represents a haplotype, and the area of a circle is proportional to the number of observed individuals. Colors within the nodes refer to different locations: orange, Lijiayuan; green, Yucun; blue, Linping; yellow, Shiniucun; red, Guojiayuan; white, Chunhua; black, Wangzhuang. The red dot represents missing haplotypes.

Genetic diversity of the cryptic species in G. funebrana (= ‘the second species’) as revealed by mitochondrial COI gene and COII gene.

SC, sample code; N, sample size; S, number of polymorphic sites; Nh, number of haplotypes; Hd, haplotype diversity; π, nucleotide diversity.
The networks of the COI and COII haplotypes are shown in fig. 4. Two COI haplotypes (H1 and H3), two COII haplotypes (H1 and H11), and one haplotype (H1) of the combined COI and COII gene were shared by samples from all locations (fig. 4). Nineteen individuals shared the H1 haplotype of COI, and 16 individuals shared the H3 haplotypes of COI. The H1 haplotype of COII gene was shared by 44 individuals, whilst the H11 haplotype of COII gene was shared by 10 individuals. For the haplotypes of the combined COI and COII gene, nine individuals shared the H1 haplotype. Eight individuals shared both the COI H1 haplotype and the COII H1 haplotype, and five individuals shared both the COI H3 haplotype and the COII H1 haplotype.
Population expansion
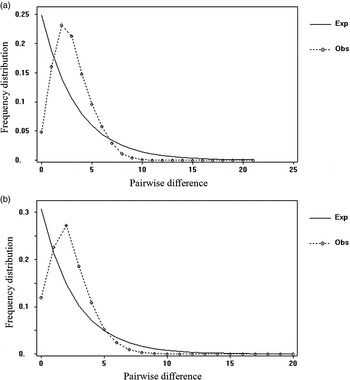
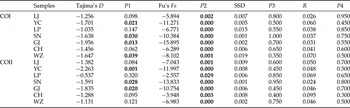
The Tajima's D and Fu's Fs neutrality test values were negative in all samples. The P values of Fu's Fs test were statistically significant, whilst some of those in Tajima's D test were non-significant. The SSD values ranged from 0.001 to 0.019 for COI and 0.001 to 0.009 for COII, and raggedness statistic values ranged from 0.026 to 0.070 for COI and 0.024 to 0.095 for COII. No significant P value was found for SSD values and raggedness statistic values (table 4). The expected mismatch distributions for both COI and COII gene sequences were unimodal, as shown in fig. 5.
Demographic history of mismatch distributions for the cryptic species of G. funebrana (= ‘the second species’) sampled in the region using COI (a) and COII (b) gene sequences. The dashed line represents the observed frequency distribution, while the solid line shows the expected frequency distribution.

Parameters of neutrality test and mismatch distribution of the cryptic species in G. funebrana (= ‘the second species’) based on mitochondrial COI gene and COII gene sequence.

SSD, the sum of the square deviations; R, raggedness statistics; P1, P2, P3 and P4 are the P values of Tajima's D neutrality test, Fu's Fs neutrality test, SSD, and raggedness statistics, respectively. Values in bold indicate statistical significance (P < 0.05).
Discussion
In this study designed to gain a deeper insight into the genetic diversity of Grapholita moths in a Chinese region with extended apple cultivation, we found a second species in addition to G. molesta, which was the target species of the pheromone traps used, and we found this second species trapped at an unexpectedly high proportion. It was morphologically indistinguishable from G. funebrana, yet discrepancy in host plant association encouraged us to continue with investigations on its genetic diversity. We decided to focus on the respective novel findings here, and to publish the results on G. molesta genetic diversity elsewhere (Zheng et al., Reference Zheng, Qiao, Wang, Dorn and Chen2015). Based on genetic distances in the barcode region of COI gene (Hebert et al., Reference Hebert, Cywinska, Ball and deWaard2003; Behere et al., Reference Behere, Tay, Russell, Heckel, Appleton, Kranthi and Batterham2007), we conclude that the second species trapped is a cryptic species in G. funebrana. As both G. funebrana and this second species clustered together in the Neighbor-jointing tree presented for many Grapholita species, this second species can be considered a sibling species of G. funebrana (sensu Bickford et al., Reference Bickford, Lohman, Sodhi, Ng, Meier, Winker, Ingram and Das2007). For the first time, we provide a detailed molecular analysis of this species, which is likely native to China.
Field trapping and morphology
Morphological traits in adult G. molesta are known to be similar to those of other tortricids, particularly to those of G. funebrana (Hrdý et al., Reference Hrdý, Kocourek, Beranková and Kuldová1996; Choi et al., Reference Choi, Lee, Lee, Kim and Kim2008). We anticipated a high specificity of the pheromone trap used, as observed for G. molesta trapping before in another Chinese province (Zheng et al., Reference Zheng, Peng, Liu, Pan, Dorn and Chen2013; M.H. Chen personal observation), and in Korea with a mixture of the same three attractive acetates combined at a similar ratio (Yang et al., Reference Yang, Jung, Han, Boo and Yiem2002). The commercially available trap used in the current study, however, attracted a species with similar morphology as the target moth. Standard genitalia dissection showed that it has the same external morphology as the plum moth G. funebrana, a species widely distributed throughout Europe, and occurring also in Northwestern Africa and in Asia (Woo, Reference Woo1961; Barcenas et al., Reference Barcenas, Unruh and Neven2005; EPPO, 2007). The morphological features of that fruit damaging tortricid collected from plum had been described in China (Jilin Province) more than half a century ago (Woo, Reference Woo1961), however, to the best of our knowledge, no intensive study has been done on this species in China.
Typically, non-target tortricid captures are low in pheromone traps optimized for monitoring purpose (Toth et al., Reference Toth, Sziraki, Szocs and Saringer1991; Dickler et al., Reference Dickler, Theinert and Rauleder2004; Olenici et al., Reference Olenici, Capuse, Olenici, Oprean and Mihalciuc2007). However, there are exceptions (e.g. Jung et al., Reference Jung, Ahn, Eom, Seo and Kim2012) such as in our field survey, where captures of a distinct non-target species could account for up to two thirds of the total tortricid individuals trapped. In fact, the three pheromone constituents in the G. molesta trap used, (Z)-8-dodecen acetate (Z8-12: Ac), (E)-8-dodecen acetate (E8-12: Ac) and (Z)-8- dodecenol (Z8-12: OH), are also constitutes of the natural pheromone released by G. funebrana females, accounting there for a proportion of 75% of the total blend composed of five compounds (Guerin et al., Reference Guerin, Arn, Buser, Charmillot, Toth and Sziraki1986). Such overlapping pheromone profiles (El-Sayed, Reference El-Sayed2014) might underlie the trapping of related non-target species (Jung et al., Reference Jung, Jung and Kim2013).
‘The second species’ in our work had two flight peaks in the study region, whilst G. molesta proved to be trivoltine. As for the tortricid G. funebrana, two to three generations have been observed per season in China, depending on climatic conditions (Woo, Reference Woo1961; Kang et al., Reference Kang, Zhang, Sun, Lu and Guo1989). However, throughout its distribution range, this tortricid has been recovered from stone fruit, and not from apple orchards, which made us doubt about the identity of the ‘second species’ trapped. Already in 1850, a descriptive natural science paper emphasized that G. funebrana is a herbivore of Prunus species, and distinct from fruit feeding tortricids on apple (Troschel, Reference Troschel1850). The wild host of G. funebrana is Prunus spinosa (USDA, Reference Whitehead and Whittle1984), a plant native to Europe.
Cryptic species in G. funebrana
Insect species can be misidentified due to lack of obvious divergence in morphological characters (Hebert et al., Reference Hebert, Penton, Burns, Janzen and Hallwachs2004a ; Yang et al., Reference Yang, Landry, Handfield, Zhang, Alma Solis, Handfield and Hebert2012). The use of DNA-based techniques can provide resolution to the boundaries of morphological information (Svensson et al., Reference Svensson, Wang, Lassance, Anderbrant, Chen, Gregorsson and Loefstedt2013). In the current study, we examined specimens of G. funebrana from Europe comparatively with ‘the second species’ from China. Interestingly, sequence analysis of the COI mtDNA gene region provided, together with the morphological findings presented above, evidence for a cryptic species in G. funebrana from apple orchards in Shaanxi Province, China. In fact, genetic distance between G. funebrana from Europe and the specimens from China amounted to a value as high as 6.7%, with a divergence higher than 3.0%, which was proposed for delineating different Lepidoptera species (Hebert et al., Reference Hebert, Cywinska, Ball and deWaard2003). In the gorse pod moth Cydia succedana (Denis and Schiffermüller) (Lepidoptera: Tortricidae), sequence analysis of the COI mtDNA gene region provided no evidence for cryptic species associated with different host plants (Paynter et al., Reference Paynter, Gourlay, Oboyski, Fowler, Hill, Withers and Hona2008). A sequence divergence of less than 0.5% among individuals reported in that study is concordant with natural variation within a species, i.e. with intra-specific divergence (Moore, Reference Moore1995). In a further tortricid, the spruce seed moth C. strobilella, COI mtDNA analysis showed an average genetic distance of 7.7% between two clusters, indicating various cryptic species complexes (Svensson et al., Reference Svensson, Wang, Lassance, Anderbrant, Chen, Gregorsson and Loefstedt2013). In line with those further studies on tortricids, our study demonstrates that COI, a relatively rapidly-evolving gene, is highly suitable for delineating species, and for detecting cryptic species of Lepidoptera.
Previously reported deviating host plant associations suggest the potential occurrence of further cryptic species in G. funebrana. Interestingly, the Russian taxonomist Danilevski (Reference Danilevski1958) postulated that G. funebrana from the Far Eastern territory of the former Soviet Union might represent a ‘race’ different from the European ‘race’. The two ‘races’ could not be distinguished by male genitalia, but their host plant association differed: whereas the ‘race’ from the Far East included cherry (Cerasus sp.) into its diet range, this was not the case for the European ‘race’, which fed only on various Prunus spp. fruits. Importantly, apple, which occurred in the region of the former Soviet Union studied, was not a reported host of G. funebrana (Danilevski, Reference Danilevski1958).
Genetic diversity
Samples from all locations in the study region displayed extremely high numbers of mitochondrial haplotypes in the cryptic species in G. funebrana, with 71 COI gene haplotypes and 57 COII gene haplotypes found in the 133 specimens analyzed. Moreover, a large number of those haplotypes was private, occurring only at a single location. Hence, this haplotype diversity exceeded even the high value of 56 of 127 samples reported for the joint COI-COII genes in the light brown apple moth Epiphyas postvittana (Walker) (Lepidoptera: Tortricidae) (Tooman et al., Reference Tooman, Rose, Carraher, Suckling, Paquette, Ledezma and Newcomb2011). In both these tortricid species, the high levels of hapolotype diversity are indicative of the native range.
The average number of COI haplotypes in the cryptic species in G. funebrana was with 0.76 approximately 3.5 times higher than for the respective number in G. molesta (averaging at 0.22) trapped in the same apple growing region. The average number of COII haplotypes in the cryptic species in G. funebrana was with 0.64 approximately twice as high as for the respective number in G. molesta (averaging at 0.35) (Zheng et al., Reference Zheng, Peng, Liu, Pan, Dorn and Chen2013). Most haplotypes of COI and COII were private in G. molesta as in the cryptic species in G. funebrana. G. molesta is a proven native species in the sampling region (Zheng et al., Reference Zheng, Peng, Liu, Pan, Dorn and Chen2013, Reference Zheng, Qiao, Wang, Dorn and Chen2015), and apparently, the same applies for the cryptic species in G. funebrana: China lies in its region of origin.
Population expansion
General indications of population expansion can be derived from negative values gained from neutrality test methods of Tajima's D and Fu's Fs (Tajima, Reference Tajima1989; Fu, Reference Fu1997). Together with the non-significant P value of SSD and raggedness statistic analysis (R), the high genetic diversity, and the negative values of Tajima's D and Fu's Fs, our analysis suggests that the cryptic species in G. funebrana passed through a recent population expansion (Ramos-Onsins & Rozas, Reference Ramos-Onsins and Rozas2002; de Jong et al., Reference de Jong, Wahlberg, van Eijk, Brakefield and Zwaan2011). In addition, the mismatch distribution among haplotypes was smooth and unimodal, further supporting the expansion hypothesis for this species (Slatkin & Hudson, Reference Slatkin and Hudson1991; Meng et al., Reference Meng, Shi and Chen2008). Finally, the distribution of haplotypes H1 and H11 for COI gene and haplotypes H1 and H3 for COII gene in all locations, provide an additional support for the suggested population expansion of this tortricid species (Slatkin & Hudson, Reference Slatkin and Hudson1991; Sezonlin et al., Reference Sezonlin, Dupas, Le Rü, Le Gall, Moyal, Calateyud and Silvain2006). As we concluded above that the cryptic species in G. funebrana appears to be native to the sampling region that is growing apple in extended orchards only since the last century (Gao et al., Reference Gao, Zhao, Liang and Wang2008), this proposed recent population expansion may be associated with the quick growth of apple cultivation there.
Conclusion and future perspectives
By integrating morphological and molecular methods, we detected a cryptic species of Grapholita in an extended apple growing area of China. It can be considered a sibling species of G. funebrana. This novel finding is the starting point for a broad spectrum of future investigations. They should include studies on the life history of this species, a particularly challenging topic as fruits are intensively treated against herbivores using mechanical (fruit-bagging) and chemical methods throughout the region. Then, the likely pest status of this tortricid should be established, and as this species may have been overlooked in other regions as well, its geographic distribution should be explored.
Acknowledgements
We thank Prof. em. Dr Willi Sauter (ETH Zurich), Prof. Dr Chun-Sen Ma (Chinese Academy of Sciences) and Prof. Dr Zhaofu Yang (Northwest A&F University) for help with the morphological identification of tortricid specimens, Prof. Dr František Marec (Biology Centre CAS, Czech Republic) and Dr Andreas Müller (ETH Zurich) for supply of insect specimens, and Prof. Baozhen Hua, Prof. Dr Victoria Soroker and Dr Kathrin Tschudi-Rein and four anonymous reviewers for useful comments to the manuscript. This work was supported by grants of the Joint Project of Northwest A&F University and ETH Zurich, the National Natural Science Foundation of China (Nos. 31071687, 31272036, and 31471766), the National Key Technology R&D Program of the Ministry of Science and Technology (No. 2012BAK11B03), the Doctoral Fund of Ministry of Education of China (20110204110001), and the Coordinated Research Project (CRP) (No. 20559) of the International Atomic Energy Agency.