


Mastitis and lameness still remain the most frequent and costly diseases in the dairy industry in terms of economics and animal welfare (Kramer et al. Reference Kramer, Cavero, Stamer and Krieter2009). Early detection and intervention of mastitis and lameness reduces losses in milk yield, veterinary fees and losses in milk quality, and increases the cure rate of the infected animals (Milner et al. Reference Milner, Page and Hillerton1997). With growing herd sizes and the introduction of robotic milking, the classical detection method of visual observations has become more difficult and time-consuming. Thus, there is a need to support the farmer's observations by applying improved and automated detection of diseases (de Mol et al. Reference de Mol, Kroeze, Achten, Maatje and Rossing1997). Automated detection is possible using sensor measurements and information from a Management Information System (MIS). Information from the MIS is useful for judging potential causes of aberrations. Much research has been done on the development of sensors and appropriate models to detect diseases. For mastitis detection, milk parameters (such as milk yield, milk electrical conductivity) have been used (Cavero et al. Reference Cavero, Tölle, Henze, Buxadé and Krieter2008; Lukas et al. Reference Lukas, Reneau, Wallace, Hawkins and Munoz-Zanzi2009). For lameness detection, on the other hand, the activity of cows has been used (Kramer et al. Reference Kramer, Cavero, Stamer and Krieter2009). Recently, feed intake and its corresponding behaviour have been reported to be linked to a cow's health status (Gonzalez et al. Reference Gonzalez, Tolkamp, Coffey, Ferret and Kyriazakis2008; Lukas et al. Reference Lukas, Reneau and Linn2008). However, only single variables are often looked at in detection models or different variables are considered successively. A disease may nevertheless influence milk yield, cow activity and feed intake. Therefore, examining one of these variables at a time as though it was independent, makes interpretation and diagnosis difficult (Kourti & MacGregor, Reference Kourti and MacGregor1995). This suggests that the results of a detection model may be improved by combining all of the variables and transforming them into useful information for the herdsmen (de Mol et al. Reference de Mol, Kroeze, Achten, Maatje and Rossing1997; Cavero et al. Reference Cavero, Tölle, Henze, Buxadé and Krieter2008; Kramer et al. Reference Kramer, Cavero, Stamer and Krieter2009).
Several studies have attempted to develop a multivariate scheme which would allow early disease detection based on cow monitoring. For mastitis detection, for example, Kamphuis et al. (Reference Kamphuis, Mollenhorst, Feelders, Pietersma and Hogeveen2010) used decision trees. Cavero et al. (Reference Cavero, Tölle, Henze, Buxadé and Krieter2008) applied neural networks to monitor udder health whereas Pastell & Kujala (Reference Pastell and Kujala2007) used this method for lameness detection. Additionally, Kramer et al. (Reference Kramer, Cavero, Stamer and Krieter2009) exerted fuzzy logic for mastitis as well as lameness detection. Although high levels of sensitivities and specificities were reported, few of these models have been implemented in practical monitoring owing to too high error rates. Additionally, a large number of false positive alerts provided by MIS hinder their application in practice (Hogeveen et al. Reference Hogeveen, Kamphuis, Steeneveld and Mollenhorst2010). Thus, there is a strong need for improvement of the performance of analytical detection models so that they do not remain the weakest link in automated disease detection.
Latent structure methods are used effectively for fault detection in chemical and industrial process control (Kourti, Reference Kourti2002; Choi et al. Reference Choi, Lee, Lee, Park and Lee2005). One approach that has proved particularly powerful is the use of principal component analysis (PCA) combined with Hoteling's T 2 and residual monitoring charts since it allows an extension of the principles of univariate statistical process monitoring (e.g. control charts) to monitor multivariate processes (Choi et al. Reference Choi, Lee, Lee, Park and Lee2005; Kourti, Reference Kourti2006). PCA is able to simultaneously divide all the data information into significant patterns, such as tendencies or directions, and into uncertainties, such as noises or outliers. Thus, PCA reduces the problem of discriminating between the process variables and of identifying new sets of variables which characterise all of the prior information (Burstyn, Reference Burstyn2004).
Therefore, the aim of this study was to explore PCA combined with control charts (T 2 and residual charts) for the early detection of mastitis and lameness in dairy cows.
Materials and methods
Data
Data used were recorded on the Karkendamm dairy research farm between August 2008 and December 2010. For mastitis and lameness detection, about 66 000 cow-days from 338 and 315 cows in their first 200 d in milk (DIM) were analysed, respectively. Milk electrical conductivity, milk yield and feeding patterns (feed intake, number of feeding visits and time at the trough) were used for recognition of mastitis. Pedometer activity and feeding patterns were utilised for lameness detection. Milking took place in a rotary milking parlour manufactured by GEA Farm Technologies. Cows were milked twice daily. Milk yield (MY) and milk electrical conductivity (MEC) were measured using the Metatron P21 milk meter (GEA Farm Technologies) for each cow at every milking. Activity was measured using pedometers (GEA Farm Technologies), which recorded activity in 2-h periods. Average daily activity rates per hour were calculated to account for the diurnal rhythm. Furthermore, high pedometer activity due to documented and progesterone-measured oestrus events was excluded from the dataset. Progesterone was measured at every milking and analysed at a laboratory. One to three days (depending on each cow) of high activity around insemination or measurement were excluded. High activity without insemination or progesterone confirmation was not excluded but stands for normal behaviour. The feeding trough was developed and installed by the Institute of Animal Breeding and Husbandry, University of Kiel. Each visit to the feeding troughs was recorded and the amounts of consumed feed (forage) were accumulated to daily intakes. Extreme values (mainly for the trait feed intake) which deviated by more than ±4×sd were excluded from the dataset.
Medical treatments of diseases were documented constantly by veterinarians and farm staff. Different categories for mastitis (e.g. Staphylococcus areus or Escherichia coli mastitis) and for lameness (e.g. digital dermatitis or sole ulcer) were identified. Owing to the low number of diseased cows within these categories, the categories were combined to form cases of mastitis and lameness, respectively. The occurrence of both cases at the same time was possible. These cases were defined as the target characteristic to be distinguished from the healthy observation in the data.
Application of PCA necessitates the division of the mastitis and lameness dataset, respectively, into training (randomly selected healthy cows during their 200 DIM) and test datasets (remaining healthy and ill cows). For a sufficiently large training dataset, 100 cows without any cases of mastitis or lameness during their first 200 DIM (Aapo Hyvärinen, personal communication, October 15, 2011) were randomly selected in each dataset (mastitis and lameness), respectively (Table 1). Thus, the remaining 238 cows for the test dataset of mastitis were used, incorporating 138 cows without any mastitis treatment during their first 200 DIM as well as 100 cows which were treated for mastitis during this observation period. In the case of the test dataset for lameness detection, 73 healthy and 142 infected cows were used. Descriptive statistical information on the traits for the training and test datasets with regard to their use in mastitis or lameness detection are also shown in Table 1.
Means of the analysed indicator variables for the training and test datasets of lameness and mastitis detection (sd in parenthesis)

† Milk electrical conductivity
Disease definition
Diseases were defined as disease blocks, i.e. an uninterrupted sequence of ‘days of disease’ (Cavero et al. Reference Cavero, Tölle, Henze, Buxadé and Krieter2008; Kramer et al. Reference Kramer, Cavero, Stamer and Krieter2009). Recorded treatments served as a basis for these disease blocks and the different definitions varied solely in the sequence length of the blocks. As the focus of this study was on early disease detection, only the days before the first treatment were included in a disease block (Kramer et al. Reference Kramer, Cavero, Stamer and Krieter2009). If at least one alarm was generated by the monitoring system within the block, it was considered as detected.
Mastitis definition
Cows were selected for veterinary treatment by the farm staff based on observable signs of mastitis infection. Two variants of mastitis definition were used in this study:
Mastitis+3: treatment performed including three days before the treatment
Mastitis+4: treatment performed including four days before the treatment
The days in the dataset were classified as ‘days of health’ or ‘days of disease’ according to Cavero et al. (Reference Cavero, Tölle, Rave, Buxadé and Krieter2007). The day of treatment as well as three or four days before was defined as ‘days of disease’, respectively. To give consideration to the withdrawal period without any observation, at least seven days after the last treatment of a mastitis case were not utilised for the analysis. After this period, cows were considered to be healthy. For early mastitis detection the days before treatment were analysed. The data contained 115 disease blocks.
Lameness definition
For veterinary treatment, lame cows were also selected by the farm staff based on observable signs. Lameness was defined using disease blocks analogous to the mastitis definitions. The different definitions varied in the length of the disease blocks.
Lame+3: day of treatment including three days before the treatment
Lame+5: day of treatment including five days before the treatment
Lame+7: day of treatment including seven days before the treatment
All medicated cows were again observed by a veterinarian one week after treatment. Thus, all days between treatment and another examination were set to ‘days of disease’. If the follow-up examination proved negative, cows were considered healthy. Otherwise, the lameness block had to be lengthened until the infected animals were considered to be healthy as judged by the veterinarian. For the analysis, solely the days before the first treatment were used. The data contained 210 disease blocks.
Methods
Methodology of principal component analysis
Principal component analysis is a multivariate technique, also referred to as a latent variable method or projection method (Abdi & Williams, Reference Abdi and Williams2010). Its goal is to extract the important information from a number of possibly correlated variables and to represent it as a set of new uncorrelated and fewer variables, called principal components (PC). The first PC accounts for as much of the variability in the data as possible, and each succeeding component accounts for as much of the remaining variability as possible.
In theory, PCA considers a mean-centred and scaled dataset, X, with n observations on k variables (mastitis dataset: k = 5; lameness dataset: k = 4). The first PC (t 1) showing maximum variance is defined as the linear combination t 1 = Xp 1. The second PC (t 2 = Xp 2) has the next greatest variance and subject to the condition that it is uncorrelated with t 1 (Kourti, Reference Kourti2002; Montgomery, Reference Montgomery2009). Up to k PCs are similarly defined. The p i's are constants to be determined (principle component loadings) using eigenvectors (special set of vectors associated with a linear system of equations, i.e. a matrix equation) of the covariance matrix of X. Figure 1 gives a simplified schematic interpretation of the method using the mastitis detection variables as an example and by means of one cow. There are five variables in a continuous process (x 1 = MY, x 2 = MEC, x 3 = feed intake, x 4 = time at the through, x 5 = number of visits). Variables x 3, x 4 and x 5 are more correlated with each other, while variable x 1 is more correlated with x 2. New variables are calculated using PCA. The first principal component t 1 is a weighted average of x 3, x 4 and x 5, while the second component, t 2, is a weighted average of x 1 and x 2.
PCA and dimensionality reduction, based exemplarily on the indicator variables for mastitis detection and on one cow. The principal components t 1 and t 2 use the correlation of five variables (x 1 = milk yield, x 2 = milk electrical conductivity, x 3 = feed intake, x 4 = time at the through, x 5 = number of visits) and break the detection process into two uncorrelated variables.

There are no firm guidelines on how many PCs have to be retained (Montgomery, Reference Montgomery2009). Sufficient components to explain a reasonable proportion of the total process variability (70% and higher) should be taken into account (Choi et al. Reference Choi, Lee, Lee, Park and Lee2005; Kourti et al. Reference Kourti, Brown, Tauler, Walczak, Brown, Tauler and Walczak2009). The first two PCs incorporated 79% of the variance for mastitis detection, whereas t 1 (weighted average of the feeding patterns) and t 2 (pedometer activity) explained 87% of the process variance for lameness monitoring. Thus, both processes were reduced to the first two PCs.
Process monitoring and on-line disease detection
The procedure described above is used to establish a PCA model based on historical data collected when only common cause variation was present (training dataset, healthy cows only) (MacGregor et al. Reference MacGregor, Yu, García Muñoz and Flores-Cerrillo2005) (Fig. 2, off-line training). Any periods containing variations arising from special events (e.g. disease) which one would like to detect in the future are theoretically omitted at this stage (Kourti, Reference Kourti2002). New multivariate observations (X new) can then be referenced against this ‘in-control’ model using the PCA loading vectors to obtain their new PCs (t i,new = p iX new) (Fig. 2, on-line monitoring).
Procedure of the principal component analysis (PCA) model construction and calculation of (new) principal components (PC(new)). On-line monitoring was based on Hotelling's T 2 [T 2(new) = (new) values of this chart] and residual [SPE(new) = (new) values of the residual chart] control charts with the corresponding control limits used (T 2lim, SPElim).

Two complementary multivariate control charts are required for process monitoring using projection methods such as PCA (MacGregor et al. Reference MacGregor, Yu, García Muñoz and Flores-Cerrillo2005; Kourti, Reference Kourti2006) (Fig. 2). The first is the Hoteling's T 2 chart on the remaining PCs.
 $$T_{i,{\rm new}\;} ^2 -3 =-1 \mathop \sum \limits_{i = 1}^l \displaystyle{{t_{i,{\rm new}}^2} \over {s_{t_i} ^2}} $$
t i,new incorporates the new PCs from the PCA model whereas  $s_{t_i} ^2 $ is the variance of the corresponding estimated latent variables (t i) in the training dataset. This chart will check whether new observations of the measured variables are within the limits (Fig. 2) determined by the training data. These upper control limits (UCL, threshold value) are obtained using the F-distribution of the training data (MacGregor & Kourti, Reference Kourti and MacGregor1995).
 $$T_{\lim} ^2 = \displaystyle{{(n - 1)(n + 1)l} \over {n(n - l)}}F_{\rm \alpha} (l,n - l; {\rm \alpha} )$$
where F α(l, n−l) is the upper 100α% critical point of the F-distribution with l and n−l degrees of freedom (l: number of PCs; n: sample number) with level of significance α (MacGregor & Kourti, Reference Kourti and MacGregor1995). It was mentioned above that the PCs explain the main variability of the data. The variability which cannot be explained forms the residuals (squared prediction error, SPE). This residual variability is also monitored and a control limit for typical operation is established. By monitoring the residuals, it is tested whether the unexplained disturbances of the system remain similar to the ones observed when the model was derived. If a totally new type of special event (e.g. mastitis or lameness event) occurs which was not present in the training data, then new PCs will appear and the new observations x i,new will not be in the defined range of the PCA model (Fig. 2). The SPE can be computed by
 $${\rm SPE}_{i,{\rm new}}-2 =-1 \mathop \sum \limits_{i = 1}^k (x_{i,{\rm new}} - \hat x_{i,{\rm new}} )^2 $$
where  $\hat x_{i,{\rm new}}-2 = p_{i{\rm}} t_{i,{\rm new}} $. The upper control limit for the SPE chart (SPElim) is given by
 $${\rm SPE}_{\lim}-2 =-1 ({ s}/2{ m}){\rm \chi } _{\rm \alpha} ^2 (2m^2 /{ s})$$
where m and s are the sample mean and variance of the SPE values from the training data (Zhang et al. Reference Zhang, Zhou and Qin2010). In the current study, the level of α in both (T 2 and SPE) UCLs was varied from 99·9 to 50% in order to observe the performance of the monitoring system. The last step of this monitoring system is to check whether T i,new2 and SPEi,new are within the limits of the T 2 or SPE chart (healthy) or not (ill) (Fig. 2). Figure 3 shows an example of a T 2 and an SPE control chart on one cow for mastitis monitoring during its 200 DIM. All these calculations were computed using Matlab software (Matlab, 2010).
Example of a Hoteling's T 2 (T 2) and standard prediction error (SPE) control chart on one cow for mastitis detection. The measurements collected from the indicator variables at each time point are translated into one point on the T 2 chart and one point on the SPE chart. The cow will be classified as ill if either the control limit of the T 2 or SPE chart is passed.

Test procedure
The system described (PCA combined with T 2 and residual charts) provided an alert whenever values above the UCL of the charts occurred (Fig. 3). System performance was assessed by comparing these alerts with the actual occurrence of disease.
The corresponding day of observation was classified as true positive (TP) if the threshold was exceeded on a day of disease, while an undetected day of disease was classified as false negative (FN). Each day in a healthy period was considered as a true negative case (TN) if no alerts were generated, and as false positive case (FP) if an alert was given. The accuracy of these procedures was evaluated by the parameters sensitivity, block sensitivity, specificity and error rate. Sensitivity represents the percentage of correctly detected days of disease of all days of disease:
 $${\rm sensitivity}\; {\rm (\% ) =} \displaystyle{{{\rm true\; positive}} \over {{\rm true\; positive + false\; negative}}}{\rm \times 100}$$
For disease detection, it was not important for all days of a disease block to be recognised, but it was crucial for mastitis or lameness to be detected at all and early on. Therefore, the block sensitivity was deemed considerably more important than sensitivity. For the block sensitivity, each disease block was considered a TP case if one or more alerts were given within the defined disease block before the first treatment and an FN case otherwise (Cavero et al. Reference Cavero, Tölle, Rave, Buxadé and Krieter2007; Kramer et al. Reference Kramer, Cavero, Stamer and Krieter2009).
The specificity indicates the percentage of correctly found days of health from all the days of health:
 $${\rm specificity}\; {\rm (\% ) =} \displaystyle{{{\rm true\; negative}} \over {{\rm true\; negative + false\; positive}}}{\rm \times 100}$$
The error rate represents the percentage of days outside the disease periods from all the days where an alarm was produced:
 $${\rm error\; rate}\; {\rm (\% )}\; = \displaystyle{{{\rm false\; positive}} \over {{\rm false\; positive + true\; positive}}}{\rm \; \times 100}$$
In addition, the number of true positive (TP) as well as false positive (FP) cows per day is given. TP and FP cows per day signify the average number of rightly and wrongly diseased-registered cows per day, respectively.
One statistical tool for assessing the accuracy of diagnostic predictions, i.e. the ability to differentiate between healthy and ill correctly, is ROC (receiver operating characteristic) curves combined with the area under the curve (AUC) as an important index (Cavero et al. Reference Cavero, Tölle, Rave, Buxadé and Krieter2007; Mollenhorst et al. Reference Mollenhorst, van der Tol and Hogeveen2010). The calculated sensitivities and specificities can be plotted with respect to cut-off levels (upper control limit values). In such plots or ROC curves, the false positive fraction (1−specificity) is at the X-axis while the sensitivities form the Y-axis. It is often useful to enhance ROC curve plots with the inclusion of an angle bisector (Fig. 4). The steeper the curve (more distant from the angle bisector), the greater is the accuracy. Besides the visual information on accuracy which a ROC curve creates, it is desirable to produce quantitative summary measures such as the area under the ROC curve (AUC). The closer AUC moves to 0·5, the poorer the test performs. The closer AUC lies to 1, the better the test is able to differentiate between healthy and ill.
Receiver operating characteristic (ROC) curves for mastitis and lameness detection depending on the definitions used. The respective area under the curve (AUC) is stated in parenthesis below the curves.

Results
PCA combined with the control charts for mastitis detection showed similar ROC curves for the mastitis definitions considered whereas the definitions used for lameness detection produced different accuracies (Fig. 4). Overall, ROC curves of mastitis detection provided higher accuracies than for lameness detection. The AUC values also given in Fig. 4 (parenthesis) show that for mastitis detection the values are close to 1 (0·9) whereas for lameness detection the AUC values ranged between 0·6 and 0·8.
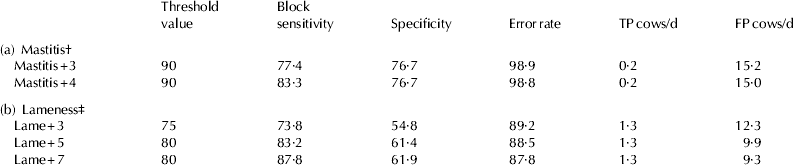
The optimal threshold value can be chosen depending on the use of the method determining whether a high sensitivity or a high specificity is desired. In this study, the block sensitivity was set to be at least 70%. Table 2 shows the results of mastitis (2a) and lameness detection (2b) depending on the disease definitions and requiring a block sensitivity of least 70%. In addition to (block) sensitivity, specificity and error rate, the average true positive and false negative cows per day were also determined. These two variables indicated the number of cows per day classified rightly or wrongly as diseased, respectively, and thus illustrates the monitoring systems’ effort with regard to mastitis or lameness monitoring.
Results of mastitis (a) and lameness detection (b) depending on the disease definitions and requiring a block sensitivity of least 70%
† Average herd size: 56 cows per day
‡ Average herd size: 47 cows per day
Mastitis+3 reached a block sensitivity of 77·4% whereas the block sensitivity of Mastitis+4 was 83·3% (Table 2a). The specificity of both mastitis definitions were at 76·7%. However, high error rates of nearly 99% were observed. The number of FP cows per day for both mastitis definitions were 15·2 (Mastitis+3) and 15 (Mastitis+4) cows at an average herd size of 56 cows per day.
For lameness detection (Table 2b), Lame+7 showed highest block sensitivity (87·8%) compared to Lame+3 (73·8%) and Lame+5 (83·2%). While the specificities between the second and third lameness definitions varied slightly around 61%, Lame+3 reached a specificity value of 54·8%. Poorer results for Lame+3 were also obtained for the error rate (89·2%) compared with Lame+5 (88·5%) and Lame+7 (87·8).
Showing 12·3 FP cows per day, the first lameness definition compared unfavourably with Lame+5 (9·9 FP cows per day) and Lame+7 (9·3 FP cows per day) in relation to an average herd size of 47 cows per day.
Discussion
The ROC curves and the AUC values show that for both diseases the monitoring system (PCA and charts) used were able to distinguish between ill and healthy animals, especially for mastitis detection (AUC value 0·9).
According to Hogeveen et al. (Reference Hogeveen, Kamphuis, Steeneveld and Mollenhorst2010), the sensitivity of detection systems of AMS should be at least 80%, whereas for milking parlours, such as the one in Karkendamm, the sensitivity should be lower. Thus, the block sensitivity was set to be at least 70%, which is in line with Kramer et al. (Reference Kramer, Cavero, Stamer and Krieter2009) and the International Standard ISO/FDIS 20966 (ISO, 2007). With regard to (block) sensitivity above 70%, the detection performance of the monitoring system of both diseases was acceptable. Specificities, however, were only around 70% and below, especially for lameness detection. Additionally, the error rates were too high at about 90%. The error rate is mainly affected by the number of FP alerts, which was high in the present study. Around 20% of the cows of the average herd size (mastitis n = 56; lameness n = 47) were wrongly classified as ill per day for both diseases. This means more workload for the farmer accompanied by a loss of confidence in the monitoring system. Such unfavourable results can be caused by several reasons.
First, the disease definition is very important and subsequently influences classification results. In this study, an animal was considered to be ill if a treatment occurred. Other studies include the somatic cell count to avoid the possibility of an oversight of mastitis cases showing no visible signs (Hojsgaard & Friggens, Reference Hojsgaard and Friggens2010; Kamphuis et al. Reference Kamphuis, Mollenhorst, Feelders, Pietersma and Hogeveen2010). Although SCC from quarters or cow samples can be used to predict whether an intramammary infection exists (Dohoo, Reference Dohoo2001; Pyörälä, Reference Pyörälä2003) it can be affected by non-pathological factors such as stage of lactation and milking intervals (Petersen et al. Reference Petersen, Gardner, Rossitto, Larsen and Heegard2005). Additionally, the studies using the SCC as part of the mastitis definition propose different thresholds of 100 000–400 000 SCC/ml (Pyörälä, Reference Pyörälä2003; Windig et al. Reference Windig, Calus, de Jong and Veerkamp2005; Cavero et al. Reference Cavero, Tölle, Rave, Buxadé and Krieter2007). Dohoo (Reference Dohoo2001) indicate that it is impossible to select a single threshold of SCC which separates infected and uninfected cows clearly and without overlap and therefore suggested bacteriological investigations of the udder. The treatments utilised in this study were carried out by a qualified veterinarian and can therefore be considered reliable.
The second reason for the results can be subjected to the time blocks analysed before the first treatment of mastitis and lameness. According to Hogeveen et al. (Reference Hogeveen, Kamphuis, Steeneveld and Mollenhorst2010) an alert should be given before clinical signs are visible so that a treatment has a greater efficiency and reflects the implementations of practice. Therefore, disease blocks were analysed before treatment occurred. Bareille et al. (Reference Bareille, Beaudeau, Billon, Robert and Faverdin2003) stated that mastitis affects milk production at 3 d whereas feed intake is disturbed by mastitis at around 4 d before visual onset of this disease. Thus, 3-d and 4-d periods before clinical signs were chosen for mastitis detection. Up to 5 d have been reported to identify lameness (e.g. Bareille et al. Reference Bareille, Beaudeau, Billon, Robert and Faverdin2003). Furthermore, Gonzalez et al. (Reference Gonzalez, Tolkamp, Coffey, Ferret and Kyriazakis2008) showed that lame cows change their feeding behaviour in a 30-d period before disease occurs. Three-, five- and seven-day periods before clinical outbreak, i.e. an occurrence of the first treatment, were used for lameness detection. The choice of the length of the disease blocks has varied widely (1–17 d) in past research on disease detection (de Mol et al. Reference de Mol, Kroeze, Achten, Maatje and Rossing1997; Hogeveen et al. Reference Hogeveen, Kamphuis, Steeneveld and Mollenhorst2010; Kamphuis et al. Reference Kamphuis, Mollenhorst, Feelders, Pietersma and Hogeveen2010). For instance, de Mol & Woldt (Reference de Mol and Woldt2001) indicated 7 d before mastitis treatment occurred. Cavero et al. (Reference Cavero, Tölle, Henze, Buxadé and Krieter2008) utilised disease blocks of 5 d (day of treatment plus two days prior and after treatment) for mastitis detection. In general, block-sensitivity increases if longer periods are considered. Consequently, a comparison of model performance with other studies is difficult.
The third reason for the unfavourably high number of FP cows per day found in this study might be the fact that there is a high variation of the recorded traits between cows but also within cows. Cows always react individually to diseases (Kramer et al. Reference Kramer, Cavero, Stamer and Krieter2009; Lukas et al. Reference Lukas, Reneau, Wallace, Hawkins and Munoz-Zanzi2009; Brandt et al. Reference Brandt, Haeussermann and Hartung2010). Hence, it is very difficult to detect a unique pattern of cows suffering and/or developing a disease. In addition, the sensitivity of mastitis and lameness detection might depend on the different categories of mastitis and lameness. Cavero et al. (Reference Cavero, Tölle, Rave, Buxadé and Krieter2007) and Miekley et al. (Reference Miekley, Traulsen and Krieter2012) implemented a detection system based on univariate indicator variables. They expect that multivariate monitoring methods might compensate for high variation in each trait und thus improve results of disease detection systems. PCA combined with T 2 and SPE charts enable such multivariate considerations. Nielen et al. (Reference Nielen, Schukken, Brand, Haring and Ferwerda-Van Zonneveld1995) as well as Sloth et al. (Reference Sloth, Friggens, Lovendahl, Andersen, Jensen and Ingvartsen2003) used PCA to verify whether variation in the data was caused by mastitis and stated its potential for improving multivariate description of bovine udder health. Nielen et al. (Reference Nielen, Schukken, Brand, Haring and Ferwerda-Van Zonneveld1995) found sensitivities and specificities of approximately 75 and 95%, respectively. However, these results were obtained using MEC based on quarter level, leading to better detection performance (Hogeveen et al. Reference Hogeveen, Kamphuis, Steeneveld and Mollenhorst2010; Mollenhorst et al. Reference Mollenhorst, van der Tol and Hogeveen2010). Moreover, no on-line detection system has yet been established compared with the present study. Currently, there is no known PCA utilisation for lameness detection.
Contrary to model-based approaches, e.g. in the studies of de Mol et al. (Reference de Mol, Keen, Kroeze and Achten1999) and Chagunda et al. (Reference Chagunda, Friggens, Rasmussen and Larsen2006) PCA does not need an explicit system model which utilises additional (but maybe unknown) information such as stage of lactation, disease history and lactation number (Venkatasubramanian et al. Reference Venkatasubramanian, Rengaswamy and Kavuri2003). It is capable of handling high-dimensional and correlated process variables which make them a powerful and easy-to-implement tool for revealing the presence of abnormalities. However, missing values of one of the variables measured at the same time for one cow are critical, leading to omission of all of these traits for this particular time and cow. This circumstance caused a loss of information up to 30% for some cows during their 200 DIM influencing performance results and weakening the appropriateness for PCA in practice.
Owing to the comparison between the test and the training dataset, cow-individual analysis, which is e.g. claimed by Lukas et al. (Reference Lukas, Reneau, Wallace, Hawkins and Munoz-Zanzi2009) and Miekley et al. (Reference Miekley, Traulsen and Krieter2012), is not possible. In the present study, 100 cows, which were completely healthy during their first 200 DIM, were used for the training dataset. A higher number of such cows in the training dataset might cause better detection results and may compensate for this non-individual analysis. However, an enlargement of the training dataset of the present study was not possible.
MacGregor et al. (Reference MacGregor, Yu, García Muñoz and Flores-Cerrillo2005) as well as Kourti (Reference Kourti2006) stated that for process monitoring PCA requires a T 2 as well as a SPE chart. Lately, there have been some discussions about combining PCA with other monitoring methods to improve results (Venkatasubramanian et al. Reference Venkatasubramanian, Rengaswamy and Kavuri2003). However, there is no solution to this as yet and further research has to be done. For biological processes, as in this study, different monitoring methods might improve detection results and thus make PCA applicable for practically implemented disease detection systems.
The last reason for the unfavourable results can be subjected to the indicator variables used (milk yield, MEC, pedometer activity, etc.). These variables used in the present study have demonstrated their potential for mastitis and lameness detection in several studies (Cavero et al. Reference Cavero, Tölle, Henze, Buxadé and Krieter2008; Gonzalez et al. Reference Gonzalez, Tolkamp, Coffey, Ferret and Kyriazakis2008; Kramer et al. Reference Kramer, Cavero, Stamer and Krieter2009; Lukas et al. Reference Lukas, Reneau, Wallace, Hawkins and Munoz-Zanzi2009; Miekley et al. Reference Miekley, Traulsen and Krieter2012). However, the performance of the sensors currently used in practice has recently gained attention. Several studies, (e.g. Nielen et al. Reference Nielen, Schukken, Brand, Haring and Ferwerda-Van Zonneveld1995; Brandt et al. Reference Brandt, Haeussermann and Hartung2010; Hogeveen et al. Reference Hogeveen, Kamphuis, Steeneveld and Mollenhorst2010) call for improvement of the practically implemented sensors (such as the traits used in this study) as well as future developments in this field to avoid missing or unreliable data in order to enhance the results of monitoring systems.
Conclusion
The automation of the detection of lameness or mastitis with PCA combined with T 2 and SPE charts, using traits with regard to physiological data (milk yield, MEC and feed intake) as well as behaviour (feeding behaviour, activity), did not perform well enough for disease detection in dairy cows. The variability of the input parameters between and within cows might have caused high error rates. The performance of the monitoring system might be improved if other monitoring methods or other and more reliable sensor data were to be applied.



