I. INTRODUCTION
Several materials of technological importance have in common a lamellar or lamellar-like structure, where the atomic structure confers them high physical and mechanical anisotropy. Some important examples are the high toughness nacre structure-based materials,Reference Bouville, Maire, Meille, Van De Moortèle, Stevenson and Deville1 graphite,Reference Barsoum, Murugaiah, Kalidindi, Zhen and Gogotsi2 hierarchical biological materials,Reference Buehler3 REBaCuO high-temperature superconductorsReference Serbena, Foerster, Jurelo, Mikowski, Júnior, Carubelli and Lepienski4 and the recently discovered iron-arsenic based superconductors.Reference Dias, Pinheiro, de Souza, Serbena, da Silva, Jurelo, Bud'ko, Thaler and Canfield5 In addition, nature-inspired composites employ intercalated brittle and soft lamellae (e.g., SiC and graphite) to locally modulate the elastic properties, at micron and submicron scales, originating materials with superior fracture strength.Reference Studart, Libanori, Erb, Fratzl, Dunlop and Weinkamer6
Lamellar and lamellar-like materials subjected to normal loading deform plastically due to the dislocation mobility as well as fracture. The gathering of dislocations can originate microcracks, which eventually cause delamination of basal planes (in lamellar structures) or cleavage planes (in lamellar-like materials).Reference Barsoum, Murugaiah, Kalidindi, Zhen and Gogotsi2,Reference Mikowski, Soares, Wypych and Lepienski7 Bending forces can fracture adjacent layers perpendicularly to the cleavage plane. As a result, indentation tests using pyramidal indenters disclose pop-ins (rapid incursions) in the loading curves, as observed by several authors.Reference Barsoum, Murugaiah, Kalidindi, Zhen and Gogotsi2,Reference Lepienski, Meruvia, Veiga and Wypych8–Reference Mikowski, Soares, Wypych, Gardolinski and Lepienski11 Thus, careless analyses based strictly on the ready application of traditional methods lead to misinterpretation, because of artifacts and errors in the inferred mechanical properties.
In lamellar and lamellar-like materials, the measurement of surface mechanical properties such as elastic modulus and hardness is of importance, but it is still a challenge. For example, the design of novel nature-inspired materials demands the knowledge of actual elastic properties in submicron thick organic layers found in biological composites.Reference Studart, Libanori, Erb, Fratzl, Dunlop and Weinkamer6,Reference Meyers, Chen, Lopez, Seki and Lin12 Analytical models that are applicable for isotropic materials need to be adapted to obtain these properties, as recently proposed for indentation fracture toughness.Reference Mikowski, Serbena, Foerster, Jurelo and Lepienski13 Since elastic modulus determined from instrumented indentation tests is generally calculated by the Oliver and Pharr method,Reference Oliver and Pharr14 and because such method does not take into account pop-in nucleation, the maximum load used must be lower than the threshold load for indentation cracking. However, the determination of the proper load range for testing is not a trivial task, notably concerning the identification of fracture events in the indentation data.
A different approach is necessary for hardness determination in lamellar materials. Hardness is calculated as
 $$H = {{{P_{\max }}} \mathord{\left/ {\vphantom {{{P_{\max }}} {{A_{\rm{p}}}\left( {{h_{\rm{c}}}} \right)}}} \right. \kern-\nulldelimiterspace} {{A_{\rm{p}}}\left( {{h_{\rm{c}}}} \right)}}\quad ,$$
where A p(h c) is the projected contact area and h c the contact depth. According to this definition, it relates directly with the mean pressure the material support to accommodate the indenter.Reference Fischer-Cripps15 However, such property strongly depends on the used test parameters, as the indenter size and geometry, loading rate and range, and the penetration depth.Reference Tian, Xu and Zhao16 Therefore, the material hardness value is different for different methods of analysis, so that it is not considered a physical property per se.Reference Oliver and Pharr14 Moreover, as investigated in this work, it also depends on the material background, that is, the modifications in the microstructure induced by successive indenter loading–unloading cycles.
Millimeter-sized lamellar single crystals, produced by controlled growth parameters, are suitable to investigate the aforementioned peculiarities in indentation hardness and elastic modulus. Iron-arsenic based single crystals were elected for the present study because of the recent discovery of superconductivity in these compounds.Reference Kamihara, Hiramatsu, Hirano, Kawamura, Yanagi, Kamiya and Hosono17–Reference Wang, Liu, Lv, Gao, Yang, Yu, Li and Jin21 Materials such as 1111 REFeAs(O,F),Reference Kamihara, Hiramatsu, Hirano, Kawamura, Yanagi, Kamiya and Hosono17,Reference Kamihara, Watanabe, Hirano and Hosono18 122 (Ba,K)Fe2As2,Reference Rotter, Tegel and Johrendt19 11 Fe(SE,Te),Reference Hsu, Luo, Yeh, Chen, Huang, Wu, Lee, Huang, Chu, Yan and Wu20 and 111 LiFeAsReference Wang, Liu, Lv, Gao, Yang, Yu, Li and Jin21 share the common structure of square layers with Fe coordinated with either a pnictogen or a chalcogen. On the other hand, materials based on the BaFe2As2, that do not contain any oxygen and present FeAs layers in the bodycentred-tetragonal ThCr2Si2-type structure (space-group I4/mmm),Reference Rotter, Tegel and Johrendt19 are one of the most important superconductor systems. In contrast to the oxypnictides, they are composed solely of metallic and metalloid elements, enabling the large flux-grown high-quality single crystals to be readily obtained.Reference Ni, Nandi, Kreyssig, Goldman, Mun, Bud'ko and Canfield22 In the K-doped BaFe2As2 (the Ba0.6K0.4Fe2As2 compound), superconductivity occurs by hole doping up to the maximum critical temperature T c = 38 K. Also, upon cooling, a structural phase transition takes place from the high-temperature tetragonal to the low-temperature orthorhombic (Fmmm) phase.Reference Ni, Nandi, Kreyssig, Goldman, Mun, Bud'ko and Canfield22,Reference Rotter, Tegel, Johrendt, Schellenberg, Hermes and Pöttgen23
In contrast with the electrical and magnetic characterization of these materials, there have been a few studies concerning their mechanical and tribological properties.Reference Pimentel, Jurelo, Foerster, Rodrigues and Costa24–Reference Jurelo, Serbena, de Souza, Foerster, Sabino, da Silva, Lopes and Pimentel27 In a previous study,Reference Dias, Pinheiro, de Souza, Serbena, da Silva, Jurelo, Bud'ko, Thaler and Canfield5 the tribological behavior of Ba(Fe0.974Mn0.026)2As2 single crystals was observed to be ruled by microcracking events, strongly dependent on the lamellar behavior rather than the material fracture toughness.
In this study, Ba(Fe0.974Mn0.026)2As2 single crystals have been studied systematically through instrumented indentation, scanning electron microscopy (SEM), and atomic force microscopy (AFM), aiming at contributing to the understanding of mechanical behavior in lamellar and lamellar-like materials. Instrumented indentation was used to investigate the anisotropic behavior between ab- and a(b)c-planes in this material, as well as the processes ruling elastic–plastic responses in single and multiple loading regimes. Correlation of the indentation hardness and elastic modulus with the testing parameters (loading rate, single or cyclic loading, and fracture patterns) were discussed in light of the contact mechanics.
II. EXPERIMENTAL DETAILS
Ba(Fe0.974Mn0.026)2As2 single crystals were grown out of a FeAs self-flux using conventional high-temperature solution growth. Details of the crystal-growth process are presented elsewhere.Reference Ni, Nandi, Kreyssig, Goldman, Mun, Bud'ko and Canfield22,Reference Thaler, Hodovanets, Torikachvili, Ran, Kracher, Straszheim, Yan, Mun and Canfield28
Hardness and elastic modulus at different contact depths were measured by instrumented indentation (or nanoindentation) using a Nanoindenter XP™ (MTS Systems, Eden Prairie, Minnesota) following the Oliver and Pharr method.Reference Oliver and Pharr14 Indentations were performed parallel and perpendicular to the c-axis, using a Berkovich-type diamond tip (pyramidal), with loads ranging from 0.20 to 100 mN. The loading time was 10 s for each loading cycle. Additional indentations with single loading up to 10, 50, and 100 mN were carried out, for which loading time was 30 s. Regions for each indentation were chosen individually using an optical microscope coupled with the Nanoindenter, because of the difficulty to obtain perfect and planar large regions on the ab-plane. Prior to the instrumented indentation tests, the diamond tip area function (elastic modulus E = 1141 GPa, Poisson's ratio ν = 0.07) was calibrated in fused silica (E = 72 GPa, ν = 0.170) with loads from 0.20 to 100 mN, by following the usual method.Reference Oliver and Pharr14 The allowable drift rate for indentation tests was less than 0.100 nm/s. The properties of the a(b)c-plane were obtained by mounting the samples in a low-cure temperature resin. Superficial layers were removed by pulling them off the crystal with adhesive tape, to remove spurious contaminants.
The microstructures were observed through optical microscopy and SEM and AFM. Specifically for the AFM, a commercial AFM system (SPM-9600, Shimadzu Corp., Tokyo, Japan) in noncontact mode was used. The images were processed to remove the low-frequency noise. All AFM results reported in this work were obtained with silicon cantilevers (NCHR-20, Nano World Innovative Technologies, Neuchâtel, Switzerland). The probe was Al-coated on the detector side. The cantilever had a resonant frequency of approximately 320 kHz, with nominal spring constants of 42 N/m.
III. RESULTS AND DISCUSSION
A. Multiple loading indentation
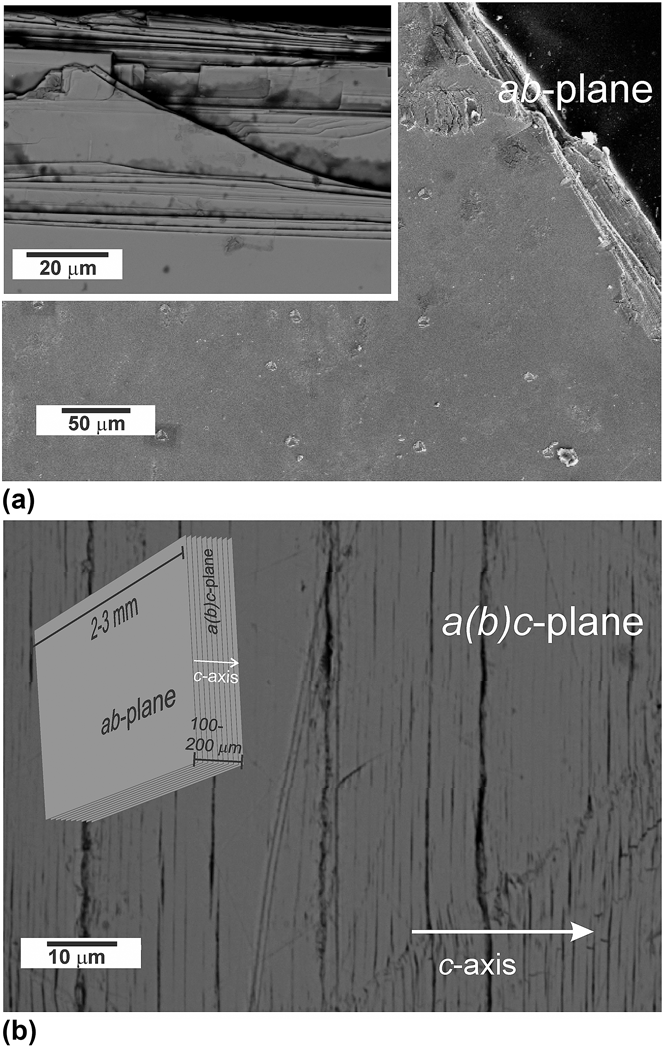
Figures 1(a) and 1(b) show the microstructure of the as-grown and exfoliated single crystals as revealed by SEM. Typical sample dimensions were between 2 and 3 mm in the planar orientation and 100–200 µm thick. In the ab-plane, the sample surface was planar and the layered structure could be observed at the sample edges, as shown in the inset of Fig. 1(a). Several microcracks were observed in the a(b)c-plane [Fig. 1(b)]. Such cracks aligned perpendicularly to the c-axis, caused by weak bondings between adjacent layers. X-ray diffraction on the ab-plane showed only (00l) peaks of the single phase with no spurious phases and a highly oriented lamellar-like structure.Reference Dias, Pinheiro, de Souza, Serbena, da Silva, Jurelo, Bud'ko, Thaler and Canfield5
SEM micrographs of the Ba(Fe0.974Mn0.026)2As2 single crystal: (a) ab-plane, with the stacked lamellar structure shown in the inset; (b) a(b)c-plane, showing sets of detached lamellae, which are perpendicularly oriented to the c-axis. Schematic representation indicates typical dimensions and the orientation of planes.

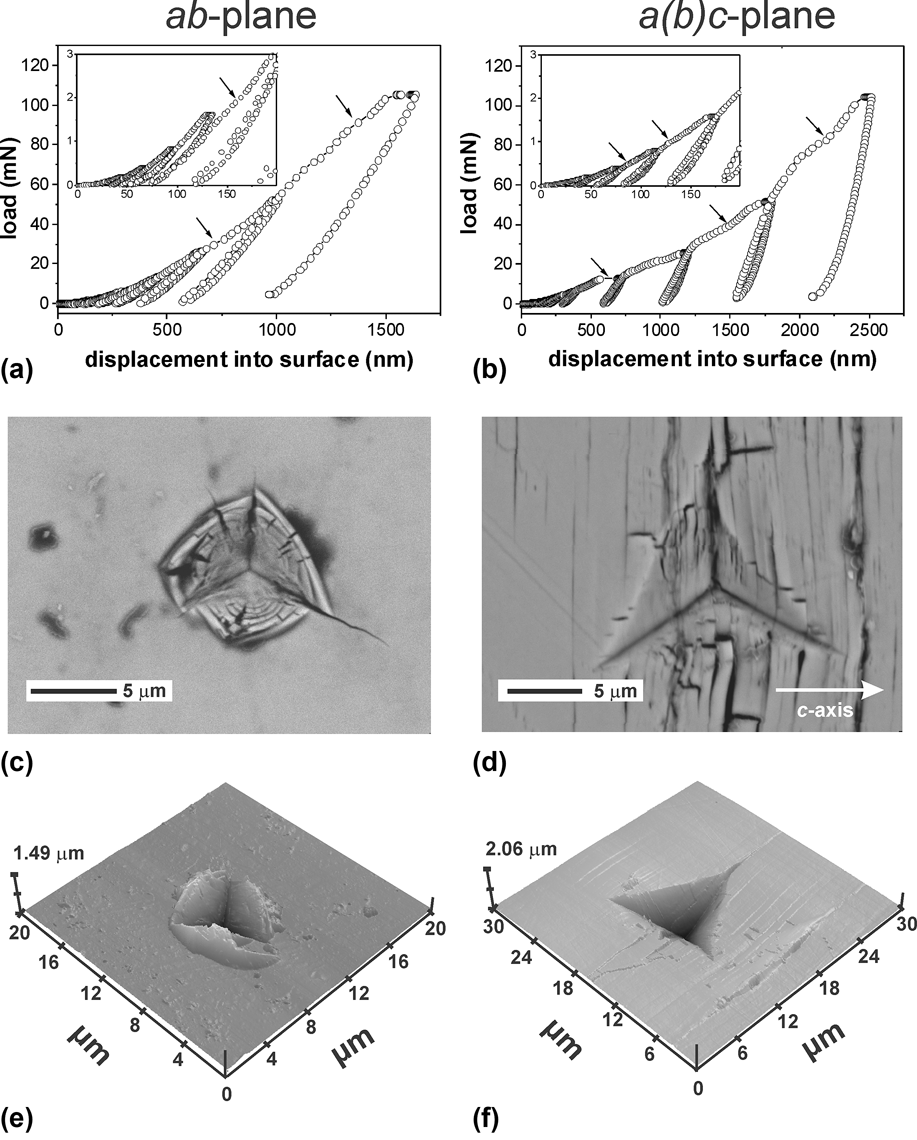
Typical loading–unloading curves on the ab- and a(b)c-planes are represented in Figs. 2(a) and 2(b). Several discontinuities and pop-ins were observed in both loading curves. Such feature was previously observed in other lamellar-like superconductorsReference Pimentel, Jurelo, Foerster, Rodrigues and Costa24–Reference Pimentel, Pureur, Lopes, Serbena, Foerster, da Silva, Jurelo and Chinelatto26,Reference Foerster, Serbena, Jurelo, Ferreira, Rodrigues and Chinelatto29–Reference Foerster, Lima, Serbena, Lepienski, Jurelo and Obradors31 and was associated with microcracking under the indenter. However, tip incursions due to the layer fracture under indentation were less pronounced at initial loading cycles in the ab-plane than in the a(b)c-plane, as shown in the insets of Figs. 2(a) and 2(b).
(a) Load versus displacement curve of a typical multicycles indentation test, produced with a Berkovich tip and 100 mN maximum load, on the ab-plane of the Ba(Fe0.974Mn0.026)2As2 single crystal. The inset shows initial stages of indentation, whereas arrows indicate pop-in events. See text for details. The corresponding (c) SEM and (e) AFM images disclose the material displaced and aggregated around imprint, amounting to about 0.5 µm height. In (b), (d), and (f), same results as above for an indentation test produced on the a(b)c-plane.
In the ab-plane, due to its layered structure, cracks that ran laterally to the imprint were nucleated and promoted the detachment of the material under the indenter. The indenter then lost support and a discontinuity in the loading curve took place. Such lateral cracks and a small radial crack can be observed around the indentation in Fig. 2(c). The surface topography measured by AFM around the Berkovich indentation in the ab-plane is depicted in Fig. 2(e). Considerable pile-up was observed in that plane. The pile-up occurrence is typical of ductile materials, and, at a first glance, it was here surprisingly concomitant with cracks, a common feature of brittle materials.Reference Oliver and Pharr14 In this case, the pile-up in the ab-plane was probably correlated with the aforementioned material microcracking parallel to the surface, as it will be better discussed in Sec. III. B.
In Fig. 2(b), it is also possible to observe that the unloading curve of the a(b)c-plane was steeper than that of the ab-plane, indicating a less pronounced elastic recovery of the a(b)c-plane. As observed in Fig. 2(d), indentations carried out on it promoted microcracks along the ab-planes and perpendicular to the c-axis. The AFM imaging [Fig. 2(f)] of the a(b)c-plane disclosed a small sink-in around the impression edges of the indentation. This might be due to slip systems that have a Burgers vector perpendicular the c-direction, as observed for YBa2Cu3O7−δ and REBa2Cu3O7−δ crystals.Reference Serbena, Foerster, Jurelo, Mikowski, Júnior, Carubelli and Lepienski4,Reference Foerster, Serbena, Jurelo, Ferreira, Rodrigues and Chinelatto29 Such slip system acted on the ab-plane by displacing material parallel to that surface and inwards with respect to the a(b)c-plane, as observed in the micrographs.
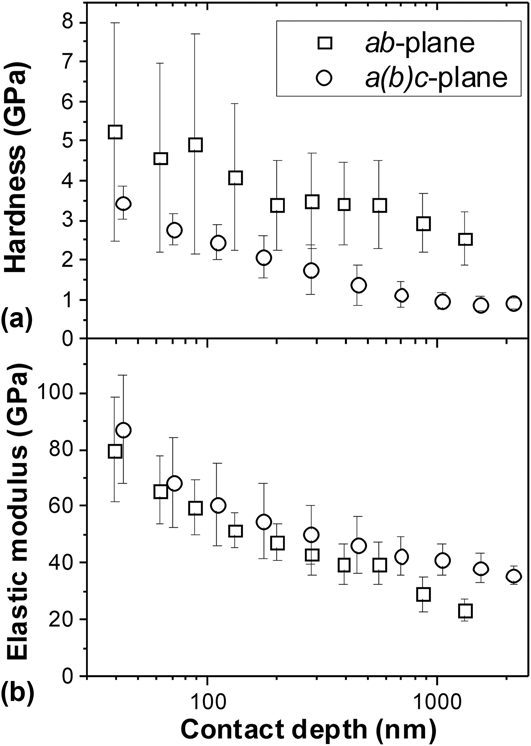
Hardness profiles as a function of the contact depth are represented in Fig. 3(a) for both planes. The ab-plane was harder than the a(b)c-plane. Hardness was higher at the surface for both planes and reached a plateau at deeper penetration depths. For the ab-plane, the hardness was around 3–3.5 GPa at a contact depth greater than 250 nm. For the a(b)c-plane, the hardness decreased continuously from 3.5 GPa at surface to ∼1 GPa for contact depths greater than 1 µm. The observed higher hardness at surface is most probably due to the indentation size effect. According to the model proposed by Nix and Gao,Reference Nix and Gao32 at shallower depths the number of necessary dislocations to accommodate the plastic deformation produced by indentation is higher, increasing the local yield strength. Consequently, higher stresses are necessary to produce plastic deformation. Apart from the indentation size effect at low loads, hardness is affected by work hardening under multiple loadings. Each loading cycle produces plastic deformation. The plastic deformation produced by the next cycle must overcome the stresses generated by the previous cycle, promoting an increase in the compaction of the microstructure at higher loads. Figures 2(e) and 2(f) reveal that the hardness values presented in Fig. 3 were affected by the pile-up and sink-in observed around the indentation in both planes. As the actual area of the indentation with pile-up was higher, the hardness of the ab-plane is expected to be lower than that measured and represented in Fig. 3. Regarding sink-in in the a(b)c-plane, the actual hardness is expected to be slightly higher than that calculated in Fig. 3. Besides, the hardness shift due to errors in the area calculation must be lower than those for the ab-plane, since the amount of sink-in was smaller than the observed pile-up.
(a) Hardness and (b) elastic modulus profiles of the Ba(Fe0.974Mn0.026)2As2 single crystal, obtained from multicycle indentation tests according to the Oliver & Pharr method, in the ab- and a(b)c-planes.
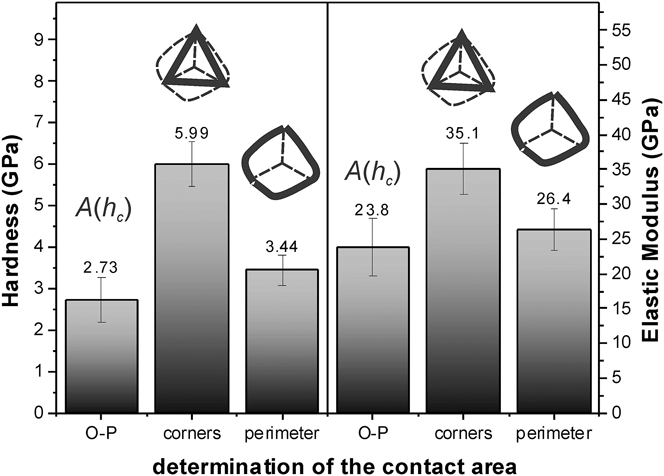
To investigate the effect of the pronounced pile-up observed in the impressions on the ab-plane, each of the impressions were imaged by SEM and the areas were calculated by either connecting the corners of the indentation—which should be similar to the areas calculated using the Oliver–Pharr method—or by following the indentation contour. The latter method took into account the pile-up, which represents the “true” contact area, and, consequently, the “true” hardness. The hardness values on the ab-plane, calculated by imaging the impression areas and by the indenter algorithm, are compared in Fig. 4(a). Surprisingly, hardness calculated by connecting the corners of the indenter for the highest load of 100 mN was higher than that calculated by the Oliver–Pharr method (since, as already mentioned, they were supposed to be similar). This indicates that microcrackings in the vicinity of indentations lowered the hardness by probably underestimating contact stiffness values (obtained from the unloading data), which gave higher contact depths and lower hardness. Hardness is inversely proportional to the contact area, which, in the Oliver–Pharr method,Reference Oliver and Pharr14 is a function of the contact stiffness
 $$S = {{{\rm{d}}P} \mathord{\left/ {\vphantom {{{\rm{d}}P} {{\rm{d}}h}}} \right. \kern-\nulldelimiterspace} {{\rm{d}}h}}\quad .$$
Hardness and elastic modulus values for ab-plane of the Ba(Fe0.974Mn0.026)2As2 single crystal, obtained from multicycle indentation tests and corresponding to the maximum applied load (100 mN). Bars indicated by A(h c) correspond to the values calculated through the Oliver & Pharr method, where the projected area A depends on the contact depth h c [A(h c) ≈ 24.5h c2]. Values assigned by “corners” and “perimeter” had their projected areas manually calculated by connecting the triangle corners or by contouring the imprint, respectively, as schematized for the representative image of Fig. 2(c).
If the estimation of contact areas takes the existence of pile-ups into consideration, the “true” hardness presented in Fig. 4(a) was close to the hardness measured by the indenter algorithm [the A(h c) bar in Fig. 4]. Actually, it is important to mention that such inferred value did not take into account elastic deformations at the perimeter of the loaded indenter, differently from the Oliver and Pharr method. It is assumed that this hardness agreement is fortuitous because pile-up is not considered in the hardness calculation using the Oliver–Pharr method. Lower hardness measured by nanoindentation and also attributed to microcracking was observed before for the case of highly oriented FeSe0.5Te0.5 melt-textured samples.Reference Pimentel, Pureur, Lopes, Serbena, Foerster, da Silva, Jurelo and Chinelatto26
The elastic modulus profiles for the ab- and a(b)c-planes, as a function of contact depth, are represented in Fig. 3(b). They had a value of 80–90 GPa in the near surface region and decreased continuously to ∼35 GPa for the a(b)c-plane and ∼20 GPa for the ab-plane. The continuous decrease of elastic modulus with respect to depth has already been observed in superconductor samples with lamellar-like structure,Reference Serbena, Foerster, Jurelo, Mikowski, Júnior, Carubelli and Lepienski4,Reference Pimentel, Pureur, Lopes, Serbena, Foerster, da Silva, Jurelo and Chinelatto26 and, as in the case of hardness, it was caused by microcracking under the indenter. Both the structure and the microcracking of those samples were similar as those observed in the present samples.
The elastic modulus for the highest load of 100 mN, calculated using the area connecting the impression corners and the area including the pile-up, are presented in Fig. 4(b). It is possible to see that the effect of the error in estimating the area was stronger in hardness (inversely proportional to contact area) than it was in elastic modulus (inversely proportional to the square root area). In spite of these results, it was difficult to infer confidently the true elastic modulus of the material because of the microcracking in the lamellar-like microstructure; that is, it is likely to be higher than those values measured at greater contact depths for both Oliver and Pharr method and imaging methods. Its most probable estimate is expected to be in the range 50–60 GPa for both planes. These are the values measured at low contact depths in Fig. 3, where no microcracking was expected to occur. In fact, as shown in the inset of Figs. 2(a) and 2(b), tip incursions were less significant at lower loads up to around 3 mN reaching ∼200–250 nm depth. These estimates are not far from the bulk elastic modulus of ∼80 GPa measured in pure BaFe2As2.Reference Kimber, Kreyssig, Zhang, Jeschke, Valentí, Yokaichiya, Colombier, Yan, Hansen, Chatterji, McQueeney, Canfield, Goldman and Argyriou33 Elastic modulus is a physical property strongly connected with atomic bonds, and less related with the material's microstructure, whose value must not depend on the technique applied to determine it.
B. Single loading
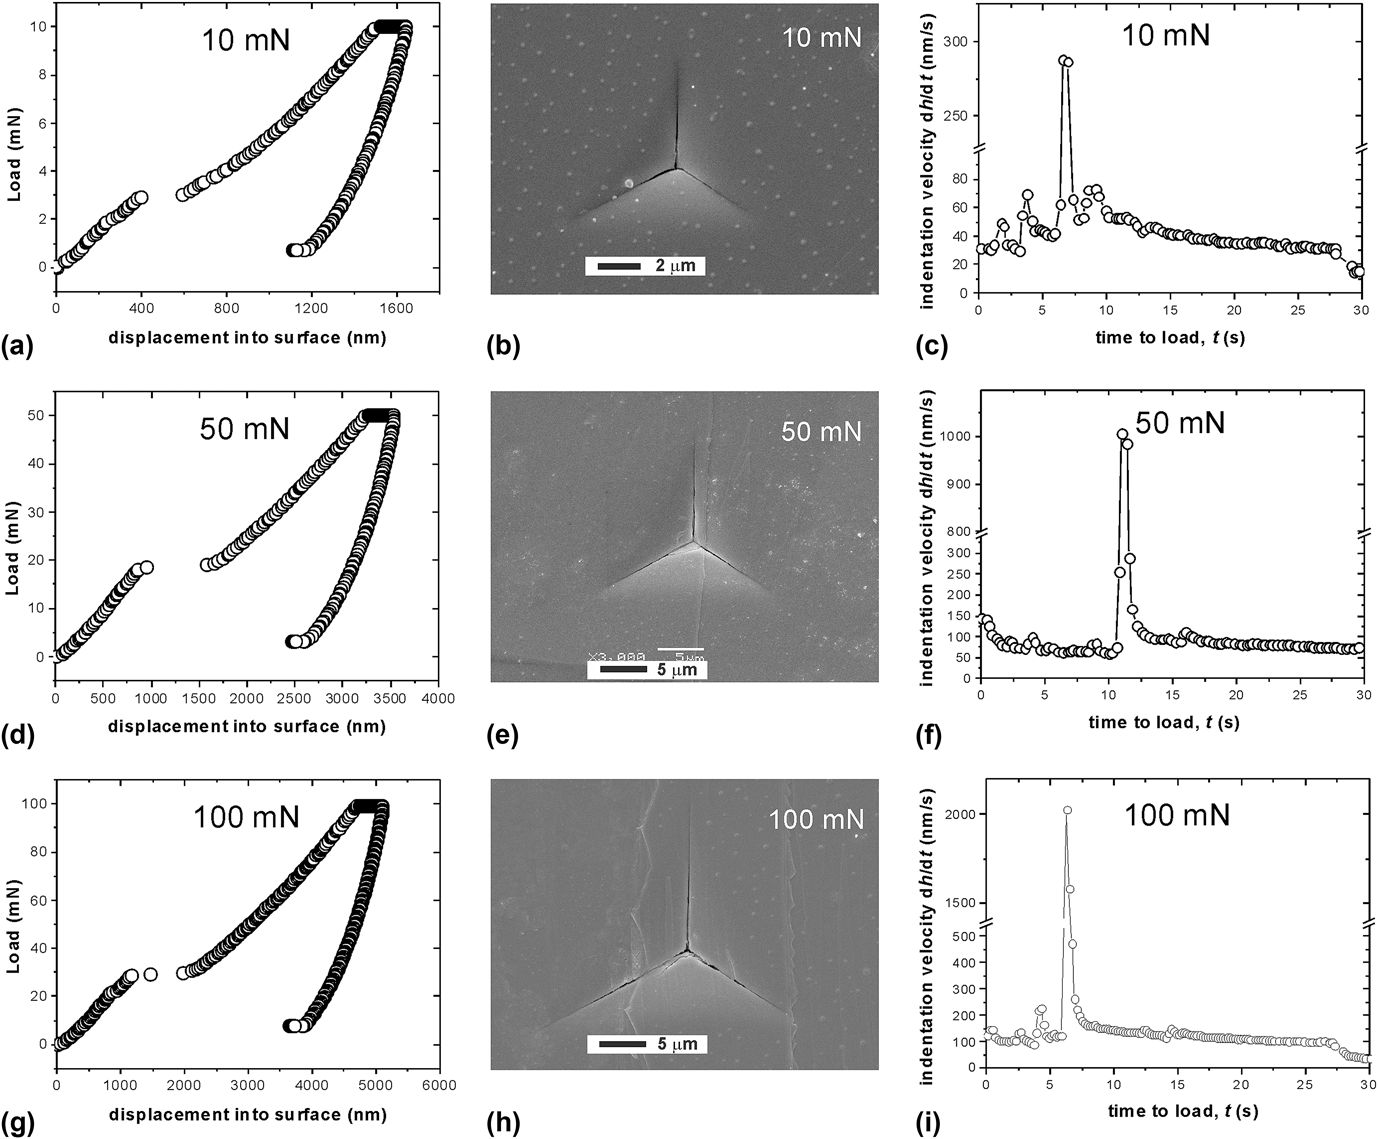
Single loading–unloading curves were obtained on the ab-plane for several loads, with the aim of investigating dynamic effects on the mechanical behavior of such layered microstructure, as depicted in Fig. 5. As the loading time was 30 s for all of them, the lower loads had the slower load application rates (see Table I). It is possible to observe in Fig. 5(a) a pop-in at the loading portion at ∼3 mN. Usually, these discontinuities in the curve are associated with the nucleation of cracks. If the loading rate and the maximum load increased, the pop-in occurred at 20 mN, as observed in Fig. 5(d). Increasing further the load and the loading rate, the pop-in occurred at 30 mN [Fig. 5(g)]. This indicates that pop-in was dependent on the applied loading rate and, therefore, on the indentation process dynamics, meaning that some kinetic effect existed. It was also observed that the penetration depth for the ab-plane changed, depending whether the applied load was single or cyclic for the same 100 mN maximum load. In Fig. 2(a), penetration depth for multiple cycling load was 1600 nm, whereas for the single load [Fig. 5(g)] it was approximately 5000 nm. There was also a significant difference in the variation of the penetration depth while this maximum load was held. For multiple loadings, the tip moved forward 160 nm. For single loading, the penetration depth variation was larger, approximately 550 nm.
In (a), (d), and (g), the load versus displacement curves for one-cycle indentation tests carried out on the ab-plane of Ba(Fe0.974Mn0.026)2As2 single crystal, and (b), (e), and (h) the corresponding imprints (imaged by SEM). In the indentation velocity versus time plots (c), (f), and (i), peaks at maximum can be correlated with critical loads producing the inner cracks, as seen in SEM images.
Test parameters and mechanical results obtained for the lamellar-like Ba(Fe0.974Mn0.026)2As2 single crystal, indented at the ab-plane: maximum indentation load (P), loading rate (ΔP/Δt), average velocity of the indenter  $\bar v$, critical load for cracking (tip incursion in loading curves—P pop-in), hardness (H O–P) and elastic modulus (E O–P) values calculated through the Oliver and Pharr method and hardness inferred by imaging the indentation imprints (H imaging).
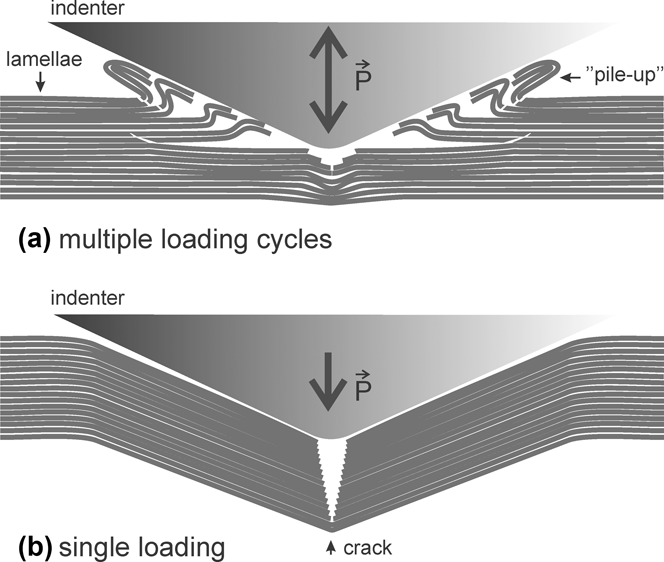
Figs 5(b), 5(e) and 5(h) are the SEM micrographs for the indentations at maximum load of 10, 50 and 100 mN, respectively. Figure 2(c) showed the morphology of the indentation resulting from multiple loadings with the same maximum load as Fig. 5(h). The most striking difference between these two micrographs was the absence of pile-up for single loading–unloading. Also, the cracking pattern was completely different. While in the multiple cycles test [Fig. 2(c)] the material was displaced in lamella at 100 mN maximum load, in the single cycle one [Fig. 5(h)], cracks were observed only along the indentation diagonals. Such comparison is supported by the previous assumption that each unloading cycle introduces damage, probably in the form of lateral cracking, which affects the measurement in a subsequent cycle. If the lamellar surface undergoes multiple loading cycles, there are successive cracking and detachment of parallel layers, which lift and cumulate adjacent to the penetrating tip, as shown in Fig. 6(a). Aiming at a better understanding of such mechanism, Figs. 5(c), 5(f), and 5(i) present instantaneous velocity curves of the penetrating indenter, during the single loading regime. It is recalled that, for each load, the loading rate was constant, instead of the penetration rate. Abrupt and small variations in velocity corresponded to microcrackings taking place at an adjacent, or a group of adjacent layers, whereas the maximum point indicated the ultimate loss of the bearing capacity, which produced the inner cracks as seen in SEM images. Figure 6(b) shows the layers compression and the nucleation of median cracks during single loading on the lamellar-like crystal. The average velocities in the entire loading cycle,
 $${v_{{\rm{indent}}}} = {{{\rm{d}}h} \mathord{\left/ {\vphantom {{{\rm{d}}h} {{\rm{d}}t}}} \right. \kern-\nulldelimiterspace} {{\rm{d}}t}}\quad ,$$
are summarized in Table I. The greater the loading rate and the indenter average velocity were, the higher the critical load for pop-in was, possibly indicating a viscoelastic-like component in the lamellar bending process. This also explains the larger tip incursion (penetration variation) during the maximum load hold time observed in Fig. 5(g) as compared to Fig. 2(a). Another factor contributing to this phenomenon can be the absence of compaction, as discussed further in this section.
Schematic representations of the indenter–lamellae interactions—under low loads—occurring on the single-crystal ab-plane: (a) multiple loading cycles and (b) single loading. The multicycle case refers to Figs. 2(a), 2(c), and 2(e), where, at first glance, one could infer a pseudo-ductile behavior. The pile-up observed is indeed due to successive fractures and displacement of adjacent plates, concomitant with the compaction of the material. The single-loading scheme refers to Fig. 5, in which, at a critical load, cracks are produced in the imprint diagonals.
The SEM micrographs as the ones displayed in Figs. 5(b), 5(e) and 5(h) allow the calculation of the projected area, and then the “true” hardness for single loading cycles as a function of load. Table I shows the hardness for ab-plane calculated according to the Oliver–Pharr methodReference Oliver and Pharr14 for multiple and single loading cycles. Also, values obtained by measuring directly the single loading imprints areas by SEM are presented—such values for multiple loading cycles were depicted in Fig. 4. It is possible to observe that the single loading hardness was much lower than that for multiple loading. In addition, hardness measured by the projected area was higher than that calculated by the Oliver–Pharr method for single loading cycles, because of the unconsidered elastic deformation in the imaging method.
As discussed in Sec. III. A, elastic modulus is preferably inferred under circumstances where microcracks are absent, or produce minor tip incursions, which, for the present situation, corresponded to loads up to 3 mN. The single loading indentations (Fig. 5) used loads far from that range. However, the analysis of elastic modulus following the Oliver and Pharr method for such loading regimes disclosed additional information regarding the microstructure effects on the mechanical response of layered crystals. Table I compares the elastic modulus measured by the Oliver–Pharr method for multiple and single loading cycles. Again, for single loading, elastic modulus decreased with increasing load, but presenting values 6 times smaller than those for multiple loadings.
The origin of these differences in hardness and elastic modulus according to the loading regime is unclear. It is worth emphasizing that such unloading-related damages influenced the determination of the contact stiffness S, and, consequently, the hardness and elastic modulus values. Thus, the differences may be because, under multiple loading, the damage (microcracking) produced in each cycle was compacted by the loading of the next cycle. For single loading cycle, there was no compaction and the elastic modulus was much lower. Following this line of reasoning, the decrease in hardness observed in single loading cycles was due to the absence of work hardening by the compaction of layers (existing in the multiple loading regime), leading to higher penetration depths, as observed when comparing Figs. 2(a) and 5(g). The type of microcracking might be different as well: for multiple loading, there was compaction of the lateral cracks and a stiffer contact. For single loading, the existence of one or some few lateral cracks was possible and the contact stiffness was much lower.
In summary, two parameters clearly affect the measurement of indentation hardness and elastic modulus in the lamellar-like samples: the surface plastic deformation history, and the test loading dynamics. The loading history in indentation tests is known to strongly affect mechanical responses in specimens presenting kinetic components when undergoing deformation (e.g., soft and viscous biological matter).Reference Niu and Cao34 However, the present case comprises a different situation, in which the loading history and dynamics are not tightly connected. The question is if it is possible to obtain a good estimative of mechanical properties in such small lamellar-like structures. A proposal for FeBa2As2 single crystals is presented in the sequence.
C. Hardness and elastic modulus of BaFe2As2 single crystals
The hardness and elastic modulus measured for Ba(Fe0.974Mn0.026)2As2 and summarized in Table I are in the range of values of other Fe-based superconductors. Mechanical properties of Fe-based superconductors of the type 11 were measured before. Polycrystalline FeSe1−x samples with α-FeSe1−x and β-FeSe1−x phases showed 1.3 GPa hardness and 42 GPa elastic modulus as measured by instrumented indentation.Reference Pimentel, Jurelo, Foerster, Rodrigues and Costa24,Reference Pimentel, Serbena and Jurelo25 Highly oriented FeSe0.5Te0.5 samples also presented low hardness in the range 0.6–0.8 GPa and a low elastic modulus, 20–25 GPa.Reference Pimentel, Pureur, Lopes, Serbena, Foerster, da Silva, Jurelo and Chinelatto26 In the latter, the hardness was affected by microcracking in a very similar manner as observed in the present material. Lateral cracking perpendicular to the c-axis and parallel to the ab-planes resulted in a continuous decrease in hardness and elastic modulus, with several pop-ins in the loading curve.
Finally, two values of hardness were considered: one for Ba(Fe0.974Mn0.026)2As2material, given by the multiple loading tests, because of the compaction and low loads; and another one referring to the crystal microstructure, which was measured by single loading. The former has influences of the indentation size effect at low loads and work hardening at higher loads, which contributes for the compaction of the lamellae. The latter comprises the effects of pores and microcracks observed in the lamella in Figs. 1(a) and 1(b). For the Ba(Fe0.974Mn0.026)2As2 material, the averaged hardness was ∼3.4 GPa for the ab-plane and ∼1.0 GPa for the a(b)c-plane. By considering the microstructure of the ab-plane, the average “hardness” was considered as ∼0.3 GPa from both the Oliver–Pharr and the measured area methods (H imaging in Table I), even though the latter gave smaller standard deviations. On the other hand, the material average elastic modulus was 55 ± 5 GPa for both planes, as obtained in the indentation cycles with low loads, which presented fewer or no lamellar fractures.
IV. CONCLUSIONS
The mechanical behavior of Ba(Fe0.974Mn0.026)2As2 (Ba-122) single crystals was investigated through instrumented indentation and correlated with the lamellar microstructure in the ab- and a(b)c-planes. The different loading dynamics and the material plastic deformation history, attained with single or multiple indentations, strongly affected the mechanical response and, consequently, the determination of hardness and elastic modulus, as follows:
(1) Multiple loading in the ab-plane produced pile-ups around indentations by means of successive fracture and displacement of adjacent layers beneath the indenter, whereas layers at the indented a(b)c-plane were detached parallel to the applied load.
(2) The ab-plane subjected to a single loading cycle presented cracks only along the indentation diagonals. The threshold load for cracking depended on the loading rate and the indenter average velocity, indicating a kinetic effect in the lamellar bending process.
(3) Single crystal layers were successively compacted under multiple indentations. Differently, in single loading tests, the layered microstructure undergoes microcracking and loss of the load bearing capacity, with consequent reduction in hardness of about 10 times as compared to the multiple loading tests, for the same maximum load.
(4) Instrumented indentation was suitable for the determination of mechanical properties in the lamellar-like single crystals, through the correct choice of testing parameters. Multiple loading tests allowed the estimate of the material hardness, whereas elastic modulus was measured under low indentation loads. Thus, hardness of the single crystal ab-plane was about 3.4 GPa, higher than the value found for the a(b)c-plane of approximately 1.0 GPa. The elastic modulus was about 55 GPa for both planes.
These observations are thought to apply to other important technological materials, natural and nature-inspired ones with lamellar or lamellar-like structure, such as high toughness nacre structure-based materials, graphite, hierarchical biological materials and high-temperature superconductors. However, further studies are necessary to correlate the influence of loading conditions on the mechanical properties measured by instrumented indentation, such as those observed in this work.
ACKNOWLEDGMENTS
The authors thank Prof. Dr. C.M. Lepienski (DEFIS/UFPR) for the use of the instrumented indentation facilities, Prof. Dr. A.L. Chinelatto (DEMA/UEPG) for some of the SEM images, the CME/UFPR for the use of SEM facilities, and C-LABMU/UEPG for the use of AFM. This work was partially financed by CNPq/Brazil under contract no. 472.746/2013-8. Work at the Ames Laboratory was supported by the US Department of Energy Basic Energy Sciences, Division of Materials Sciences and Engineering under Contract No. DE-AC02-07CH11358.