

In the late 1950s and 1960s, Otto Kirchheimer (Reference Kirchheimer1957, Reference Kirchheimer1966) warned that many Western European countries ‘to a greater or lesser extent depart from the principle of concentrated responsibility and alternative government in the classical formula’ (Kirchheimer Reference Kirchheimer1957: 142). In essence, Kirchheimer’s proposition, which we refer to as the ‘waning-of-opposition thesis’, states that partisan conflicts, and ideological contestation in general, have been in a spiral of decline since the emergence of mass parties in the early twentieth century. Today, this basic idea is one of the more established among researchers of European governance (e.g. Helms Reference Helms2008a: 6). For example, in consonance with the influential ‘cartel-party thesis’ (Katz and Mair Reference Katz and Mair1995, Reference Katz and Mair2009), a widespread notion in contemporary political science literature is that there is an ongoing convergence between the policy positions of mainstream parties (e.g. Bartolini Reference Bartolini2005; Kitschelt Reference Kitschelt2007; Oskarson and Demker Reference Oskarson and Demker2015). Thus, whereas mainstream parties may still present competing programmes in the electoral arena, it is commonly assumed that government and opposition are growing increasingly indistinct in the parliamentary arena (e.g. Andeweg Reference Andeweg2013).
Although the waning-of-opposition thesis appears to be widely accepted in contemporary research, we argue that it is hardly ever backed up by empirical data. In general, knowledge about the scope and intensity of conflicts in national parliaments is remarkably meagre (for exceptions see Andeweg Reference Andeweg2013: 103–5; Damgaard and Mattson Reference Damgaard and Mattson2004; Sjölin Reference Sjölin1993), while longitudinal studies on the actual behaviour of government and opposition parties are more or less absent from the literature on comparative government (cf. Dahl Reference Dahl1966a; Helms Reference Helms2008a; Norton Reference Norton2008). In order to fill this gap in the previous research, we have collected data on committee decision-making in the Swedish parliament (the Riksdag) for a period of 44 years (between 1970 and 2014). Building on this vast data set, our aim is to develop precise measures of the degree of parliamentary opposition, with the intention of carrying out the first systematic test of the waning-of-opposition thesis. Our research strategy is twofold. First, since the waning of opposition is believed to be a result of increased cooperation between government and opposition (Dahl Reference Dahl1966b: 397), we explore the degree to which governments accommodate the policy positions of the opposition over time. Second, to test the core assumption of the thesis under scrutiny, we compare the extent to which opposition parties politicize, and formally reject, the proposed policies of the government over time. Additionally, since the cartel-party thesis – which can be viewed as a modern restatement of Kirchheimer’s original idea (Katz and Mair Reference Katz and Mair2009: 755) – presupposes that the vanishing of opposition primarily concerns distributional conflicts along the traditional left–right divide, we also study the frequency of policy rejections in policy areas that specifically concern economic-distributive issues.
We argue that there are two main reasons why Sweden is a particularly intriguing case for testing the waning-of-opposition thesis. First, Strøm and Bergman (Reference Strøm and Bergman2011: 13) assert that Sweden, and the other Scandinavian countries, have drifted away from the Nordic version of the Westminster model and instead evolved towards a ‘Madisonian-type’ model that is characterized by weaker parties, growing external constraints on parliamentary power and less clear divisions between the traditional blocs (see also Bergman and Strøm Reference Bergman and Strøm2011: 383–4). Thus, while government and opposition are believed to grow less distinct in parliamentary democracies in general (Andeweg Reference Andeweg2013: 111), this trend should, given the findings of Strøm and Bergman (Reference Strøm and Bergman2011), be particularly pronounced in Sweden and the Nordic countries.
Second, Sweden also has a long tradition of cross-partisan cooperation (e.g. Sannerstedt and Sjölin Reference Sannerstedt and Sjölin1992: 99, 136–7). Therefore, as Swedish parties are growing weaker (Bergman and Bolin Reference Bergman and Bolin2011) while the effects of Europeanization have been particularly profound in the Scandinavian countries (e.g. Bartolini Reference Bartolini2005: 296), Sweden has been described as a fertile ground for cartelization between mainstream parties (Bergman and Strøm Reference Bergman and Strøm2011: 385; Katz and Mair Reference Katz and Mair1995: 17; 2009: 755). In sum, while Sweden only represents one case in which to examine changes in the government–opposition dynamic that all parliamentary democracies are undergoing, we argue that it is a most likely case for verifying the waning-of-opposition thesis.
The remainder of this article proceeds as follows. First, we explore theories of government–opposition relationships and provide a more detailed account of the waning-of-opposition thesis. Against that background, we derive two hypotheses about changes over time that should be expected if the waning-of-opposition thesis is correct. Thereafter, we present the data and our empirical measures of opposition. Subsequently, we test our hypothesis. In the last section of the article, we summarize our findings and discuss their implications.
VARIETIES OF PARLIAMENTARY OPPOSITION IN WESTERN DEMOCRACIES
An influential view in the literature is that opposition is, alongside participation, a defining characteristic of liberal democracy. In short, without opposition there can be no political democracy (Dahl Reference Dahl1971: 4–8; Oberreuter Reference Oberreuter1975b: 8–11). Yet, given that opposition is an essential element of democratic government, research on parliamentary opposition has been remarkably meagre. In fact, during the last 50 years only a handful of major works have emerged – including Dahl (Reference Dahl1966a, Reference Dahl1971, Reference Dahl1973), Ionescu and Madariaga (Reference Ionescu and de Madariaga1968), Oberreuter (Reference Oberreuter1975a), Kolinsky (Reference Kolinsky1987), special issues of Government and Opposition (1997) and the Journal of Legislative Studies (2008), and a book chapter by Andeweg (Reference Andeweg2013). It is also frequently maintained that research on political opposition has been marred by a shortage of established theoretical frameworks, concepts and measures (von Beyme Reference von Beyme1987: 31; Helms Reference Helms2008a: 7).
Even so, as far as parliamentary opposition is concerned, most authors adhere to Dahl’s (Reference Dahl1966a: xvi) classic relational definition which, in short, proposes that there is opposition when party B is opposed to the conduct of government A. In practice, this notion of opposition basically refers to constitutionally regulated contestation over policy inside national parliaments (cf. Helms Reference Helms2008a, Reference Helms2008b; Norton Reference Norton2008). In this article, we employ this well-established definition.
From the outset of opposition research it has been argued that ‘there is no single prevailing pattern of opposition in Western democracies’ (Dahl Reference Dahl1966d: 332), and several typologies have been suggested to account for these variations. Nonetheless, if we confine opposition to the relations between political parties in political systems with parliamentary democracy, and without major structural opposition – that is, anti-system parties (Dahl Reference Dahl1966d: 335–42) – the varieties of government–opposition relationships can be boiled down to two major types of parliamentary opposition. We will label these the opposition mode and the cross-party mode of executive–legislative relations (King Reference King1976; cf. Norton Reference Norton2008).
The opposition mode is ‘characterized, indeed defined by, conflict’ (King Reference King1976: 18). This type of opposition has been labelled classical opposition (Kirchheimer Reference Kirchheimer1957: 127), competitive opposition (Dahl Reference Dahl1966d: 336f; Oberreuter Reference Oberreuter1975b: 20) and opposition through confrontation (Giulj Reference Giulj1981: 476). The opposition mode of executive–legislative relations is modelled on the classic British Westminster system with its two-party alternation in office. In the opposition mode, the overriding goal of the political parties in parliament is to be in office after the next parliamentary election, and no cooperation between the government and the opposition can be expected. On the contrary, ‘Her Majesty’s Loyal Opposition’ appears as an alternative government with a complete shadow cabinet, using the parliamentary arena as a means of presenting alternative policies to the electorate (Giulj Reference Giulj1981: 477, 486–7; Kirchheimer Reference Kirchheimer1957: 130–5; Norton Reference Norton2008: 238–9; Sjölin Reference Sjölin1993: 153–4). In essence, what really matters to the opposition ‘is to “throw the rascals out”, not to get them to change their ways’ (Milnor and Franklin Reference Milnor and Franklin1973: 423).
The cross-party mode of executive–legislative relations is, by way of contrast, characterized by cooperation between the major parties in parliament (Norton Reference Norton2008: 241–2). Consequently, this type of opposition has been labelled cooperative opposition (Dahl Reference Dahl1966d: 337–8; Oberreuter Reference Oberreuter1975b: 20), opposition through conciliation (Giulj Reference Giulj1981: 476) and consensual democracy (Lijphart Reference Lijphart1999: 2). More precisely, cross-party opposition is supposed to emerge in moderate multiparty systems where there is no single or certain alternative government.Footnote 1 Moreover, the distinct dividing line between government and opposition in the opposition mode is blurred by the fact that government parties frequently seek policy agreement with parties outside government, often by means of party negotiations in parliamentary committees. Thus, opposition parties are expected to participate in and influence the policymaking process, while overthrowing the government does not guarantee an opposition party a place in a new coalition cabinet (Christiansen and Damgaard Reference Christiansen and Damgaard2008: 49–50; Sjölin Reference Sjölin1993: 154–5; Smith Reference Smith1987: 51–2).
Drawing on the review above, we should not expect a country to be confined to a particular mode of parliamentary opposition. On the contrary, it is often stressed that most parliamentary democracies simultaneously display features of both the opposition mode and the cross-party mode of parliamentary opposition, while the mix may change over time (von Beyme Reference von Beyme1987: 45; King Reference King1976; Norton Reference Norton2008: 247). We therefore suggest that these two faces of opposition should be regarded as polar types. The opposition mode and the cross-party mode represent the outer boundaries of a dimension (conflict–consensus) within which the empirical cases of parliamentary opposition may vary (Sartori Reference Sartori1976: 145–6).
The Waning-of-Opposition Thesis
As traditional ideological appeals gradually lost their relevance in the competition between catch-all parties in the late 1950s, Kirchheimer suggested also that the room for classical opposition – what we label the opposition mode – became increasingly constrained. Moreover, since Kirchheimer (Reference Kirchheimer1957: 127) regarded the Westminster model as the ideal form of parliamentary opposition, he warned that an evolution towards increased cooperation and consensus in parliaments – the cross-party mode of opposition – could result in a cartel-like government (Kirchheimer Reference Kirchheimer1957: 136, 144, 147–8, 155–6). Similarly, Dahl (Reference Dahl1966b: 397) observed a growing elite consensus in Western democracies – he referred to it as ‘a mounting surplus of consensus’ – and argued that it would eventually bring an end to ‘responsible opposition’.
In line with Kirchheimer’s analyses of politics in the 1950s, a key assumption in the present-day cartel-party theory is that partisan conflict and policy competition between mainstream parties is in a state of dramatic decline (Katz and Mair Reference Katz and Mair1995: 22; 2009: 755). What is more, the originators of this theory suggest that depoliticization of national policymaking in the wake of globalization and Europeanization (Blyth and Katz Reference Blyth and Katz2005) largely is a result of deliberate strategies ‘by political elites who are reluctant to have their hands tied by the constraints of popular democracy’ (Mair Reference Mair2007: 8). Consequently, as mainstream parties – in the wake of intentional policy convergence – turn out to be ‘indistinguishable from one another in terms of their main policy proposals’ (Katz and Mair Reference Katz and Mair2009: 760), the cartel-party theory suggests that opposition increasingly becomes a concern for anti-system parties – what Kirchheimer (Reference Kirchheimer1966: 237) refers to as opposition in principle – or that it is reduced to ‘opposition within the cartel’, that is, to a contest between personalities rather than policy alternatives (Mair Reference Mair2007: 14; cf. Kirchheimer Reference Kirchheimer1957: 139).
If Parliamentary Opposition Is on the Wane, What Can Be Expected?
We argue that the literature on the waning of opposition yields two primary hypotheses about government–opposition relations that will be tested in this article.
First, a central argument advanced by both Kirchheimer (Reference Kirchheimer1957: 136–7) and Dahl (Reference Dahl1966b) is that classic parliamentary opposition is superseded by a close collaboration between major parties in parliament. More specifically, as consensual bargaining gradually replaces the articulation of policy alternatives – that is, when the cross-party mode of parliamentary decision-making displaces the opposition mode – Kirchheimer (Reference Kirchheimer1957: 136, 142) and Dahl (Reference Dahl1966c: 34) warned that the end result might be the abandonment of the principle of concentrated responsibility and alternative government. Similarly, Katz and Mair (Reference Katz and Mair1995: 22) highlight a presumed evolution towards increased elite consensus and argue that this development blurs the ‘the distinction between parties in office and those out of office’.
Thus, if the waning-of-opposition thesis is correct, we argue that consensual agreements between parties in government and parties in opposition should increase over time. Moreover, while the literature on the waning of opposition primarily focuses on parliamentary parties outside government (e.g. Andeweg Reference Andeweg2013: 103–4; Helms Reference Helms2008a, Reference Helms2008b; Norton Reference Norton2008), we suggest that it is also likely to expect governments to become increasingly accommodating to the proposals of the opposition. Therefore, if the waning-of-opposition thesis is correct, we maintain that the following hypothesis should gain support:
Hypothesis 1: The government increasingly accommodates the proposals and critique of the opposition over time.
Second, as regards the opposition mode, the primary role of the parliamentary opposition is to act as an alternative government. Such a ‘responsible’ opposition is expected to act as a fierce critic of the government, opposing and voting against government propositions in parliament.
However, if opposition parties increasingly find themselves in agreement with government proposals, manifest conflicts in the parliamentary arena – that is, situations when the opposition launches counterproposals and, especially, rejects government bills outright (e.g. Andeweg Reference Andeweg2013: 101; Kirchheimer Reference Kirchheimer1957: 138) – is obviously a marginal element of parliamentary decision-making. Consequently, if opposition indeed is on the wane, the following hypothesis should also gain support:
Hypothesis 2: The frequency by which the opposition launches counterproposals to, and rejects government bills outright, declines over time.
In sum, if the waning-of-opposition thesis is correct, we should expect an ascending rate of parliamentary politics in the cross-party mode (H1) and a descending rate of politics in the opposition mode (H2).
DATA AND MEASURES
Governments and Opposition Parties in Sweden, 1970–2014
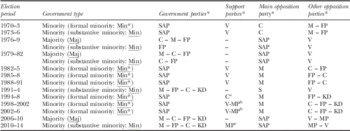
For the 44-year period under study here, government formation has been heavily dominated by the bloc-political divide between right-wing (bourgeois) partiesFootnote 2 and left-wing (socialist/green) parties.Footnote 3 With a few minor exceptions,Footnote 4 Swedish governments have been either Social Democratic one-party cabinets or right-wing coalition cabinets. Additionally, as shown in Table 1, ‘substantive minority governments’ (Strøm Reference Strøm1990: 62, 95) have been rare (only five out of 13). More specifically, before the mid-1990s the Left (former Communist) Party mostly acted as a support party Footnote 5 of Social Democratic minority governments, whereas the Social Democrats in the 1990s and 2000s negotiated formal support agreements with the Centre Party or the Greens and the Left Party – labelled ‘parliamentarism by contract’ (Bergman et al. Reference Bergman, Ecker and Müller2013: 42). Therefore, as seen in Table 1, most Social Democratic one-party cabinets can be categorized as ‘formal minority governments’ or ‘majority governments in disguise’ (Strøm Reference Strøm1990: 61–2). Hence, in spite of the multiparty system, the resilient bloc-divide implied that Sweden has been ruled by de facto majority governments throughout most of the period studied in this article. Therefore, we suggest that the structural parameters of the relationship between government and opposition in Sweden do not deviate systematically from what is typical of other parliamentary regimes in Western Europe (Bergman et al. Reference Bergman, Ecker and Müller2013: 40–1).
Government Types, Parties in Government, Support Parties and Parties in Opposition in Sweden, 1970–2014

Note: *Parties ordered by number of seats in parliament. Maj=Majority government, Min*=Formal minority government (i.e. de facto majority), Min=Substantive minority government (Distinctions are based on Strøm Reference Strøm1990).
a=Negotiated support agreement between the SAP government and C (1995–7).
b=Negotiated support agreement between the SAP government and MP.
c=Negotiated support agreement between the M – FP – C – KD coalition government and MP only in the field of immigration policy.
Party abbreviations: C=Centerpartiet/Centre Party; FP=Folkpartiet/Liberals; KD=Kristdemokraterna/Christian Democrats; MP=Miljöpartiet de Gröna/Greens; M=Moderaterna/Conservative (Moderate) Party; SAP=Socialdemokraterna/Social Democrats; V=Vänsterpartiet/Left Party.
Source: Based on Döring and Manow (Reference Döring and Manow2012).
Turning to our definitions of opposition parties, we make the following two distinctions. First, drawing on Norton (Reference Norton2008: 237–8), the largest opposition party takes centre-stage in our study. Specifically, if the largest opposition party does not oppose government policy, we argue that opposition is surely – depending, of course, on the size and significance of the party in question – in a state of decline. We use the term the main opposition party when referring to this pivotal party (Norton Reference Norton2008: 237). In Sweden, either the Conservative Party or the Social Democratic Party has occupied the position of main opposition party since 1973.Footnote 6 Second, we refer to smaller parties that do not participate in government as opposition parties in the plural (Norton Reference Norton2008: 237–8). Moreover, in light of the resilient bloc-divide in Sweden, the opposition parties are defined as the remaining parties in the same political bloc as the main opposition party.Footnote 7
The Data Set: Committee Decision-making in Sweden, 1970–2014
In line with a number of parliamentary researchers, we maintain that decision-making in committees is most suitable for analysing patterns of conflict and consensus between the parties in the parliamentary arena (Damgaard Reference Damgaard1973; Damgaard and Mattson Reference Damgaard and Mattson2004; Mattson and Strøm Reference Mattson and Strøm2004; Rommetvedt Reference Rommetvedt1992: 67; Sjölin Reference Sjölin1993: 19–20). The empirical analyses of government–opposition relations presented in this article draw on an extensive database which has been built up from a content analysis of reports from all standing committeesFootnote 8 in the Swedish parliament covering a period of over 40 years – from 1971, the first year of the unicameral Riksdag, up to 2014. To make data collection manageable while still allowing for comparisons over time, the mid-parliamentary session years from each of the 13 election periods 1971–2014Footnote 9 were selected for coding.Footnote 10
In all, the database contains 4,657 committee reports on government bills. Various types of data have been collected from each committee report concerning (1) the proposals – that is, government bills and private members’ motionsFootnote 11 – on which the preparation of business in the committee is based, (2) the content of the issues dealt with in the report,Footnote 12 and (3) various aspects of the committee decisions – that is, minority reservations and amendments to government bills (cf. Sjölin Reference Sjölin1993: 24–5).
However, for the purpose of this article only variables that explicitly concern the relationship between the government and the opposition are of relevance. Therefore, we focus on the decision variables (3) and, albeit to a lesser extent, the proposals (1) (from the opposition parties). Drawing on our distinctions above, we then focus on the position taken, in each committee report, of the committee majority, on the one hand, and the main opposition party along with the remaining opposition parties, on the other hand. Additionally, inter-coder reliability tests have been performed to ensure quality of the coding procedure.Footnote 13
Operationalizing the Hypotheses
In order to test our first hypothesis, H1, which expects parliamentary consensus and cooperation between government and opposition to increase over time, we develop two measures. First, we explore the share of proposals from the main opposition party and the remaining opposition parties respectively that are partly or fully accepted by a majority in the committee.Footnote 14 Second, we explore the percentage of government bills subjected to amendments – that is, substantial changes – by the committee majority when the opposition criticizes the proposed bill and files a reservation to the committee report (cf. Sjölin Reference Sjölin1993: 170–5, 192–7).Footnote 15 If the share of accommodated motions and bills amended to account for dissenting views from the opposition increases over time, we argue that H1 is supported (cf. Sjölin Reference Sjölin1993: 170–1).
To test our second hypothesis, H2, which expects politicization and conflict between government and opposition to decrease over time, we develop three measures. First, in order to tap into the degree of politicization in parliament, we explore the proportion of committee reports where the opposition launches counterproposals to the government bill (cf. Damgaard and Mattson Reference Damgaard and Mattson2004: 118; Sjölin Reference Sjölin1993: 182–5). Second, in order to gauge the general trend of policy contestation between government and opposition, we explore the share of committee reports with reservations issued by the opposition parties. However, while a reservation filed to a committee report signals a dissenting view, it does not necessarily imply that the opposition party in question challenges the overall direction of a proposed policy. Therefore, our third and most crucial measure taps into the percentage of committee reports in which the opposition rejects the government bill outright (cf. Andeweg Reference Andeweg2013: 101; Sannerstedt and Sjölin Reference Sannerstedt and Sjölin1992: 111–13; de Winter Reference de Winter2004: 47).Footnote 16 If the opposition formally rejects government bills outright, we argue that this captures the very essence of politics in the opposition mode (Kirchheimer Reference Kirchheimer1957: 131, 138; 1966: 237; cf. Dahl Reference Dahl1966a: xviii). Thus, if the share of counterproposals, reservations and, particularly, policy rejections from the opposition declines over time, we argue that H2 is supported.
FINDINGS
Committee Decision-making in the Cross-party Mode
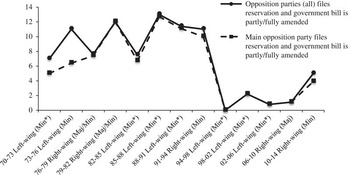
If the waning-of-opposition thesis is correct, H1 states that we should see a trend towards increased cooperation, and consensus between governments and the opposition. Yet, the results in both Figures 1 and 2 point in the exactly opposite direction.
The Share of Committee Reports with Proposals from the Opposition that Are Partly or Fully Accommodated by the Committee Majority (the Government) (13 Centre-Left and Centre-Right Governments, 1970–2014) Note: In Figure 1, (Maj) stands for majority governments and (Min*) stands for ‘formal minority governments’ or what Strøm (Reference Strøm1990: 61–2) refers to as ‘majority governments in disguise’. (Min) stands for substantive minority governments (see Table 1). The total number of bills with proposals from the opposition, for each government period, is the following in chronological order: 84; 90; 325; 430; 215;197; 193; 211; 113; 158; 153; 232; 150 (N=2393). The total number of bills for each period in chronological order is: 258; 299; 686; 773; 359; 315; 289; 381; 199: 230; 240; 349; 279 (N=4657). Source: Content analysis of 4,657 committee reports in the Swedish parliament (Riksdag), 1970–2014.

Full or Partial Amendments of Government Bills When the Opposition File Reservations to the Committee Report (13 Centre-Left and Centre-Right Governments, 1970–2014) Note: For details, see note to Figure 1. The total number of committee reports in which the majority in the committee made substantial changes to the proposed bill of the government is 534, which is 11 per cent of all committee reports in the sample. For further details on the number of reports, see note to Figure 1. Source: Content analysis of 4,657 committee reports in the Swedish parliament (Riksdag), 1970–2014.

Figure 1 displays the share of committee reports in which the ruling majority partly or fully accommodates the counterproposals of all opposition parties, and the main opposition party is considered separately. In contrast to the waning-of-opposition thesis, the results show that Swedish governments’ willingness to cooperate with the opposition has declined steadily over time. More precisely, whereas governments in the mid-1970s and early 1980s adjusted to the proposals of the opposition in approximately 20 per cent of all of their proposed bills, this share dropped to almost zero in the mid-1990s and has only climbed to 7.5 per cent – the right-wing substantive minority government of 2010–14 – since then.
Additionally, when turning to our second operationalization of H1, the tendency of declining cooperation between government and opposition becomes equally obvious.
The results in Figure 2 show that the degree to which Swedish governments change or make amendments to their proposed bills, in order to accommodate dissenting views from the opposition, decreases markedly over time (cf. Sjölin Reference Sjölin1993: 173).
In all, the following observations follow from the results in Figures 1 and 2: Whereas both majority (Maj/Min*) and substantive minority (Min) governments in the 1970s and, to a somewhat lesser extent, in the 1980s displayed a fairly large willingness to compromise with the opposition parties across the blocs, the Social Democratic government between 1994 and 1998 appears to have started a new trajectory in Swedish politics (cf. Aylott Reference Aylott2011: 313). This government clearly departed from the behaviour of previous Swedish governments by almost completely excluding the opposition parties from parliamentary decision-making (cf. Christiansen and Damgaard Reference Christiansen and Damgaard2008: 56). Additionally, this transformation appears to have set the tone for subsequent governments. Hence, although the right-wing government of 2010–14 deviates somewhat from this development – due to a substantive minority position in parliament (see Table 1), discussed further below – the overall trend is unmistakable. Instead of colluding with the opposition, Swedish governments – irrespective of whether or not they control a majority of the seats in parliament – increasingly act as coherent, bloc-specific actors (cf. Aylott Reference Aylott2011: 314; Christiansen and Damgaard Reference Christiansen and Damgaard2008: 52). Consequently, instead of finding an ascending rate of parliamentary politics in the cross-party mode, the trend over time is clearly descending. Therefore, we argue that H1 is rejected in the Swedish case.
Still, while our results show that governments’ willingness to cooperate with the opposition is clearly on the wane, this development could indicate that responsible opposition, as envisioned by Kirchheimer (Reference Kirchheimer1957), is in fact withering away. More specifically, if opposition parties lose influence over policymaking, while simultaneously failing to act as an alternative government (Andeweg Reference Andeweg2013: 103), opposition is indeed waning regardless of the behaviour of governments. However, our three measures of the classic features of the opposition mode account for this objection.
Committee Decision-making in the Opposition Mode
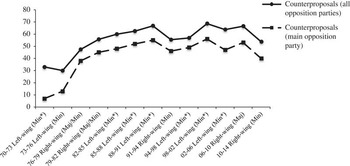
When turning to H2, we first expect to find a declining propensity from the opposition in general, and especially from the main opposition party, to disagree with the government and launch counterproposals. However, when testing this first aspect of H2 in Figure 3, our results again cast significant doubt over the waning-of-opposition thesis.
The Share of Committee Reports with Counterproposals from the Opposition (13 Centre-Left and Centre-Right Governments, 1970–2014) Note: For details on data, see note to Figure 1. Source: Content analysis of 4,657 committee reports in the Swedish parliament (Riksdag), 1970–2014.

The overall result that can be inferred from Figure 3 is that the share of counterproposals from the opposition has increased noticeably over time. From the early 1970s up to 1990 the trend was sharply increasing, stabilizing at an average of 70 per cent of all committee reports for the opposition in general and 50 per cent for the main opposition party. This result indicates that all Swedish opposition parties are becoming more, and not less, vigorous in their attempts to scrutinize the government. It should also be observed that Figure 1, above, shows that the percentage of counterproposals from the main opposition which are accepted by the ruling majority has been declining steadily over the 44-year period. Thus, instead of finding a trend towards increased consensus (e.g. Katz and Mair Reference Katz and Mair2009), our results again contradict the waning-of-opposition thesis. Additionally, when reviewing our second measure of H2 in Figure 4, the results further substantiate this interpretation.
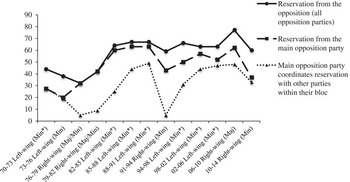
The Share of Committee Reports with Reservations and Coordinated Reservations from the Opposition (13 Centre-Left and Centre-Right Governments, 1970–2014) Note: For details, see note to Figure 1. The total number of committee reports with reservations, for each government period, is the following in chronological order: 263; 296; 385; 237; 221; 214; 197; 132; 163; 152; 229; 168 (N=2657). Source: Content analysis of 4,657 committee reports in the Swedish parliament (Riksdag), 1970–2014.

Reviewing the general trend of policy contestation over a 44-year period in Figure 4, the upturn is staggering. As far as all opposition parties are concerned, the share of committee reports with reservations has climbed from an average of 38 per cent in the 1970s to 63 per cent in the 1990s, and then to an average of 69 per cent in the 2000s. Moreover, the results in Figure 4 also indicate that the main opposition party becomes more confrontational over time, whereas the trend line below indicates that this party, from the mid-1990s and onwards, increasingly coordinates its reservations with other opposition parties. More precisely, while reservations coordinated within the bloc only occurred among right-wing opposition parties up until the end of the 1990s, Figure 4 shows that all reservations filed by the main opposition party, the Social Democrats, in the late 2000s were coordinated with reservations from other opposition parties.Footnote 17 Additionally, like the descending rate of politics in the cross-party mode displayed in Figures 1 and 2, the ascending rate of politics in the opposition mode, displayed in Figure 4, hardly fluctuates between majority and minority governments – with the expectation of coordinated reservations during the right-wing minority government 1991–4 (see note 17). Accordingly, while the results in the previous section show that governments increasingly act as coherent blocs of parties, the results in Figure 4 indicate that this conclusion also holds true for the opposition.
However, a pertinent objection to how we interpret our results could be that the opposition, in spite of issuing reservations, in practice agrees with the main direction of government policy. Differently put, it could be that the trend towards increased policy contestation presented so far in practice amounts to nothing more than ‘opposition within the cartel’ (Kirchheimer Reference Kirchheimer1957: 137–8; Mair Reference Mair2007: 14). However, our third and most crucial measure of the opposition mode may account for this objection.
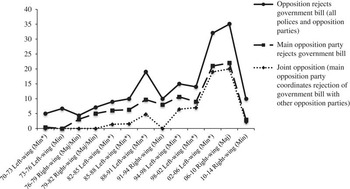
As shown in Figure 5, intense contestation over policies presented by the government – that is, when the opposition rejects government bills outright – has risen markedly over time. Moreover, even though the degree of policy rejections is highest during majority governments (Maj/Min*), and lowest during substantive minority governments (Min), the upward trend is obvious. Moreover, the dotted line – which denotes joint opposition – indicates that the opposition within each bloc is becoming increasingly harmonized over time. Thus, when considering the overall trend, bloc-specific opposition against the policy direction of governments is rising rather than waning. However, as seen in Figure 5, this trend comes to an abrupt halt with the right-wing minority government of 2010–14. Does this change of trend indicate that opposition is waning after all? We argue that it does not.
The Share of Committee Reports Where the Opposition Rejects the Proposed Government Bill (13 Centre-Left and Centre-Right Governments, 1970–2014) Note: For details, see note to Figure 1. The total number of committee reports with rejections, for each government period, is the following in chronological order: 33; 30; 55; 31; 31; 54; 39; 29; 31; 77; 122; 28 (N=560). Source: Content analysis of 4,657 committee reports in the Swedish parliament (Riksdag), 1970–2014.

In fact, as a result of the radical right party, the Sweden Democrats (SD), gaining parliamentary representation in September 2010, the right-wing government failed to reach a majority in parliament. Therefore, since all established parties in parliament refuse to cooperate with the Sweden Democrats (Loxbo Reference Loxbo2014), the right-wing minority government found itself in a very difficult – and, by Swedish standards, historically unique – position. In short, the government could not rely on the parties in its own bloc to pass its own bills, but instead had to depend on the established opposition – the so-called Red-Green parties – or the pariah-branded Sweden Democrats. Yet, although the frequency of rejected bills dropped considerably, the new parliamentary situation of 2010–14 did not – as clearly indicated in Figures 1 and 2 above – translate into an improved cooperative climate between government and opposition across the blocs. On the contrary, the declining degree of rejections does not imply that opposition is waning, but is instead a result of the government’s tactic to refrain from presenting controversial policy bills in the first place. Thus, the government’s main strategy has been to incorporate controversial proposals into the yearly budget bill.Footnote 18
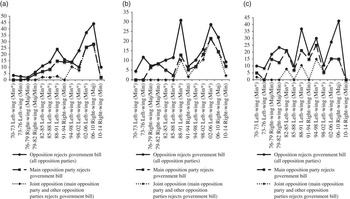
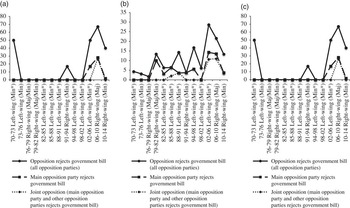
Yet, since the data in Figure 5 only display the overall trend over a 44-year period, another relevant objection could be that the boost in partisan conflict is due to the increased saliency of new policy dimensions, or disagreements over technical issues of minor importance to the electorate. Thus, opposition might still be on the wane along the traditional left–right divide (Katz and Mair Reference Katz and Mair2009). In order to account for this objection, Figure 6 breaks down the trend lines in Figure 5 by three policy areas of vital importance to the left–right divide. Subsequently, Figure 7 reviews corresponding trends in policy areas pertaining to the so-called cultural dimension (e.g. Bornschier Reference Bornschier2010).
The Share of Committee Reports Where the Opposition Rejects the Proposed Government Bill in Three Different Policy Areas of Relevance to the Left–Right Divide (13 Centre-Left and Centre-Right Governments, 1970–2014): (a) Welfare State and Labour Market Policy; (b) Economic and Industrial Policy; (c) Tax Policy Note: The total number of committee reports on government bills in the policy area in question, for each government period, is the following in chronological order: Welfare state and labour market policy: 28; 37; 98; 113; 46; 49; 34; 44; 29; 40; 43; 87; 58 (N=706). Economic and industrial policy: 44; 60; 123; 133; 59; 43; 39; 58; 29; 38; 28; 41; 43 (N=738). Tax Policy: 20; 24; 54; 64; 38; 30; 19; 27; 20; 19; 33; 40; 19 (N=407). The total number of bills in chronological order is: 557; 686; 773; 359; 315; 289; 381; 199: 230; 240; 349; 279 (N=4657). Source: Content analysis of 4,657 committee reports in the Swedish parliament (Riksdag), 1970–2014.

The Share of Committee Reports Where the Opposition Rejects the Proposed Government Bill in Three Different Policy Areas of Relevance to the Cultural (Authoritarian–Libertarian) Dimension (13 Centre-Left and Centre-Right Governments, 1970–2014): (a) Immigration/Integration Policy; (b) Policies on Law and Order; (c) Cultural Policy Note: The total number of committee reports on government bills in the policy area in question, for each government period, is the following in chronological order: Immigration/integration policy: 2; 2; 4; 7; 5; 1; 7; 6; 7; 6; 6; 15; 8 (N=76). Policies on law and order: 23; 32; 58; 82; 32; 47; 28; 27; 18; 33; 28; 37; 30 (N=475). Cultural Policy: 18; 20; 35; 44; 22; 19; 22; 29; 15; 13; 9; 3; 5 (N=254). The total number of committee reports in chronological order is: 557; 686; 773; 359; 315; 289; 381; 199; 230; 240; 349; 279 (N=4657). Source: Content analysis of 4,657 committee reports in the Swedish parliament (Riksdag), 1970–2014.

When comparing the data in Figures 6 and 7, we see that the overall trend of increased policy contestation is equally, or even more, obvious when only considering separate policy areas of strong relevance to the left–right divide, on the one hand, and the cultural divide on the other. Simply put, contestation between government and opposition is clearly on the rise in all of these areas. Yet, the most crucial difference between the results in Figures 6 and 7 is that the main opposition party has become a much more active contestant of left–right policies over time, whereas increased rejections in the three ‘non-material’ policy areas primarily are due to the changed behaviour of the remaining opposition parties. Despite these differences, we argue that the general observations in Figures 5 to 7 sharply contradict the waning-of-opposition thesis. Therefore, in spite of the change of trend at the end of the period (2010–14), we maintain that H2 is also rejected.
CONCLUSIONS
The waning-of-opposition thesis (Kirchheimer Reference Kirchheimer1957, Reference Kirchheimer1966), and its restatement in the form of the modern cartel-party theory (e.g. Katz and Mair Reference Katz and Mair1995, Reference Katz and Mair2009), holds that the classic opposition mode of parliamentary politics is in a spiral of decline over time. Still, while this idea appears to be widely accepted in the political science literature, it is hardly ever backed up by empirical data on the actual behaviour of government and opposition parties. However, drawing on unique longitudinal data on committee decision-making in the Swedish parliament, this article contributes to the literature by carrying out the first systematic test of the waning-of-opposition thesis. First, if the waning-of-opposition thesis were correct, our first hypothesis (H1) holds that we should expect more consensual behaviour between government and opposition over time. Yet, our measures of amended government proposals and accepted counterproposals from the opposition forcefully kick back on this expectation. Instead of observing a trend towards increased cooperation and consensus, our results point in the exactly opposite direction.
Second, and perhaps more to the heart of the waning-of-opposition thesis, our subsequent hypothesis (H2) states that politicization and conflict between government and opposition should decrease over time. When reviewing our data, we instead observe a tendency of sharpened conflict over time in the case of opposition parties launching more counterproposals and increasingly rejecting government proposals. Additionally, in sharp contrast to the postulates of the cartel-party thesis (e.g. Katz and Mair Reference Katz and Mair2009: 754), our results show that the overall trend of increased policy contestation is equally, or even more, obvious when only considering separate policy areas of relevance to the left–right divide. In sum, rather than corroborating the waning-of-opposition thesis, our results indicate a very pronounced upturn in controversies over policy between the government and the opposition in Sweden.
However, due to transformations of the Swedish party system over the course of the last two decades (e.g. Bergman and Bolin Reference Bergman and Bolin2011: 253), a possible objection to our findings could be that the Swedish case is unrepresentative of other parliamentary democracies. More precisely, as long as the Social Democratic Party was strong enough to dominate Swedish politics by forming policy alliances on an issue-by-issue basis, outright opposition against the ‘social democratic hegemony’ might have been perceived as a rather futile enterprise (cf. Bergman et al. Reference Bergman, Ecker and Müller2013: 41). Therefore, it is possible that the descending rate of parliamentary cooperation and the ascending rate of policy conflicts revealed in this article are largely functions of party system fragmentation in the wake of a weakened Social Democratic Party.Footnote 19 Yet, despite party system change, we argue that there are two primary reasons why the structural parameters of the relationship between government and opposition in Sweden do not deviate systematically from other parliamentary democracies in Europe.
First, in spite of the weakened Social Democratic Party, the relative electoral strength of parties to the left and right remains stable in Sweden. Moreover, since the Social Democratic Party has gradually lost its pivotal position in the party system, the balance of power between parties to the left and right in Sweden has in fact become more similar to other European multiparty systems over time. Second, as bipolar competition between the two blocs has increased since the beginning of the 1990s (Aylott Reference Aylott2011), Sweden clearly follows a trajectory that has also been observed in several other European party systems (e.g. Allern and Aylott Reference Allern and Aylott2009; Arter Reference Arter2006; Aylott Reference Aylott2011; Christiansen and Damgaard Reference Christiansen and Damgaard2008; Hagevi Reference Hagevi2015).
Although the evolution of bipolar competition in Sweden resembles the development in other parliamentary democracies in Europe, it has been argued that the waning of opposition should be particularly pronounced in Sweden and the Nordic countries (e.g. Bergman and Strøm Reference Bergman and Strøm2011: 383–4). Since our findings point in exactly the opposite direction, we argue that the evidence presented in this article carries enough weight to cast serious doubt over the general proposition that opposition in parliamentary regimes is on the wane. While our results cannot automatically be generalized to other cases, we argue that the historical trend revealed in the Swedish case is so clear-cut that it calls for alternative hypotheses about the historical fate of parliamentary opposition rather than the ones that dominate contemporary research.
Additionally, we argue that the results presented in this article further underscore the need to distinguish between opposition in different arenas (Andeweg Reference Andeweg2013). Specifically, while scholars have demonstrated a long-term trend towards programmatic convergence between political parties in the electoral arena (e.g. Oskarson and Demker Reference Oskarson and Demker2015), our findings clearly suggest that this development does not automatically translate into interparty collusion in the parliamentary arena. Instead, we wish to emphasize that ideological polarization in the electoral arena and political conflict in the parliamentary arena are distinct phenomena that do not necessarily go hand in hand. On the contrary, it is possible that parliamentary conflicts are quite intense even if they are not always visible in electoral campaigns. Thus, since the long-term fate of opposition obviously depends on how parties behave in both arenas, we suggest that a promising avenue for future research is to develop measures of policy contestation in the parliamentary arena and compare them with data on ideological polarization in the electoral arena.
Lastly, we wish to emphasize the potentially disruptive effects on the government–opposition dynamic of radical right parties on the rise. Although we find a clear historical trend towards increased contestation between mainstream parties in Sweden, there are now indications that this development has come to a halt due to the electoral upswing of the Sweden Democrats in the 2014 election. More precisely, since the Sweden Democrats control the balance of power in the Swedish parliament, the new left-wing government (which is a substantive minority government) has struck an agreement with the right-wing opposition – referred to as the December agreement – to exclude this party from influence. Accordingly, for the first time in modern Swedish history parties in government and parties in opposition have made a formal agreement to enable minority rule. However, it is a question for future research to examine whether the perceived threat from the radical right will finally bring an end to the 44-year trend towards increased contestation between mainstream parties in Sweden. We argue that future research on the government–opposition dynamic in Western European parliamentary democracies is well advised to account for the impact of the radical right.