


1. Introduction
In his first official White House press briefing, Press Secretary Sean Spicer claimed that the 2017 inauguration of President Trump drew “the largest audience ever to witness an inauguration, period, both in person and around the globe” (White House 2017). This statement was quickly challenged in the popular press when photographs of the National Mall surfaced showing significantly larger crowds during the 2009 inauguration of President Obama. When presented with both photographs however, 41% of Trump voters surveyed in a national poll misidentified the Obama inauguration crowd for the Trump inauguration crowd, and 15% went so far as to claim that the inauguration photo with the objectively sparser crowd actually had more people in it (Schaffner and Luks Reference Schaffner and Luks2017). These claims are false but does the fact that an agent believes them mean they have done something wrong?
Such beliefs are often taken as evidence that we now live in a “post-truth” reality in which emotional appeals guided by personal interests are more important than evidence in shaping what is believed to be true. This rise of post-truth rhetoric connects to a series of fundamental questions about the normative status of belief in folk epistemology, or the suite of concepts and principles that implicitly guide intellectual evaluations in ordinary social cognition. Do we have intellectual obligations to believe certain things? And if so, what factors generate the obligations? For example, do we have an intellectual obligation to believe that one photograph contains more people? If so, is that because the evidence supports the conclusion? One hypothesis, broadly consistent with post-truth relativism, is that there are no intellectual obligations to believe. According to this hypothesis, it is permissible to believe false things contrary to evidence whenever it suits us to do so. A rival hypothesis is that there are at least some intellectual obligations. A natural adjunct to the alternative hypothesis is that intellectual obligations are due to the evidence we have or what we know to be true. Although beliefs might sometimes be formed by prioritizing personal interests over evidence and objective facts, this is often a mistake.
It is currently unknown if responsibility judgments extend from the moral domain, concerning how one ought to behave, to the intellectual domain, concerning what one ought to believe, although prior research in psychology supports the hypothesis that they do. Several theorists have argued that a fundamental property of moral judgment is to regulate and sustain social relations (Flack and de Waal Reference Flack and de Waal2000; Rai and Fiske Reference Rai and Fiske2011; Cushman Reference Cushman, Sterelny, Joyce, Calcott and Fraser2013; Malle et al. Reference Malle, Guglielmo and Monroe2014). According to the relationship regulation theory of moral judgment, for example, “the core of our moral psychology consists of motives for evaluating and guiding one's own and others’ judgments and behaviors” to promote social relationships prescribed to sustain groups, and this includes the evaluation of “speech, emotions, attitudes, and intentions” (Rai and Fiske Reference Rai and Fiske2011: 59). To the extent that such attitudes promote social cohesion and interpersonal attraction (Lott and Lott Reference Lott and Lott1965; Sachs Reference Sachs1975; Byrne Reference Byrne1997; Friedkin Reference Friedkin2004), and partially determine the prescriptions people ultimately accept (e.g. Kohlberg Reference Kohlberg1984; for discussion see Sripada and Stich Reference Sripada, Stich, Carruthers, Laurence and Stich2006), it is reasonable to suppose that responsibility judgments sometimes extend to beliefs.
The existence of intellectual responsibilities remains a foundational question in philosophy, although a host of leading philosophers challenge the hypothesis that responsibilities extend to belief. As plausible as such responsibility attributions might initially seem in psychology, many philosophers have argued that no such responsibilities exist. According to this line of thought, intellectual responsibilities are ruled out by a pair of plausible theoretical principles. The first principle, known as “doxastic involuntarism,” states that we are unable to control our beliefs (Williams Reference Williams1973; Alston Reference Alston1988; Bennett Reference Bennett1990; Pojman Reference Pojman1999; Buckareff Reference Buckareff2004; cf. Turri et al. Reference Turri, Rose and Buckwalter2018). The second principle, known as “ought implies can” (“OIC” for short), states that responsibility requires ability (Moore Reference Moore1922; Streumer Reference Streumer2003; Vranas Reference Vranas2007; Copp Reference Copp2008). More specifically, this principle states that someone is responsible for doing something only if they are able to do it. Putting these two foundational principles together, then, we cannot have intellectual responsibilities to believe propositions because we are unable to control our beliefs, which is a necessary condition for responsibility (for discussion, see Ryan Reference Ryan2003).
Recent work in experimental cognitive science has demonstrated that the “ought implies can” principle does not accurately describe judgments in some normative domains, such as moral judgment (for a review, see Buckwalter Reference Buckwalter2017). Several teams of researchers have identified circumstances in which participants attribute moral responsibilities, obligations, and duties to agents for outcomes that they are unable to produce (Buckwalter and Turri Reference Buckwalter and Turri2015; Mizrahi Reference Mizrahi2015; Chituc et al. Reference Chituc, Henne, Sinnott-Armstrong and De Brigard2016; Turri Reference Turri2017a, Reference Turrib). In one set of studies, for example, researchers presented participants with stimuli describing an employer evaluating an employee's performance (Turri Reference Turri2017b). Researchers found that participants judged that the employer had a “moral responsibility to give the employee a good evaluation” when she did in fact perform excellently, even if it was “literally impossible” for the employer to do so. These results indicate that inability does not always preclude the attribution of moral responsibility. This suggests that the “ought implies can” principle may not preclude responsibility attribution in the intellectual domain, but the possibility has not been tested with respect to beliefs.
This possibility raises three central research questions for studying intellectual responsibility, as reflected in ordinary social cognition. First, pre-theoretically, do we recognize intellectual responsibilities to believe propositions at all? Second, assuming that we do recognize at least some such responsibilities, do we attribute intellectual responsibilities to agents who are unable to fulfill them? That is, does commonsense psychology implicitly reject the “ought implies can” principle in the intellectual domain, as it does in the moral? Third, on the basis of what factors do we attribute intellectual responsibilities? In particular, contrary to currently fashionable post-truth rhetoric, do evidence and objective truth-value matter?
This paper presents four experiments advancing our understanding of intellectual responsibility for believing on each of these dimensions. Experiments 1 and 2 demonstrate that we strongly attribute intellectual responsibilities to others, and that we do so when it is both possible and impossible for them to believe a proposition. Experiment 3 demonstrates that intellectual responsibility attributions are significantly predicted by both having good evidence for a proposition and the fact that the proposition is true rather than false. Experiment 4 replicates this effect and demonstrates that evidence and truth continue to predict epistemic responsibility attributions when the practical consequences of failing to believe are both trivial and serious. Overall, the results suggest that folk epistemology recognizes the existence of intellectual responsibilities to believe, that such responsibilities sometimes exceed what agents are able to believe, even when doing so would be emotionally unpleasant, and that such responsibilities are grounded in both evidence and objective truth-value.
2. Experiment 1
This experiment tests whether people attribute intellectual obligations to believe a proposition, and whether this occurs even when the agent is unable to fulfill the obligation (i.e. form the relevant belief).
2.1 Method
One hundred and sixty-five participants were tested (aged 20–69 years, mean age = 35 years; 65 female; 98% reporting English as a native language). Participants were U.S. residents, recruited and tested online using Amazon Mechanical Turk and Qualtrics, and compensated $0.35 for approximately 2 minutes of their time. Following prior research on ability and obligation judgments, we decided in advance to recruit approximately 40 participants per condition. Repeat participation was prevented within and across experiments. The same recruitment and compensation procedures were used for all experiments reported in this paper.
Participants were randomly assigned to one of four conditions in a 2 (ability: possible, impossible) × 2 (scenario: evaluation, diagnosis) between-subjects design. All participants read a simple story, responded to four test items, then completed a brief demographic questionnaire.
The materials were closely adapted from previous research featuring agents who are able or unable to perform an overt action (Turri Reference Turri2017b). Instead of focusing on an action, however, the present materials feature agents who are unable to perform a specific intellectual activity, namely, believe the relevant proposition. More specifically, the ability factor manipulates whether it is “literally impossible” or “possible” for an agent to believe something. To ensure that the results are not due to idiosyncratic features of a single vignette, multiple vignettes were used. The scenario factor manipulated whether the context of belief involved evaluating an employee or diagnosing a pet's illness. For example, here is the text of the story for the diagnosis scenario (ability manipulation in brackets):
Robert is walking his dog through a nearby park. All the evidence indicates that the dog has rabies. And it does have rabies. In [light/spite] of his deep emotional attachment to the dog, it is [impossible/possible] for him to believe that the dog has rabies. As a matter of brain chemistry, it is [literally impossible/definitely possible] for him to believe that the dog has rabies.
Here is the text of the story for the evaluation scenario (with the ability manipulation again in brackets):
Robert is evaluating the performance of a company employee. All the evidence indicates that the employee performed excellently. And the employee did perform excellently. Given the current condition of Robert's brain, it is [impossible/possible] for him to believe the employee performed excellently. As a matter of brain chemistry, it is [literally impossible/definitely possible] that he can believe the employee performed excellently.
After reading one of the stories, participants responded to four test items while the story remained at the top of the screen. Following past research, the first item involved a conceptual combination task designed to test the “ought implies can” principle. This item asked participants to indicate whether they thought the protagonist had an ability and/or intellectual responsibility to believe in a single evaluation. For example, participants who saw the diagnosis scenario were asked to “please choose the option that best applies” from a list of four response options (order rotated randomly):
1. Robert has an intellectual responsibility to believe the dog has rabies, and he is able to do so.
2. Robert has an intellectual responsibility to believe the dog has rabies, but he is not able to do so.
3. Robert does not have an intellectual responsibility to believe the dog has rabies, but he is able to do so.
4. Robert does not have an intellectual responsibility to believe the dog has rabies, and he is not able to do so.
After completing this task, participants were taken to a new screen and presented with the other three test items:
It is possible for Robert to believe that the dog has rabies. (possible)
On a scale of 0% to 100%, how likely is it that Robert will believe that the dog has rabies? (percent)
Robert is blameworthy if he does not believe that the dog has rabies. (blame)
Responses to possible and blame items were collected on a standard 7-point Likert agreement scale, 1 (“strongly disagree”) – 7 (“strongly agree”), left-to-right across the participant's screen. Responses to the percent item were collected in a text box that allowed numerical values between 0 and 100 percent. Participants seeing the evaluation scenario saw similar items where the phrase “the dog has rabies” was replaced with “the employee performed excellently.”
2.2 Results
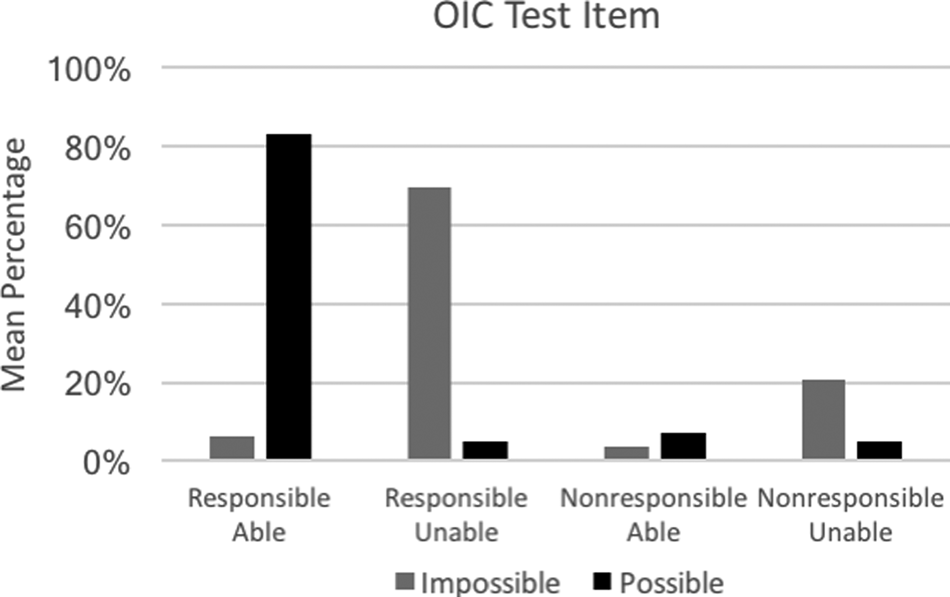
A preliminary multinomial logistic regression revealed that response to the OIC (“ought implies can”) test item was not significantly predicted by scenario, but it was predicted by ability condition. To explore this effect further, results were collapsed across scenarios and a chi-squared test was used. Collapsing across these scenarios, ability significantly affected responses to the OIC test item, χ2 (3, N = 165) = 110.45, p < 0.001, Cramer's V = 0.82. The “responsible and able” response was selected at rates exceeding chance in possible conditions (83%: binomial test, p < 0.001, test proportion = 0.25). The “responsible but unable” response was selected at rates exceeding chance in impossible conditions (70%: binomial test, p < 0.001, test proportion = 0.25, see Figure 1). A follow-up chi-squared test also showed that the rate of “responsible and able” answers in the possible conditions was greater than the rate of “responsible but unable” answers in the impossible conditions, χ2 (1, N = 165) = 4.24, p = 0.039, Cramer's V = 0.16.
Experiment 1. Mean percentage choosing each OIC test item option grouped by ability.

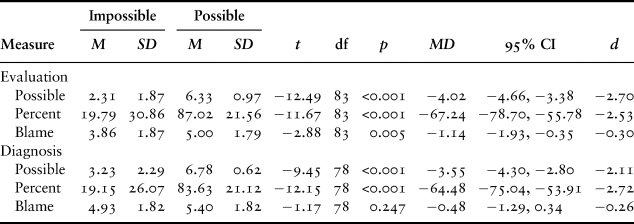
A multivariate analysis of variance showed that responses to possible, percent, and blame items were each affected by ability. There was also an effect of scenario on possible and blame items. No interactions were detected (see Table 1).
Experiment 1. Multivariate analysis of variance, Scenario, Wilks' Lambda = 0.870, F(3, 159) = 7.95, p < 0.001, ηp2 = 0.130, Ability, Wilks' Lambda = 0.344, F(3, 159) = 100.88, p < 0.001, ηp2 = .656, S*A, Wilks' Lambda = 0.988, F(3, 159) = 0.64, p = 0.589, ηp2 = 0.012.

Follow-up independent samples t-tests showed that mean response for possible, percent, and blame items for the evaluation scenario was significantly lower in the impossible condition than the possible condition. Mean response for possible and percent items for the evaluation scenario was significantly lower in the impossible condition than the possible condition (see Table 2).
Experiment 1. Independent samples t-tests by ability.

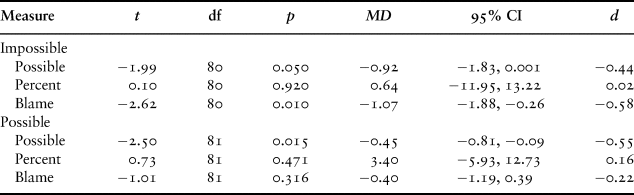
Follow-up independent samples t-tests also showed that mean response to possible and blame items for the evaluation scenario was significantly lower in the impossible condition than the possible condition. Mean response to the possible item for the evaluation scenario was significantly lower in the impossible condition than the possible condition (see Table 3).
Experiment 1. Independent samples t-tests by scenario.

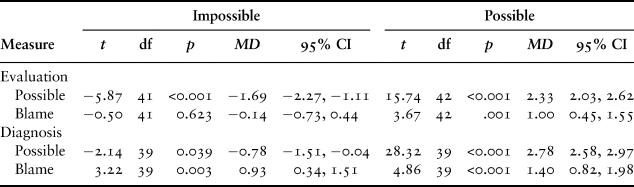
One sample t-tests showed that mean response to the possible item were below the neutral mid-point (=4) in all impossible conditions and above the mid-point in all possible conditions. One sample t-tests also showed that mean response to the blame item was above the mid-point in all conditions except the impossible condition of the evaluation scenario (see Table 4).
Experiment 1. One sample t-tests. Test value = 4.

2.3 Discussion
The results support the existence of intellectual responsibilities in ordinary social cognition. In two scenarios, the majority of participants indicated that protagonists have an intellectual responsibility to believe certain propositions. The results further indicate participants attribute these responsibilities even when they recognize that the agent is unable to form the relevant belief. Finally, the results indicate that agents are also sometimes considered blameworthy for failing to believe things even though it is impossible for those agents to believe them.
3. Experiment 2
This experiment tests whether the intellectual responsibility attributions observed in Experiment 1 replicate when using a different method to probe for responsibility judgments.
3.1 Method
One hundred and sixty-nine new participants were tested (aged 18–66 years, mean age = 33 years; 55 female; 95% reporting English as a native language). Participants were again randomly assigned to one of four conditions in a 2 (ability: possible, impossible) × 2 (scenario: evaluation, diagnosis) between-subjects design. The materials and testing procedures were identical with those used in Experiment 1, with one exception. In this experiment, the four-option OIC test item was replaced with a single item probing responsibility judgements with a scalar agreement measure. For example, in the diagnosis scenario, the responsibility test item read: “Robert has an intellectual responsibility to believe that the dog has rabies.” Responses were collected on the same 7-point Likert agreement scale, 1 (“strongly disagree”) – 7 (“strongly agree”) used above. After evaluating this item, participants advanced to a new screen and the experiment proceeded identically to Experiment 1.
3.2 Results
A preliminary multivariate analysis of variance showed that responses to all dependent variables were affected by assignment to the ability condition. Only the blame item was affected by scenario. No interactions were detected (see Table 5).
Experiment 2. Multivariate analysis of variance, Scenario, Wilks' Lambda = 0.914, F(4, 162) = 3.82, p = 0.005, ηp2 = 0.086, Ability, Wilks' Lambda = 0.322, F(4, 162) = 85.12, p <0.001, ηp2 = 0.678, S*A, Wilks' Lambda = 0.987, F(4, 162) = .53, p = 0.715, ηp2 = 0.013.

Prior work suggests that blame judgments can bias responsibility judgements when responsibility judgments are collected using scaled responses (Chituc et al. Reference Chituc, Henne, Sinnott-Armstrong and De Brigard2016). To test for the presence of this bias, a mediation analysis was conducted (Hayes Reference Hayes2013) with responsibility judgments as the outcome variable, assignment to ability condition as the independent variable (coded: 0 = impossible, 1 = possible), and blame judgments as a potential mediator. We found that scalar responsibility judgments were biased in this way: blame judgments mediated the effect of assignment to condition on responsibility judgments, indirect effect = 0.469 [0.18, 0.81], z = 3.06, p = 0.002, κ2 = 0.14.
Given that mediation occurred, a new multivariate analysis was conducted, controlling for blame judgments, to investigate the effects of ability and scenario on the dependent variables. After controlling for blame, the multivariate model was non-significant. This analysis showed that responses to responsibility, possible, and percent items were not significantly affected by scenario. Response to all three variables were affected by ability. There were no interactions (see Table 6).
Experiment 2. Multivariate analysis of variance controlling for blame, Scenario, Wilks' Lambda = 0.960, F(3, 162) = 2.27, p = 0.083, ηp2 = 0.040, Ability, Wilks' Lambda = 0.344, F(3, 162) = 103.20, p <0.001, ηp2 = 0.656, S*A, Wilks' Lambda = 0.987, F(3, 162) = 0.703, p = 0.551, ηp2 = 0.013, Blame, Wilks' Lambda = 0.666, F(3, 162) = 27.08, p <0.001, ηp2 = 0.334.

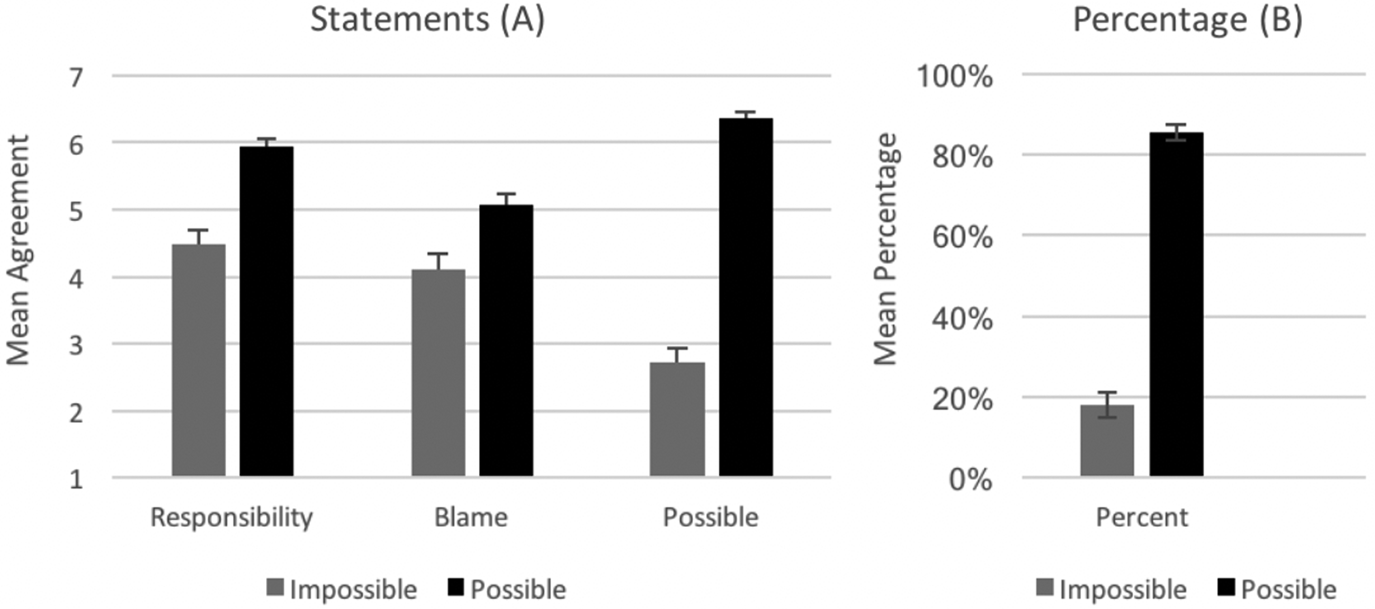
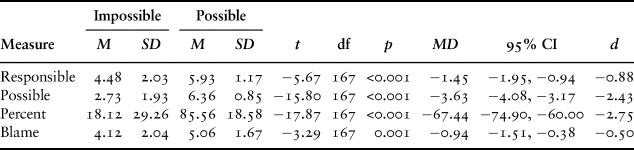
Follow-up independent samples t-tests (collapsing across scenario) showed that mean response was significantly lower for all test items in the impossible conditions than in possible conditions (see Figure 2 and Table 7).
Experiment 2. Panel A: mean response to test statements about whether an agent had an intellectual responsibility, deserves blame, and had a possibility to believe. Scales ran 1 (SD)–7 (SA). Panel B: mean estimate of the percentage chance that the agent would form the belief. Scales ran 0–100%. All error bars represent ± 1 SEM.

Experiment 2. Independent samples t-tests by ability.

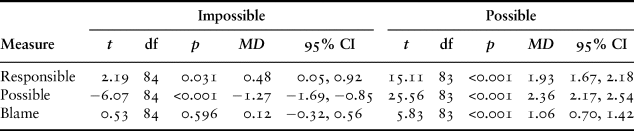
Given that there was no effect of scenario after controlling for blame, we also collapsed across scenario to test responsible, possible, and blame items against the neutral midpoint (=4) in both impossible and possible conditions (see Table 8). Mean response to the responsibility item was significantly above the midpoint while mean response to the possible item was significantly below the midpoint in the impossible condition.
Experiment 2. One sample t-tests. Test value = 4.

3.3 Discussion
This experiment replicates the main result of Experiment 1 that the intellectual responsibility to believe propositions is attributed to agents who lack the ability to believe them. Responsibility attributions were significantly affected by ability, but this effect was significantly mediated by blame attributions, and responsibility attribution significantly exceeded the midpoint in the impossible condition. Taken together, the findings from Experiments 1 and 2 suggest that although the method of probing can affect responses, there remains a detectable central tendency to attribute responsibilities despite inability. In other words, the probing method does not shift responses from an anti-OIC pattern to a pro-OIC pattern. Instead, using the scalar probing method depresses the extent to which we observe an anti-OIC pattern.
These results also replicate and expand upon prior findings demonstrating the existence of a bias known as “excuse validation.” According to this bias, the judgment that someone is blameless for accidentally violating a norm can paradoxically lead people to falsely deny that a norm violation occurred in the first place, in order to avoid the appearance that they are unfairly blaming the agent (Turri and Blouw Reference Turri and Blouw2015). In Experiment 1, the OIC test item was designed to prevent this bias from occurring, by allowing participants to indicate responsibility and ability in a single evaluation. Because information about inability can be exculpatory, we can, to some extent, avoid triggering excuse validation by allowing participants to evaluate exculpatory information in the same context that they evaluate the responsibility attribution. Alternatively, collecting responsibility and ability judgments in separate test items can promote excuse validation. And the present results are consistent with that happening. Decreased blame judgments for failing to form a belief caused decreased attributions that an intellectual responsibility existed to have been blameworthy for failing to fulfill.
4. Experiment 3
The prior experiments demonstrate that the attribution of intellectual responsibilities is not necessarily limited by the ability to believe. However, the experiments do not tell us what the intellectual responsibility to believe consists of. This experiment tests whether responsibility attributions are affected by two factors: whether a proposition is supported by none or all of the evidence, and whether the proposition is either objectively false or true. We manipulated evidence and truth-value in the same design in order to detect whether they make independent contributions to responsibility attributions.
4.1 Method
One hundred and sixty-two new participants were tested (aged 18–70 years, mean age = 35 years; 78 female; 98% reporting English as a native language). Participants were randomly assigned to one of four conditions in a 2 (evidence: no, all) × 2 (truth-value: true, false) between-subjects design:
Robert is walking his dog through a nearby park. [None/All] of the evidence indicates that the dog has rabies. [But/And] it does [not] have rabies. In light of Robert's deep emotional attachment to the dog, it is impossible for him to believe that the dog has rabies. As a matter of brain chemistry, it is literally impossible for him to believe that the dog has rabies.
After seeing one of four cases, participants were shown items according to a procedure similar to Experiments 1–2. To ensure prior results are further generalizable, we introduced a new OIC test item with only two response options. Participants were asked to “please choose the option that best applies” from the following two options (order rotated randomly):
1. Robert has an intellectual responsibility to believe the dog has rabies, but he is not able to do so.
2. Robert does not have an intellectual responsibility to believe the dog has rabies, and he is not able to do so.
After answering this item participants were taken to a new screen and presented with the following four items:
It is true that the dog has rabies. (truth)
Robert has good evidence that the dog has rabies. (evidence)
It is possible for Robert to believe that the dog has rabies. (possible)
Robert is blameworthy if he does not believe that the dog has rabies. (blame)
The truth item was answered on a dichotomous “Yes/No” scale. The evidence, possible, and blame items were answered on the same seven-point agreement scale used above.
4.2 Results
A binary logistic regression revealed that both evidence and truth-value significantly predicted responses to the two-option OIC test item. No interaction was detected (see Table 9). The “responsible but unable” response was selected at rates exceeding chance in the true all-evidence condition (76%, binomial test, p = 0.001), but was not significantly selected in the false no-evidence condition (35%, binomial test, p = 0.081), false all-evidence condition (63%, binomial test, p = 0.117), or true no evidence condition (58%, binomial test, p = 0.430, all test proportions = 0.5).
Experiment 3. Logistic regression predicting responses to the OIC test item (2-option). The full model was statistically significant, χ2 (3, N = 162) = 14.64, p <0.01, and explained between 9% and 12% of the variance in response to the test item.

A binary logistic regression revealed that truth-value (Wald = 25.09, p <0.001) significantly predicted responses to the truth item. The model was statistically significant, χ2 (3, N = 162) = 108.19, p < 0.001, and explained between 49% and 65% of the variance in response to the truth item, with 98/90% answering “yes” in the true no-evidence/all-evidence conditions (binomial tests, ps = 0.001, test proportions = 0.5) and 88/73% answering “no” in the false no-evidence/all-evidence conditions (binomial tests, ps = 0.001, test proportions = 0.5). Evidence was not a significant predictor and no interaction was detected.
A multivariate analysis of variance showed that responses to evidence, possible, and blame items were each affected by evidence. The analysis also demonstrated that evidence and blame items were affected by truth-value. There were no interactions (see Table 10).
Experiment 3. Multivariate analysis of variance, Evidence, Wilks' Lambda = 0.537, F(3, 156) = 44.83, p <0.001, ηp2 = 0.463, Truth, Wilks' Lambda = 0.872, F(3, 156) = 7.65, p <0.001, ηp2 = 0.128, E*T, Wilks' Lambda = 0.997, F(3, 156) = 0.133, p = 0.940, ηp2 = 0.003.

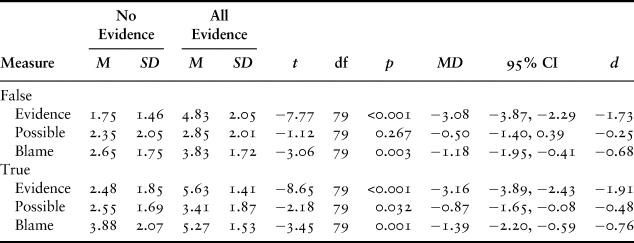
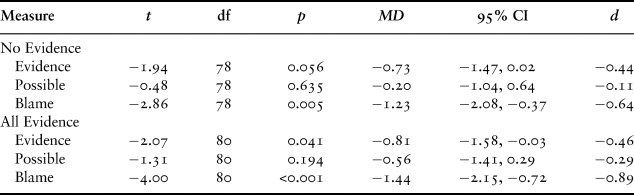
Follow-up independent samples t-tests showed that mean response for evidence, possible, and blame items was significantly lower in the no-evidence condition than the all-evidence condition when the belief was true. Mean response for evidence and blame items was significantly lower in the no-evidence condition than the all-evidence condition when the belief was false (see Table 11).
Experiment 3. Independent samples t-tests by evidence.

Follow-up independent samples t-tests also showed that mean response to the blame item was significantly lower when the belief was false than when it was true in the no-evidence condition, and that mean response to the evidence and blame items was significantly lower when the belief was false than when it was true in the all-evidence condition (see Table 12).
Experiment 3. Independent samples t-tests by truth-value.

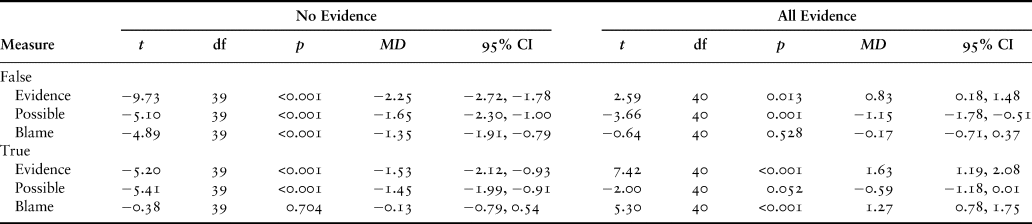
One sample t-tests showed that mean response was significantly below and above the neutral mid-point (=4) for evidence items in no and all evidence conditions, respectively. Tests also showed that mean response to the possible item was significantly below midpoint in both false conditions and the true no-evidence condition, and it was trending in the true all-evidence condition (see Table 13).
Experiment 3. One sample t-tests. Test value = 4.

4.3 Discussion
The results replicate findings from the earlier experiments showing that people attribute intellectual responsibilities, and that they do so even when the agent in question is unable to form the relevant belief. The results also expand upon prior results by identifying two factors, evidence and objective truth, that contribute to the attribution of intellectual responsibilities. The results also replicate prior findings concerning the link between objective truth and the evaluation of evidence (Turri Reference Turri2015, Reference Turri2016). In the present study, participants evaluated an agent's evidence as stronger when it supported a claim that was objectively true rather than false.
5. Experiment 4
This experiment tests whether intellectual obligations are affected by whether the consequences of not believing a proposition are severe.
5.1 Method
One hundred and eighty-five new participants were tested (aged 20–74 years, mean age = 36 years; 78 female; 94% reporting English as a native language). Participants were randomly assigned to one of four conditions in a 2 (stakes: low, high) × 2 (epistemic status: bad, good) between-subjects design. The stakes factor manipulated the consequences of failing to form a belief. In the low stakes case, the belief involved diagnosing a pet for dandruff, while the high stakes case involved diagnosing a pet for rabies. The epistemic status factor combined the elements observed to affect responsibility attributions in Experiment 3: the bad epistemic status involved a false proposition supported by no evidence, whereas a good epistemic status involved a true proposition supported by all the evidence. These manipulations are shown in the brackets below:
Robert is walking his dog through a nearby park. [None/All] of the evidence indicates that the dog has [dandruff/rabies]. And it does [not] have [dandruff/rabies]. In light of Robert's deep emotional attachment to the dog, it is impossible for him to believe that the dog has [dandruff/rabies]. As a matter of brain chemistry, it is literally impossible for him to believe that the dog has [dandruff/rabies].
After seeing one of these four cases, participants were presented with the two-option OIC test item used in Experiment 3 asking participants to “please choose the option that best applies” from two options (order rotated randomly):
1. Robert has an intellectual responsibility to believe the dog has [dandruff/rabies], but he is not able to do so.
2. Robert does not have an intellectual responsibility to believe the dog has [dandruff/rabies], and he is not able to do so.
According to the same procedure above, participants were then taken to a new screen and presented with the following agreement items:
It is possible for Robert to believe that the dog has [dandruff/rabies]. (possible)
If Robert does not believe that the dog has [dandruff/rabies], there could be serious consequences. (consequences)
Robert is blameworthy if he does not believe that the dog has [dandruff/rabies]. (blame)
Responses were collected on the same seven point scales used in prior experiments.
5.2 Results
A binary logistic regression revealed that the two-option OIC test item was predicted by epistemic status. It was not predicted by stakes and no interaction was detected (see Table 14). To explore this effect further, results were collapsed across stakes and a chi-squared test was used. Collapsing across stakes, epistemic status significantly affected responses to the OIC test item, χ2 (1, N = 185) = 40.97, p < 0.001, Cramer's V = 0.47. The “responsible but unable” response was selected at rates exceeding chance in the good epistemic condition (72%: binomial test, p < 0.001, test proportion = 0.50). The “not responsible and unable” response was selected at rates exceeding chance in the bad epistemic condition (75%: binomial test, p < 0.001, test proportion = 0.50).
Experiment 4. Logistic regression predicting responses to the OIC test item (2-option). The full model was statistically significant, χ2 (3, N = 185) = 50.63, p < 0.001, and explained between 24% and 32% variance in response to the test question.

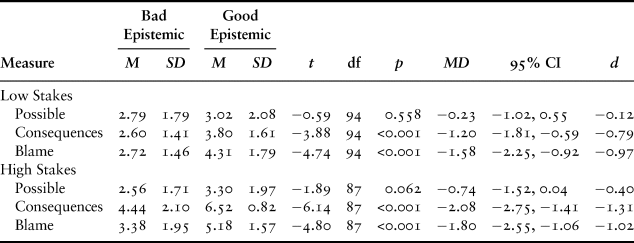
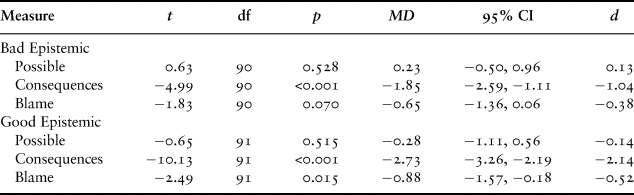
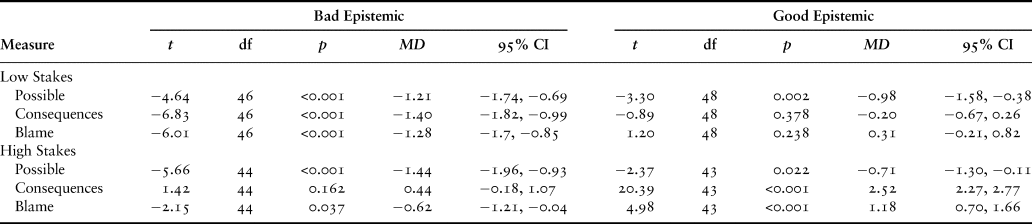
A multivariate analysis of variance showed that responses to the consequences and blame items were each affected by stakes and epistemic status. There were no interactions (see Table 15). Follow-up independent samples t-tests showed that mean response for consequences and blame items was significantly lower in the bad epistemic status condition than the good, but that possibility was not affected by status (see Table 16). Follow-up independent samples t-tests showed that mean response for consequences and blame items was significantly lower in the low stakes condition than the high, but that possibility was not affected by stakes (see Table 17). One sample t-tests showed that mean response was significantly below the neutral mid-point (=4) for all possible items (see Table 18).
Experiment 4. Multivariate analysis of variance, Stakes, Wilks' Lambda = 0.640, F(3, 179) = 33.62, p <0.001, ηp2 = 0.360, Epistemic, Wilks' Lambda = 0.721, F(3, 179) = 23.13, p <0.001, ηp2 = 0.279, S*E, Wilks' Lambda = 0.976, F(3, 179) = 1.47, p = 0.225, ηp2 = 0.024.

Experiment 4. Evidence independent samples t-tests by epistemic status.

Experiment 4. Independent samples t-tests by stakes.

Experiment 4. One sample t-tests. Test value = 4.

5.3 Discussion
This experiment replicates the finding that intellectual responsibilities to believe propositions are attributed even to agents unable to fulfill them. Responsibility attribution was significantly predicted by epistemic status – namely, having good evidence for a true proposition, compared to having no evidence for a false proposition. Responsibility attribution was not significantly predicted by stakes, or how costly it would be to fail to form the belief.
6. General Discussion
The results of four experiments support the existence of intellectual responsibilities in social cognition. First, people clearly attribute intellectual responsibilities to believe propositions. This finding was replicated using three different probing methods, including one scalar measure (Experiment 2) and two different categorical measures (Experiment 1, 3–4). The experiments also revealed two factors contributing to the attribution of intellectual responsibilities: the evidence favoring a proposition, and the proposition's objective truth-value (Experiment 3–4). Finally, the experiments demonstrate that the attribution of these responsibilities is quite strong, sometimes persisting even when the agent in question is unable to form the relevant belief (Experiments 1–4).
The findings also have theoretical significance. In addition to advancing our understanding of how intellectual responsibilities are attributed, these results also cast further doubt on the alleged commitment to “ought implies can” principles in ordinary social cognition. Prior results have demonstrated that ordinary moral judgments violate this principle. The present results extend this finding from the moral to the intellectual domain, undermining the claim that ordinary social cognition implicitly accepts an “ought implies can” for intellectual responsibilities (e.g. Boghossian Reference Boghossian2006: 23). Of course, these findings do not demonstrate that intellectual obligations are never influenced by considerations about what one is able to do. By changing the materials or stimuli, future researchers might profitably explore cases in which inability does intuitively preclude responsibility. The present results demonstrate one set of circumstances in which inability does not do this, which falsifies a general conceptual entailment between ability and responsibility in the intellectual domain.
The results also offer a reason for optimism concerning our political dialog and folk-epistemological assessments of belief. To the extent that people attribute responsibility in these cases, the results suggest that they do not endorse post-truth relativism about objective truth. Instead, people recognize that failing to form beliefs on the basis of true evidence violates an intellectual responsibility of belief. Such responsibilities are so strong, in fact, that they sometimes extend beyond our ability to fulfill them. In the present set of experiments, it appears that both objective truth-value and the possession of evidence both affected responses, and that when combined they were enough to trigger intellectual responsibility attribution. However, further research might profitably explore whether these factors ever trigger intellectual responsibility attributions in isolation, such as a responsibility to believe objectively true propositions without evidence.
Future research could improve our understanding of intellectual responsibility by expanding on the present results in several ways. For one, the scenarios tested responsibility attributions in situations where it was stipulated that claims were true and were clearly supported by good evidence. For another, these situations involved nonpartisan beliefs that were unassociated with any particular political cause or social group. These features of the materials have the benefit of isolating and identifying the effect of evidence and truth in general intellectual evaluations. However, it is often unclear whether claims are true or well supported and this may be compounded by contentious political content. Further research is needed to test the role of truth or evidence judgments on intellectual responsibility attributions in these more specific circumstances.Footnote 1