NOMENCLATURE
- ACARE
-
Advisory Council for Aviation Research and Innovation in Europe
- BPR
-
Bypass Ratio
- EINOx
-
NOx Emission Index [g/kg]
- GITB
-
Geared Inter-stage Turbine Burner
- GSP
-
Gas turbine Simulation Program
- GTF
-
Geared Turbofan
- HPC
-
High-Pressure Compressor
- HPT
-
High-Pressure Turbine
- ICAO
-
International Civil Aviation Organization
- ISA
-
International Standard Atmosphere
- ITB
-
Inter-stage Turbine Burner
- LPC
-
Low-Pressure Compressor
- LPT
-
Low-Pressure Turbine
- LTO
-
Landing Take-Off
- OPR
-
Overall Pressure Ratio
- SLS
-
Sea Level Static
- ST
-
Specific Thrust [N·s/kg]
- TSFC
-
Thrust Specific Fuel Consumption [g/kN/s]
- VHBR
-
Very High Bypass Ratio
- UHBR
-
Ultra High Bypass Ratio
-
 ${\dot{m}_{}}$
-
mass flow rate [kg/s]
- η
-
efficiency
- π
-
pressure ratio
- Δ
-
Variation with respect to baseline
Abbreviation
Symbol

1.0 BACKGROUND AND MOTIVATION
Propulsion technologies have been at the forefront of aeronautics. The large reduction in the fuel consumption of a modern aircraft when compared to the early jet-powered aircraft, is mainly due to the reduction in fuel consumption of engines(1). Even though the efficiency of aircraft and engine have increased substantially over the years (approximately 1.3% every year in terms of fuel burn per passenger km), it has been outpaced by the growth in aviation (approximately 4.8% per year). It has now been established that emissions from civil aviation can no longer be neglected because of the increase in air traffic and due to the fact that the aircraft emission occurs within the sensitive layers of the atmosphere, near the tropopause( Reference Lee, Fahey, Forster, Newton, Wit, Lim, Owen and Sausen 2 , Reference Penner, Lister, Griggs, Dokken and Macfraland 3 ). With global warming becoming one of the main challenges faced by humanity, there is an increased impetus to reduce emissions from aero engines. The Advisory Council for Aviation Research and Innovation in Europe (ACARE) has set ambitious goals for 2050 to reduce CO2 emission by 75%, NOx emissions by 90%, and the perceived noise by 65% with respect to a baseline aircraft in service in the year 2000(4).
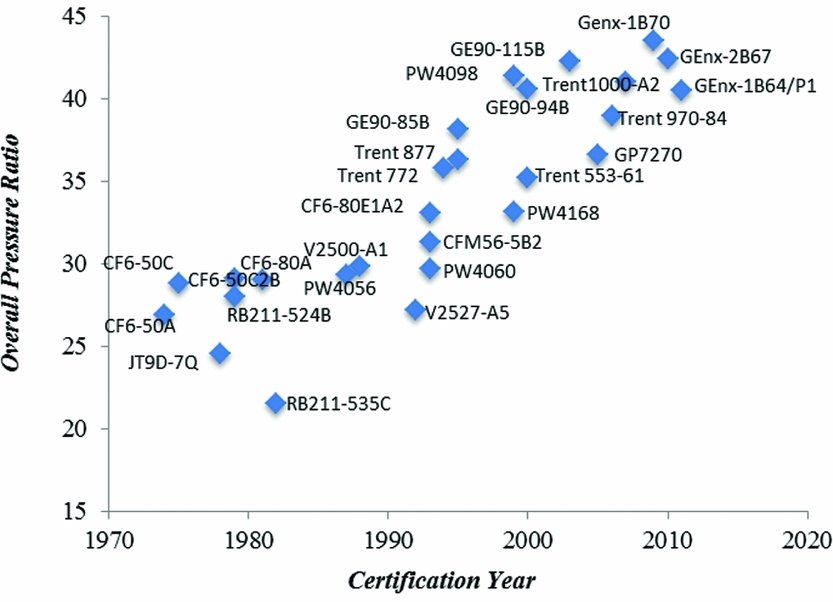
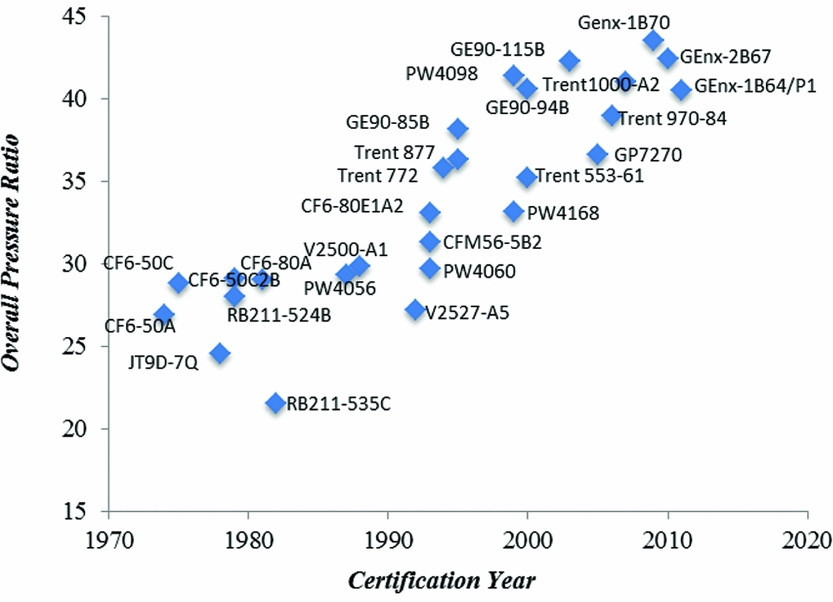
The CO2 emission is directly associated with the consumption of fossil fuels. Therefore, reducing the fuel consumption helps to reduce CO2. Historically, the reduction in fuel consumption has been realised by an increase in the thermal efficiency (increasing the Overall Pressure Ratio (OPR), Turbine Inlet Temperature (TIT), and component efficiencies) and the propulsive efficiency (by lower Fan Pressure Ratio (FPR) and higher Bypass Ratio (BPR)). The OPR has more than doubled in the past 4 decades, as summarised in Fig. 1. The latest turbofans have reached an OPR of more than 50. Following this development trend, it is very likely that the next generation of Very High Bypass Ratio (VHBR)/Ultra High Bypass Ratio (UHBR) engines would reach an Overall Pressure Ratio (OPR) close to 70.
Engine overall pressure ratio increment. (Data Source: the engine certification data sheet of International Civil Aviation Organization (ICAO)).
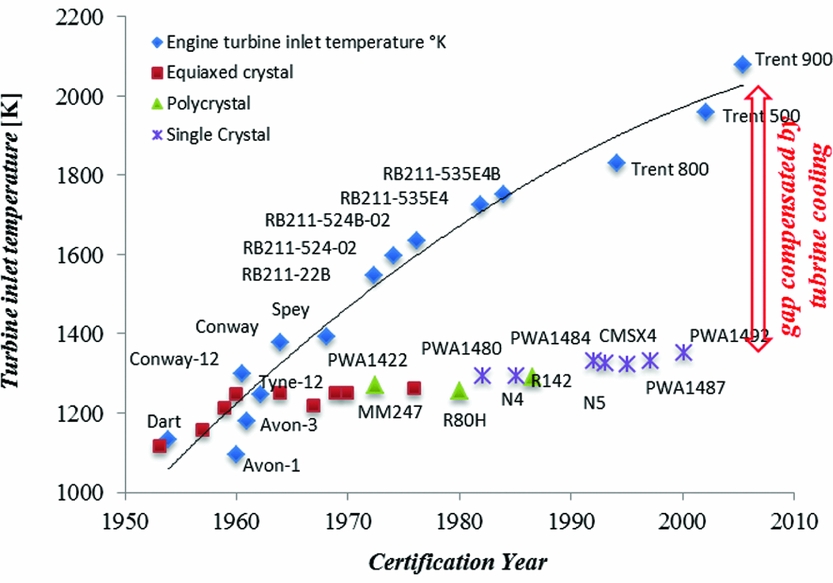
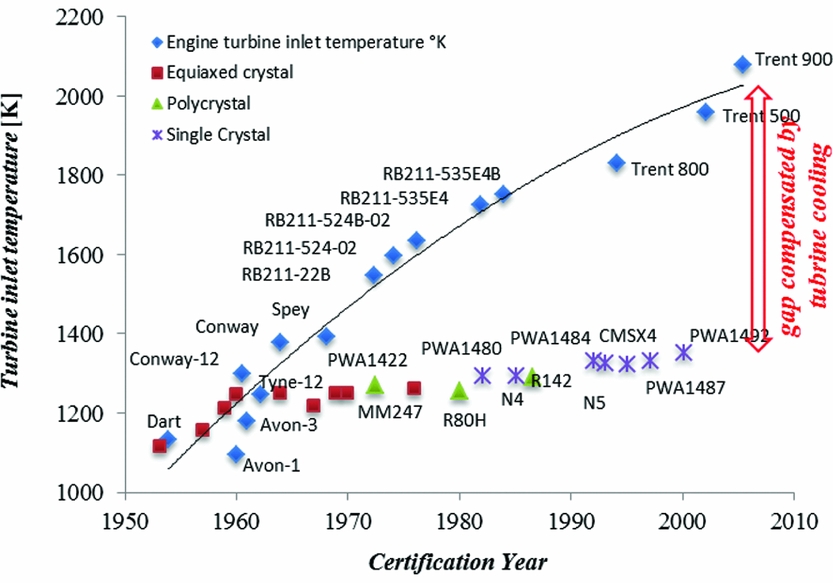
As a result of high OPR, the TIT has to be increased as well to realise an optimum Brayton cycle(Reference Saravanamuttoo, Rogers, Cohen and Straznicky5). Figure 2 shows the historical trend in TIT and the development of maximum allowable metal operating temperature. The average increase in TIT has been around 19 K/year, which is substantially higher than the increase in operating metal temperature of around 5 K/year. This discrepancy is compensated by the sophisticated cooling techniques. When the TIT exceeds the allowable metal operating temperature significantly, a large amount of bleed air is required to cool the turbine stage. The bleed air used for turbine cooling bypasses the combustor and does not completely participate in the main cycle, thereby imposing penalties on the cycle performance. Horlock, et al(Reference Horlock, Watson and Jones6) and Wilcock, et al(Reference Wilcock, Young and Horlock7) have modelled the gas turbine performance incorporating the effect of bleed air and have demonstrated the performance penalties due to turbine cooling and higher compressor work required for pressurising the bleed air.
Evolution of turbine inlet temperature and metal operating temperature over the years. (Figure reproduced by data from Rolls Royce jet engine.)
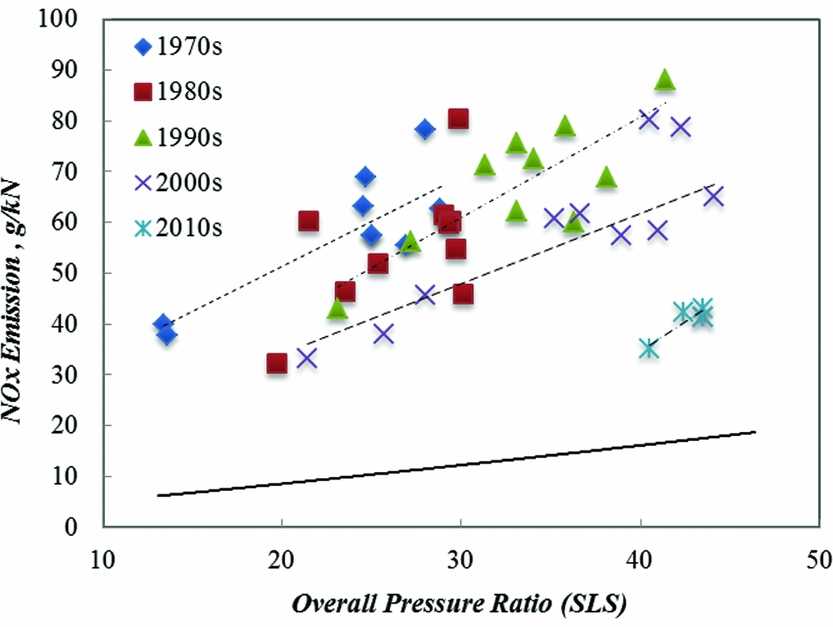
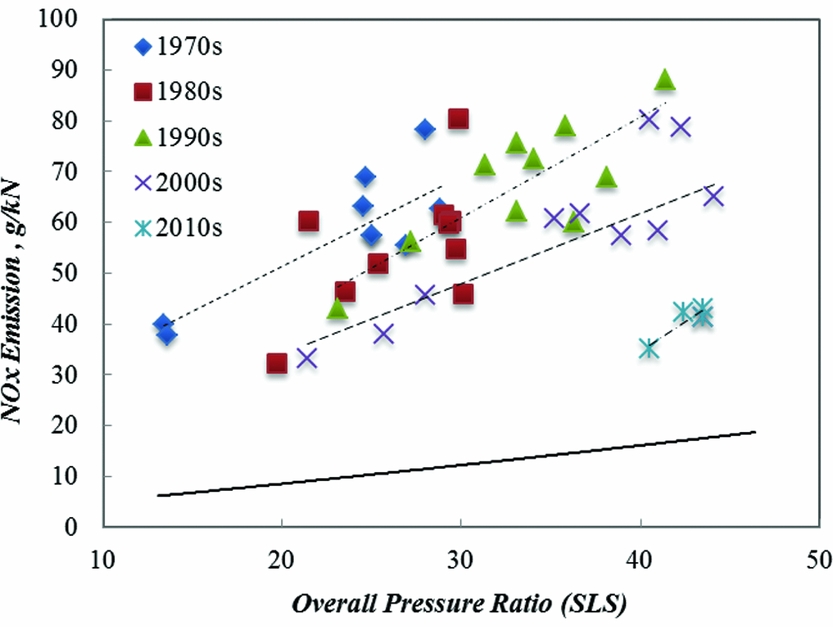
Moreover, increasing OPR and TIT increases NOx emissions for a given combustor technology(Reference Lefebvre and Ballal8). In Fig. 3, the historical trend in Landing Take-Off (LTO) cycle NOx emissions based on ICAO engine certification databank is illustrated(9). For a given period, when the combustion technology remained unchanged, the NOx emission increased with increase in OPR. The reduction in NOx emission due to the advancement in the combustion technology can be seen in the figure. It is also evident from the figure that even with advanced combustion technology, it is difficult to satisfy the ACARE objectives (depicted by the solid line at the bottom of the figure). Therefore, breakthrough technologies in engine architecture and combustion technology should be explored.
The LTO NOx emissions index versus OPR at SLS. (Figure produced using the engine type certification data sheet of ICAO).
The Geared Turbofan Engine (GTF)(Reference Riegler and Bichlmaier10) has been a significant step in aircraft engine architecture and offers significant advantages in terms of increasing the engine propulsive efficiency without deteriorating the thermal efficiency. In the coming years, the GTF architecture would be scaled up for the wide-body aircraft. However, the conflicts between reduction in CO2 emission (due to the increase in OPR and TIT) and the increase in the NOx emission cannot be eliminated. The current turbofan engine architectures (conventional as well as the GTF) do not provide any significant advantages in terms of reducing the impact of high OPR and TIT on the NOx emission. This criterion would play an important role in determining the course of evolution in future aero engine architecture. This paper provides an improvement in the GTF engine architecture such that CO2 emission reduction due to high OPR and TIT can be obtained without increasing the NOx emission.
The inter-cooled engine is another concept that is being actively investigated by researchers(Reference Kyprianidis, Gronstedt, Ogaji, Pilidis and Singh11–Reference Kyprianidis and Rolt13) as an option to further increase engine OPR. Using inter-cooling reduces the air temperature at the inlet of HPC, thereby reducing the combustor inlet temperature for given OPR. The reduction in combustor inlet temperature is beneficial in reducing the NOx emissions. On the other hand, a lower combustor inlet temperature increases the fuel required to achieve a given TIT, which is not favourable for the thermal efficiency of the cycle unless the TIT is reduced. For lower TIT, the cycle Specific Thrust (ST) is reduced, increasing the overall size and installation penalty of the engine, not to mention that incorporating a heat exchanger in the core is extremely challenging and will result in a substantially increase in the overall engine weight. The heat exchanger will also result in pressure losses, both on the core side as well as the bypass side.
2.0 PROBLEM IDENTIFICATION
The main problem of increasing OPR and TIT in a turbofan can be summarised as:
-
• Increased complexity and use of super-alloys in the High-Pressure Compressor (HPC)
-
• Increased weight of the engine due to the increased number of the HPC stages and the use of super-alloys for compressor blades
-
• The increase in TIT would increase the requirement of cooling air to limit the blade material temperature within its operating range
-
• The increase in OPR would increase the temperature of the bleed air used for turbine cooling, thereby increasing the bleed mass flow required for cooling the turbine blades even further
-
• High OPR and TIT result in increased NOx emission
-
• The increase in TIT results in an increase in gas dissociation effect and the associated loss in the cycle thermal efficiency.
Despite all the challenges, it is still worthwhile to increase the OPR and TIT because of the fuel burn reduction that can be obtained. An engine architecture, which would be able to negate some of the disadvantages mentioned above, would be desirable. The advanced GTF engine with an Inter-stage Turbine Burner (ITB), described in this paper, is one such architecture.
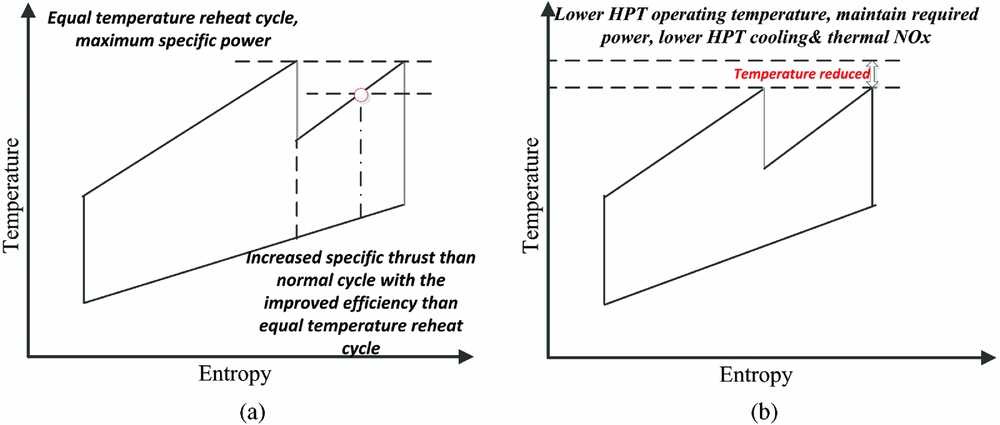
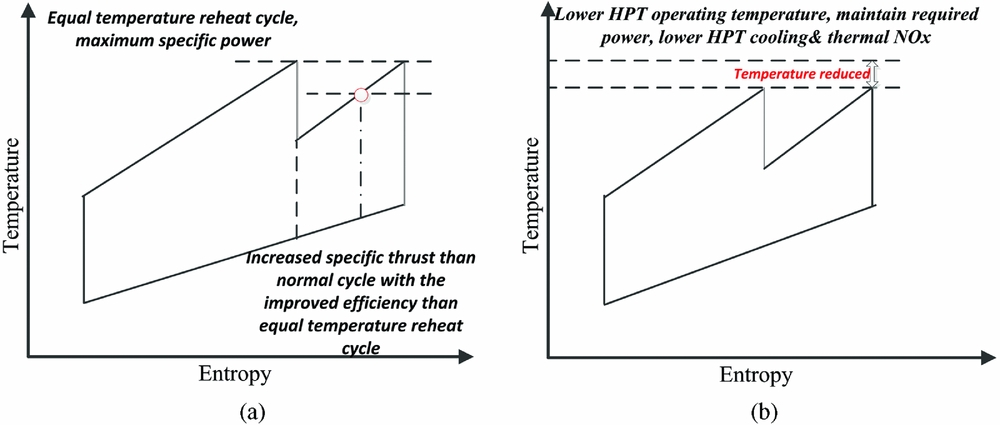
The ITB is an additional combustor located in between the High-Pressure Turbine (HPT) and Low-Pressure Turbine (LPT), replacing the inter-turbine duct in a gas turbine engine. This dual combustor configuration provides different possibilities to design an ITB engine, amongst which two are illustrated in Fig. 4. In Fig. 4(a), the inlet temperatures of HPT and LPT are kept identical at the maximum allowable temperature (indicated by the upper dashed line). As a result, the specific power output increases significantly but at the expense of increased fuel consumption. This architecture is interesting for military engines where the ST is a key parameter driving the engine design. If one attempts to design a civil aero-engine using such architecture, the temperature increase through ITB should be reduced, as demonstrated by the lower dashed line in Fig. 4(a). This way a compromised configuration, having higher ST and less penalty in the fuel consumption, is realised. Alternatively, if the ST should be kept constant, then adding an ITB helps to reduce the HPT inlet temperature, as illustrated in Fig. 4(b). Accordingly, the HPT cooling requirement and associated loss are reduced. Moreover, the NOx emission decreases due to lower heat addition and lower TIT.
T-S diagram of a reheat cycle for different purposes. (a) Higher specific power output cycle. (b) Lower turbine cooling and NOx cycle.
Research on ITB in aero-engines is not new. In Refs Reference Sirignano and Liu14–Reference Lee, Singh and Probert19, the application of ITB in turbojet or the low BPR turbofan engines for military aircraft has been studied. Conventionally, a fighter aircraft utilises an afterburner to improve the ST. However, the thermal efficiency of the afterburner is low because heat is being added in the afterburner at low pressure in the thermodynamic cycle, which is detrimental to the thermal efficiency. An ITB engine is thermodynamically more efficient than an engine with an afterburner because the location of ITB is before LPT, where the operating pressure is relatively high. In Refs Reference Sirignano and Liu14 and Reference Liu and Sirignano15, the ITB has been applied in a conventional turbojet and low bypass turbofan, respectively. The results show that ITB engine has lower Thrust Specific Fuel Consumption (TSFC) than an engine equipped with an afterburner, while maintaining a higher ST than a normal engine without afterburner. In Ref. Reference Grönstedt and Avellań20, a mission analysis has been performed on a turbofan engine with ITB applied for a long-range mission. This study shows a slight benefit in mission fuel burn by the ITB engine over a conventional engine with a 180 K lower turbine inlet temperature realised in the ITB engine. This reduction in TIT implies a potential reduction in NOx emission.
Since the ITB is followed by LPT, the LPT inlet temperature is increased due to the presence of ITB, which depending on the temperature can increase the LPT cooling requirement and may penalise the thermal efficiency. Therefore, it is essential to investigate the cooling requirement of both HPT and LPT in an ITB engine. Liew et al(Reference Liew, Urip and Yang21) have included correlation curves for turbine cooling prediction given by Walsh and Fletcher(Reference Walsh and Flectcher22). In their analysis, the ITB exit temperature was below the maximum allowable metal temperature to avoid the LPT cooling.
The aim of this paper is to quantify the effects of an ITB on the NOx emission and on the cooling requirements of HPT and LPT, and to evaluate the performance of a next-generation geared VHBR turbofan engine with ITB. A sophisticated in-house turbine cooling model has been integrated.
3.0 ENGINE CONFIGURATIONS
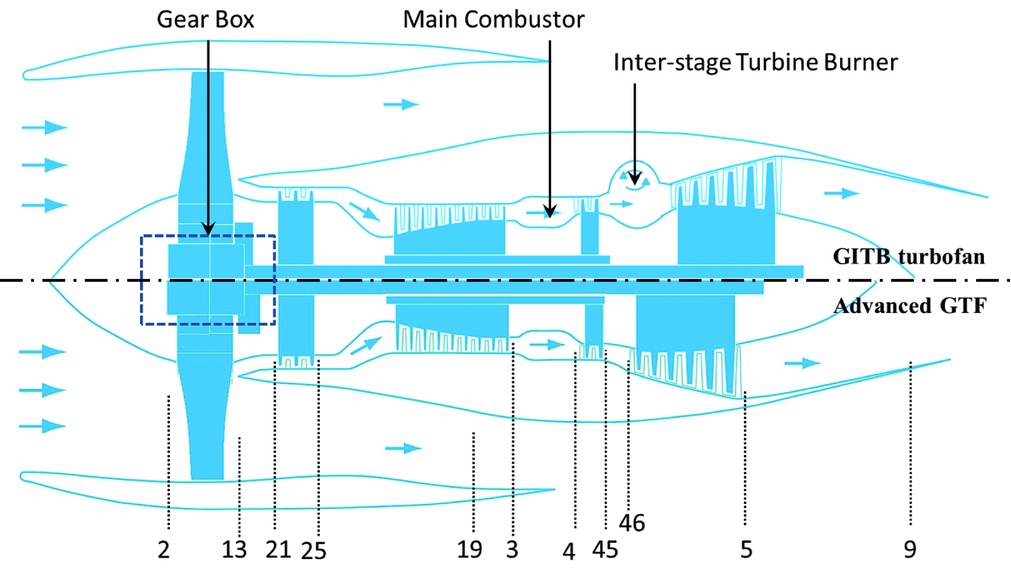
Following civil aero engine development trend, a VHBR turbofan engine with a geared system representing the state-of-art technology in the years 2025–2030 is used as a baseline engine in the current study. Accordingly, a contemporary ITB engine configuration (named as advanced Geared Inter-stage Turbine Burner (GITB) turbofan engine) is derived. The conceptual comparison of these two engine layouts is presented in Fig. 5. The upper part of the figure is the GITB turbofan engine, whereas the bottom part is the advanced GTF baseline engine. The installation effects of introducing ITB in an engine is not dealt with in the current paper; however, it can be expected that the engine length increases due the incorporation of ITB. The work in Ref. Reference Grönstedt and Avellań20 shows that incorporating ITB could reduce the fan diameter. Thus, the installation effects of ITB should not be significantly different than a similar turbofan engine. Moreover, it can be observed that the shape of the ITB differs from that of the main combustor to enable the flow recirculation and to increase the residence time.
Engine configuration comparison.
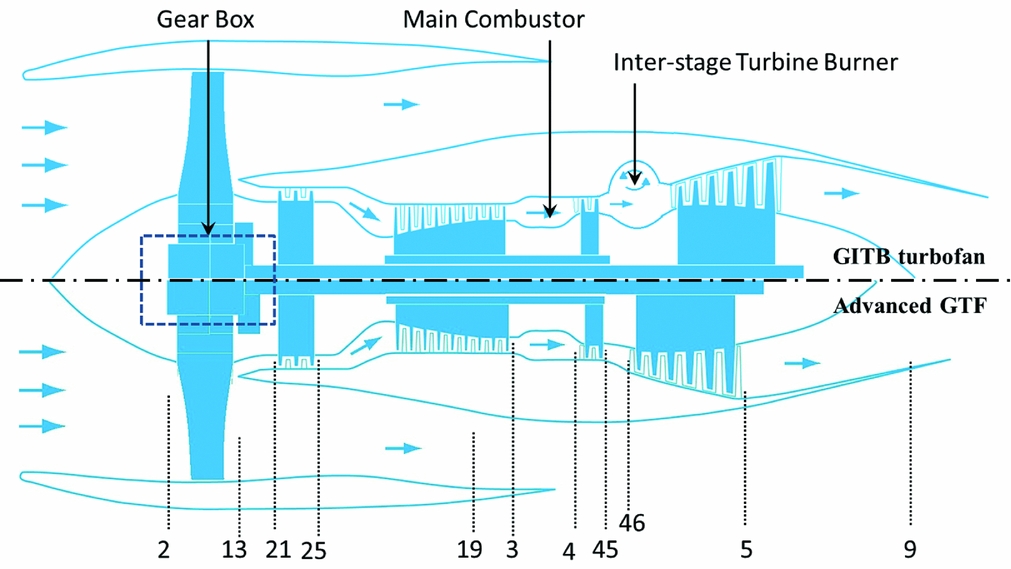
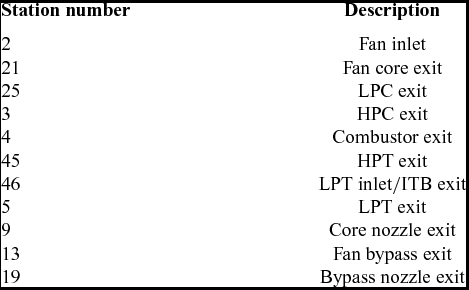
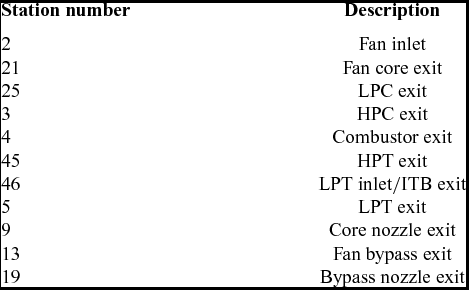
The station number is defined in Table 1 and is valid in the whole paper if not mentioned otherwise. The LPT inlet or ITB exit is defined as station 46. Since the ITB is positioned downstream of the HPT where the flow velocity is higher, the energy input into the ITB has been kept intentionally lower than that of the main burner to minimise the pressure loss through the ITB and to reduce the losses in thermal efficiency.
Engine station number definition
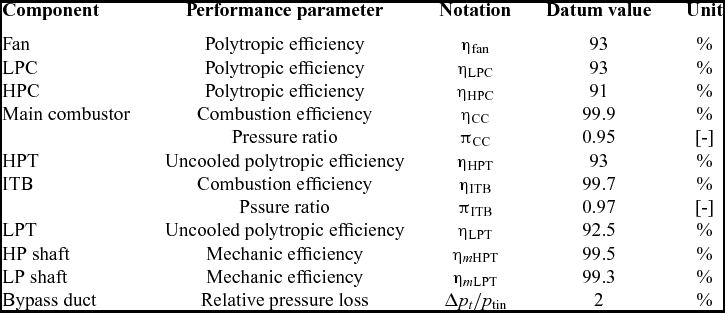
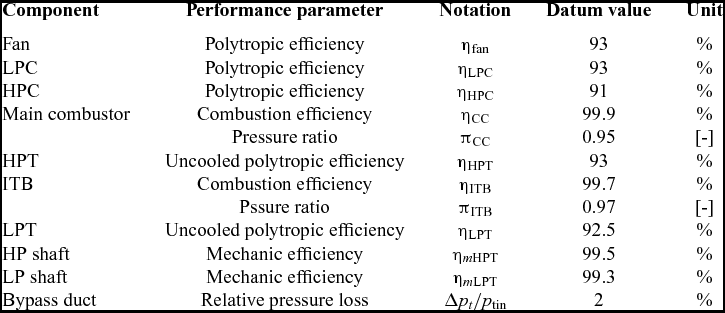
The baseline component efficiencies for both types of engines are defined in Table 2. Since the amount of fuel injected into ITB is lower than the main combustor, the pressure loss in ITB is expected to be lower. The turbine efficiency mentioned in Table 2 is the un-cooled efficiency. The loss due to cooling has been taken into account as explained in the later part of this paper.
Baseline component performance parameters
4.0 MODELLING APPROACH
The complete model framework used in the current analysis comprises of two sub models: (1) an engine performance model with a detailed turbine cooling model and (2) an in-house emission prediction model.
4.1 The engine performance model
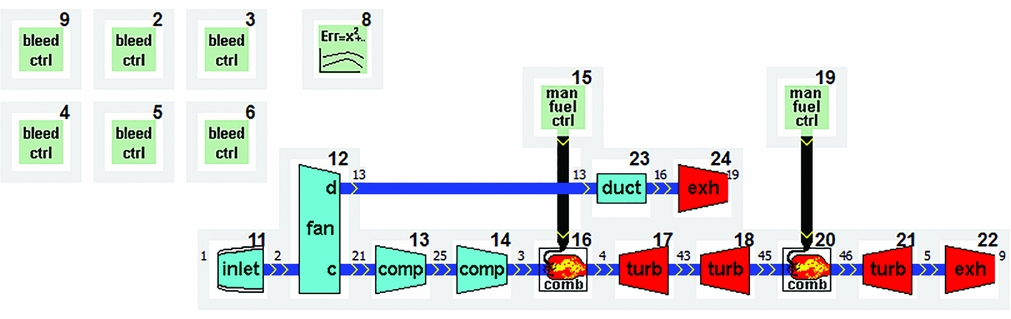
To estimate the engine performance, a zero-D thermodynamic model is created using the Gas Turbine Simulation Program (GSP)(Reference Visser and Broomhead23). In accordance with the engine configuration, the layout of this engine model for the GITB turbofan engine is depicted in Fig. 6. The main gas path of the engine consists of inlet, fan, Low-Pressure Compressor (LPC), HPC, main combustor, HPT, ITB, LPT, core convergent nozzle, bypass duct, and bypass convergent nozzle. The bleed control components numbered from 2 to 6 and 9 are applied to specify the turbine cooling air requirement either in the form of the absolute air mass flow rate or a fraction of the inlet mass flow rate to the HPC (
 ${\dot{m}_c}/{\dot{m}_{25}}$
). In the current research, the latter one is used. The model has a thrust controller (shown by component 8), which maintains the thrust of the engine to the specified value. The performance calculation procedure is the same as presented in Ref. Reference Saravanamuttoo, Rogers, Cohen and Straznicky5. Moreover, as far as the second combustion chamber is concerned, the gas composition at the inlet of ITB is significantly different than that of a conventional burner since part of the oxygen has been consumed by the first combustor. The gas model in GSP is used to calculate the composition of the vitiated air. The engine off-design performance is derived from the design condition with the generic component maps included. To predict the turbine cooling air requirement, an in-house turbine cooling model has been employed. Detailed information regarding this cooling model will be given in the following subsections.
Layout of a turbofan with ITB.

4.2 The turbine cooling model
In the preliminary engine design phase, it is a common practice to apply empirical correlations to predict turbine cooling air mass flow rate(Reference Walsh and Flectcher22). Most of the correlations behave linearly and provide reasonable prediction within a narrow temperature range. But as the engine OPR and TIT increase, the cooling requirements behave in a non-linear manner and cannot be predicted correctly by these linear models, resulting in significant performance deviation. Therefore, it is essential to have an accurate turbine cooling model, which is capable of capturing the non-linear characteristics of cooling air fraction, in predicting the amount of cooling air required for maintaining the metal temperature within the operating regime.
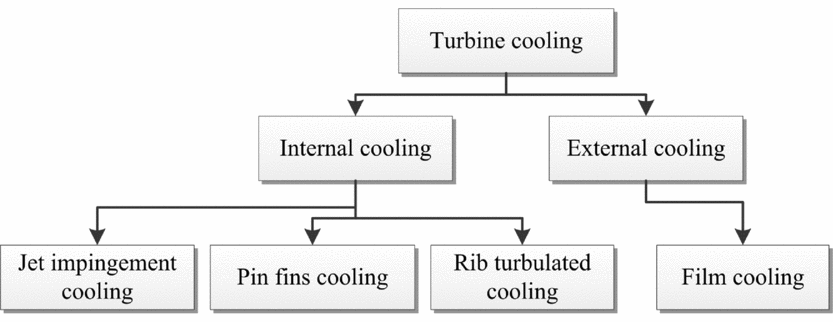
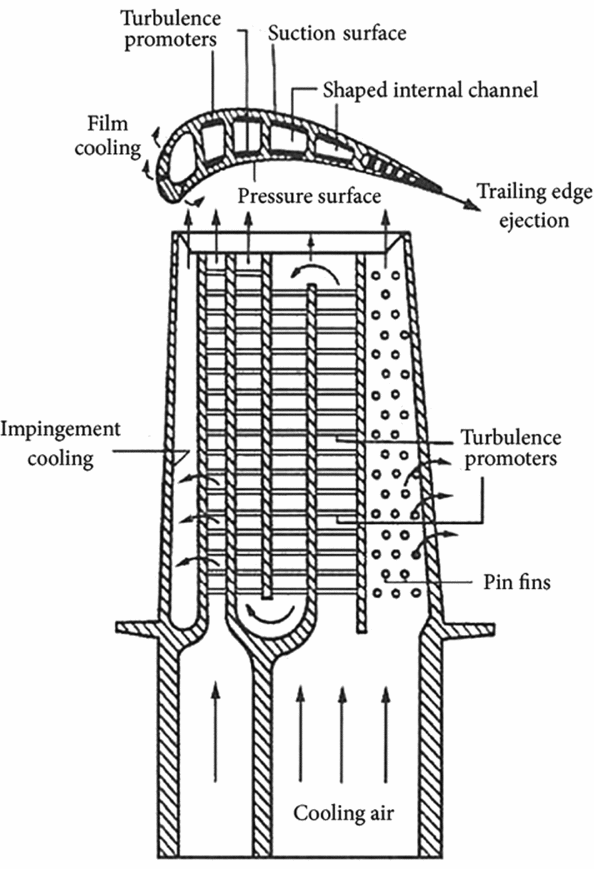
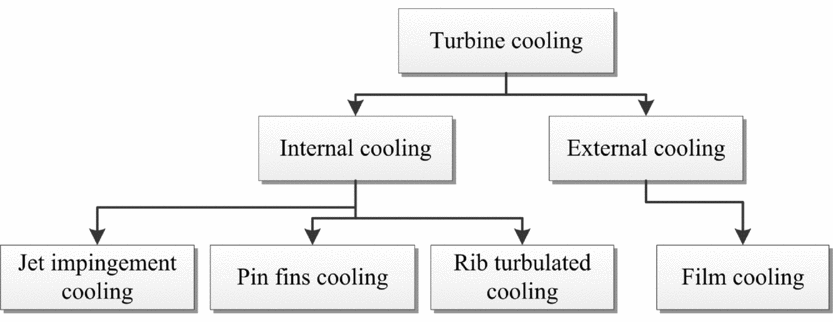
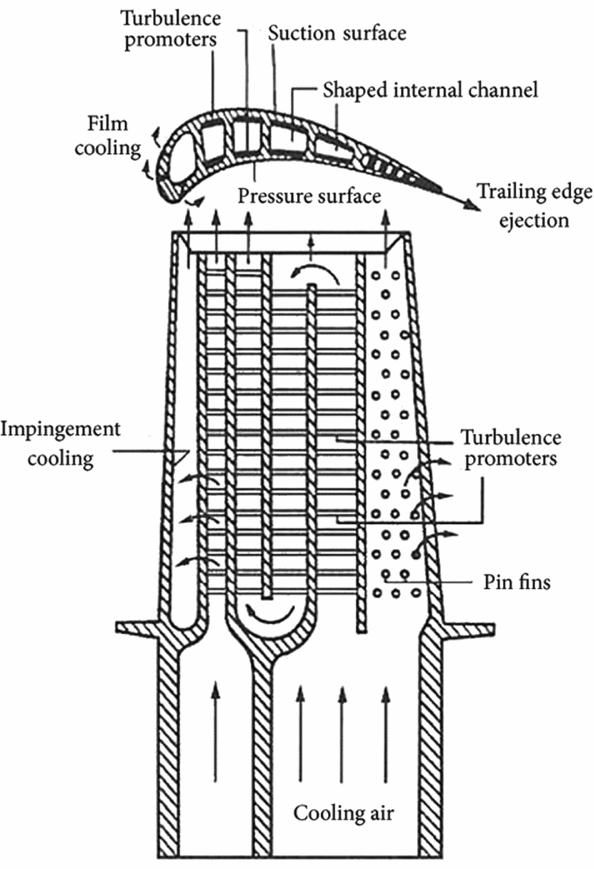
An in-house turbine cooling model is built which takes into account both internal and external cooling techniques used in an actual turbine vane and blade. The overall turbine cooling model scheme is shown in Fig. 7. The internal cooling scheme consists of rib turbulated channel cooling, jet impingement cooling and pin fin cooling, while the external heat transfer consists of film cooling. The arrangement of these cooling modules follows a typical profile used in modern air-cooled turbine blade as presented in Fig. 8.
Turbine cooling scheme.
Design concept of a modern cooled gas turbine blade(Reference Han, Dutta and Ekkad24).
The cooling model calculates the mass flow rate of cooling air required for a single turbine vane or blade. By multiplying it by the total number of blades and vanes, the total mass flow rate of cooling air required for a turbine stage can be evaluated. The cooling air mass flow rate is dictated by several parameters, including the maximum allowable metal operating temperature, the bleed air pressure, the bleed air temperature, the turbine operating temperature and pressure. The iterations are executed until the heat flux between the cooling air and the hot gas reaches an equilibrium condition. This cooling model has been validated with the NASA Energy Efficient Engine (E3) engine cooling system, as described in Refs Reference Halila, Lenahan and Thomas25 and Reference Stearns26. Detailed information with respect to the turbine geometry and the turbine cooling model can be found in Ref. Reference Tiemstra27. In the current research, the maximum allowable metal operating temperature is assumed as 1,450 K, which matches with materials available in 2025.
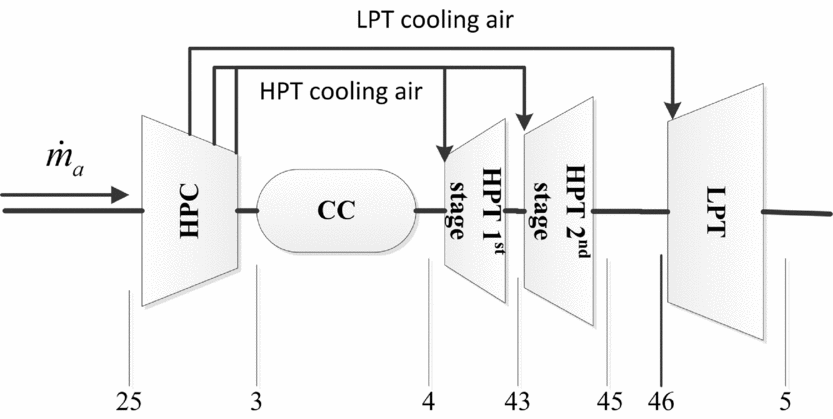
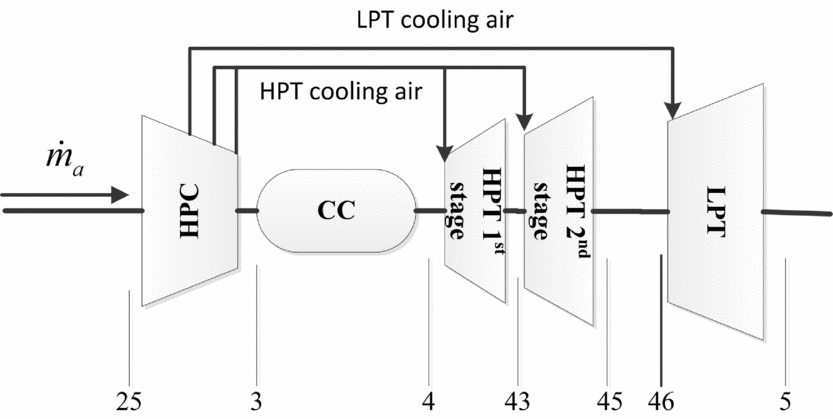
The cooling arrangement in the GITB turbofan engine can be seen in Fig. 9. The cooling flow for the first-stage HPT and the second-stage HPT is considered separately. For LPT cooling, it is assumed that only the first stage of LPT requires cooling (as the temperature of the gas drops below the metal operating temperature in the later stages); therefore, the LPT is not split into various stages. The cooling air is bled from different stages of the HPC depending on the operating pressure of the turbine stage. The same cooling arrangement is considered for the advanced GTF engine.
Layout of the cooling airflow in the GITB turbofan engine.
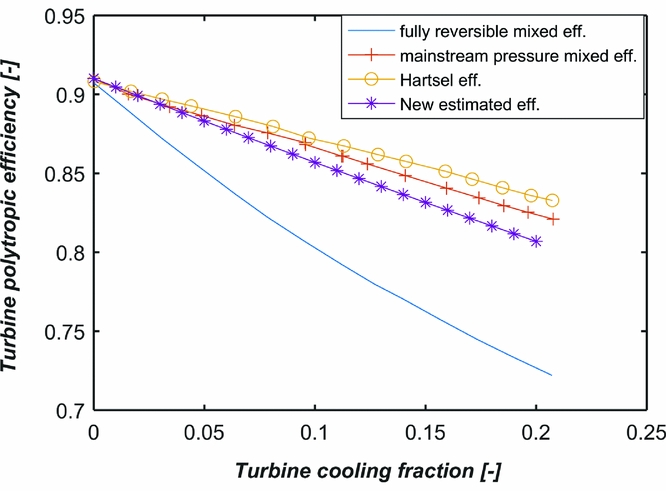
Turbine cooling has a significant effect on the turbine efficiency. Research has been conducted to investigate the effect of cooling on the overall efficiency of a turbine stage. Hartsel(Reference Hartsel28) has demonstrated two analytical models to estimate the efficiency of a cooled turbine (Harsel eff.). Kurzke(Reference Kurzke29) redefined the turbine efficiency (mainstream pressure mixed eff.) considering different bookkeeping approaches for single-stage and multi-stage turbines. As for the loss due to mixing and the aerodynamic loss, the prediction is not straightforward. First, the cooling flow coming out of a turbine blade tends to affect the aerodynamic profile, which influences the turbine efficiency; moreover, when the two flow streams at different temperatures mix, the total entropy increases, resulting in additional losses. Young and Horlock(Reference Young and Horlock30) have attempted to provide distinguished definitions from this perspective (fully reversible mixed eff.).
By considering various methodologies discussed in the literature and considering the expected technology improvement in future, a compromised effect of turbine cooling based on the following assumptions has been considered in this paper (indicated by New estimated eff.).
-
• The cooling flow of the nozzle guide vanes at any turbine stage completely mixes with the mainstream before the expansion through the blade.
-
• 50% of the cooling air for the first-stage HPT rotor participates in the work output of the turbine.
-
• The second-stage HPT rotor cooling air mixes with the mainstream after the expansion and, therefore, does not contribute to the turbine power output.
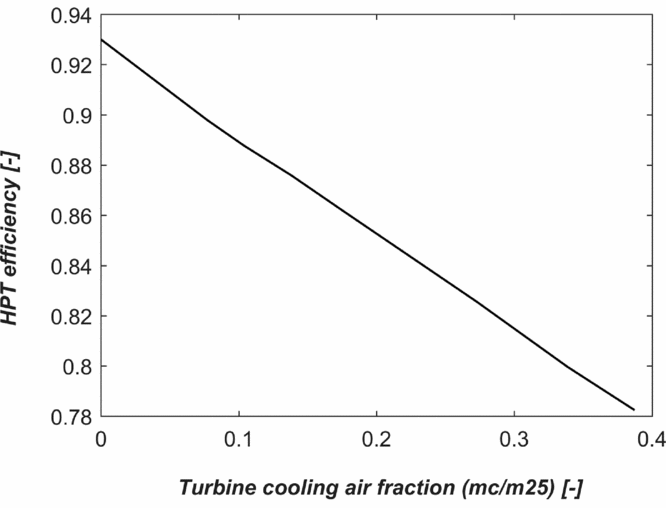
As a result of above considerations, an estimation has been made in this paper. Accordingly, every unit percentage of the turbine cooling increase will cause roughly 0.6% reduction in the turbine polytropic efficiency (as indicated by New estimated eff. in Fig. 10). This will be applied in the current paper to calculate the cooled turbine efficiency.
Various methodologies to account for the effect of turbine cooling (figure reproduced using data provided in Ref. Reference Horlock and Torbidoni31).

4.3 The NOx emission prediction model
It is known that the thermal NO dominates the NOx emission in aero-engines. As the name suggests, the thermal NO production increases exponentially when the temperature within the combustor exceeds 1,800 K. Several parameters, including, local equivalence ratio, residence time, temperature, concentration of species, and type of fuel used, are responsible for the total NOx emission. The complex chemical mechanisms make the prediction of NOx emission challenging. From the engine performance point of view, it is a common practice to use some empirical or semi-empirical equations provided in the literature. For example, in Ref. Reference Lefebvre32, a semi-empirical equation has been provided, where the NOx emission depend on the combustion chamber volume, the stoichiometric flame temperature, the primary zone temperature, and the combustor inlet pressure. There are also more NOx emission prediction models presented in Refs Reference Lefebvre and Ballal8 and Reference Rizk and Mongia33. Although these emission prediction tools consider various parameters, they are mainly valid for engines using conventional combustion chamber and, therefore, not suitable for new types of the combustion system, for instance, the sequential combustion chambers.
The ITB engine architecture and properties are substantially different than that of a conventional turbofan engine using conventional combustor. First, the oxidant of the ITB is vitiated air where part of the O2 has been consumed in the first combustor and the products of combustion from the first combustor form a significant part of the incoming gases. Second, the inlet temperature and the flow velocity of the ITB is different from that of the conventional combustor because of the increased temperature and the lower pressure. Moreover, the NOx produced by the main combustor, which is present in the gases, might dissociate in the ITB(Reference Rao and Bhat34). Therefore, it would be inappropriate to use the existing empirical methods for emission prediction of the GITB engine.
To facilitate the NOx prediction for the GITB engine, an in-house emission prediction tool has been developed using Cantera's reactor networks(35). The basic geometry of the combustor is created based on the methodology described by Shakariyants(Reference Shakariyants36). A complete reactor network is constructed using Perfectly Stirred Reactors (PSR), which are integrated to represent different combustion zones within a combustion chamber. The network is displayed in Fig. 11. The entire combustor is divided into three combustion zones, including the primary zone (divided into two sub-sections), the secondary zone, and the dilution zone (divided into two sub sections). Also, a mixing zone is included. The combustor volume is calculated beforehand based on the operating conditions. By specifying the air fractions distributed in the different combustion zones, the residence time and the equivalence ratio of each combustion zone is determined.
Chemical reactor network for the first and the second combustion chambers in the current paper analysis.

To predict the emissions, a detailed chemical reaction mechanism is required. Kerosene is a complex fuel, which contains petroleum by-products in which the dominant mass fractions are of higher hydrocarbon. Chromatograph of kerosene shows the presence of components ranging from butane to tricosane. The average chemical formula varies from C10.9H22 to C12H23. There is a variance of composition in kerosene from one source to another, and this has led to several surrogate compounds being proposed for kerosene by different researchers. Surrogates can be a mix representing the overall physical property of kerosene or chemical surrogate representing the chemical property. The mixture describing both these properties is called ‘comprehensive surrogates. Alkane part of surrogate fuels is well represented by n-Decane and few other compounds; however, the major problem lies with oxidation of aromatic cyclic hydrocarbons. The kerosene reaction is a complex one involving hundreds of species and reactions(Reference Dagaut37). The complicated set of reactions occurring between free hydrogen atoms and aromatic hydrocarbons lead to the formation of soot, which is a very important emission species to be predicted. In general, the prediction of emissions like NOx and CO is strongly dependent on the temperature and flow field, which is strongly dependent on the kinetics of reacting species. For the current study, the Aachen Surrogate containing 77.7% n-Decane and 22.3% n-Propyl Benzene is used. This mechanism has been developed and tested at TU Aachen by Honnet et al.(Reference Honnet, Seshadri, Niemann and Peters38) and consists of 119 species and 527 reactions.
The validation of this combustion reactor network has been performed with respect to an existing CF6 engine(Reference Telidevara39). After the validation, the same methodology is used to design a combustion chamber and estimate the emissions from the baseline VHBR GTF engine and the proposed GITB engine. Even though the combustor used in this analysis is different than a probable future combustion system, which might find its place in the next generation of engines like the Lean Direct Injection combustor( Reference Tacina, Lee and Wey 40 , Reference Tacina, Mao and Wey 41 ), the main aim of the current research is to evaluate the effect of the two engine architectures on the overall emissions. Therefore, the relative change in emissions is more important than the absolute emission.
5.0 RESULTS AND DISCUSSIONS
The cycle optimisation is performed at the cruise condition, whereas the turbine cooling requirement is estimated at the Sea Level Static (SLS) International Standard Atmosphere (ISA) + 15 K condition and applied to the cruise condition. The MATLAB fmincon optimiser using Sequential Quadratic Programming (SQP) algorithm is implemented for the cycle optimisation(42). The objective is to minimise the cruise engine TSFC. Fundamentals of the SQP algorithm has been thoroughly discussed by Nocedal and Wright in Ref. Reference Nocedal and Wright43.
5.1 Engine performance optimisation
The thrust requirement at cruise and SLS conditions are provided in Table 3. The cruise condition is defined at an altitude of 11 km and a Mach number of 0.85, where the cycle is optimised to minimise the TSFC. The turbine cooling airflow rate and the thermal NOx emission are evaluated at the hot day SLS condition.
Engine thrust requirement

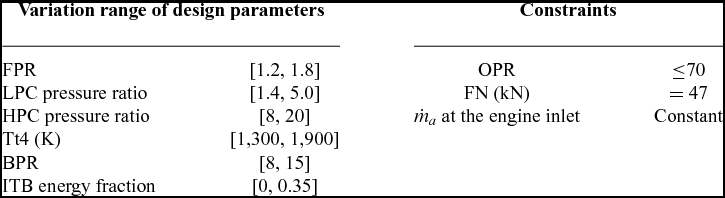
The same design space for the GTF and the GITB engine are defined in Table 4. The OPR is constrained for two reasons. First, it prevents the HPC exit temperature from exceeding the material limit; second, increasing the OPR results in smaller blade size of the HPC last stage, where the tip clearance loss become dominant(Reference Lakshminarayana44). An ITB energy fraction, defined in Equation (1), is applied to indicate the amount of fuel added in the ITB. An ITB energy fraction of zero implies that all the energy is added in the main combustor, similar to the baseline GTF engine. The optimisation is executed at the ITB energy fraction ranging from 0 to 0.35 with a step change of 0.05. The turbine efficiency varies with respect to the turbine cooling air fraction.
 $$\begin{equation}
{\rm{ITB}}\;{\rm{energy}}\;{\rm{fraction}} = \frac{{{{\dot{m}}_{{f_2}}} \times {\rm{LH}}{{\rm{V}}_{f2}}}}{{{{\dot{m}}_{{f_1}}} \times {\rm{LH}}{{\rm{V}}_{f1}} + {{\dot{m}}_{{f_2}}} \times {\rm{LH}}{{\rm{V}}_{f2}}}},
\end{equation}$$
where
 $\dot{m}$
and LHV are the mass flow rate and the Lower Heating Value of given fuel; the subscripts f
1 and f
2 indicate the fuel for the first combustor and the ITB, respectively.
The design space and constraints for the cycle optimisation
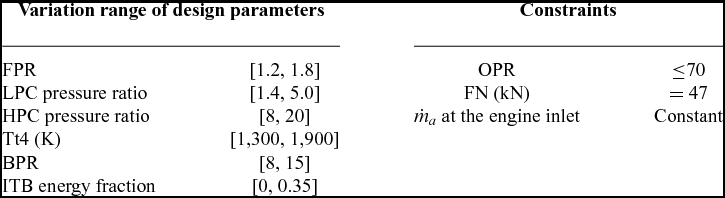
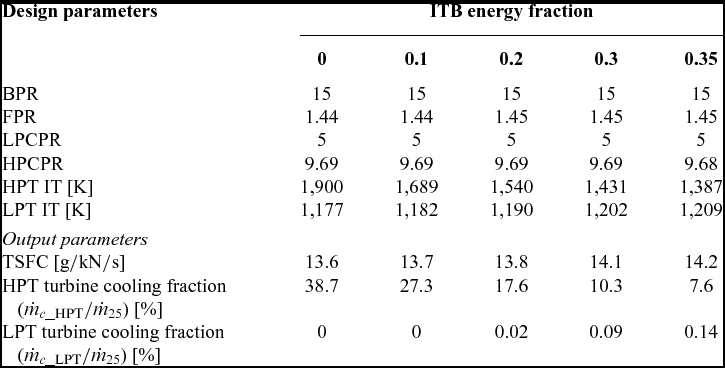
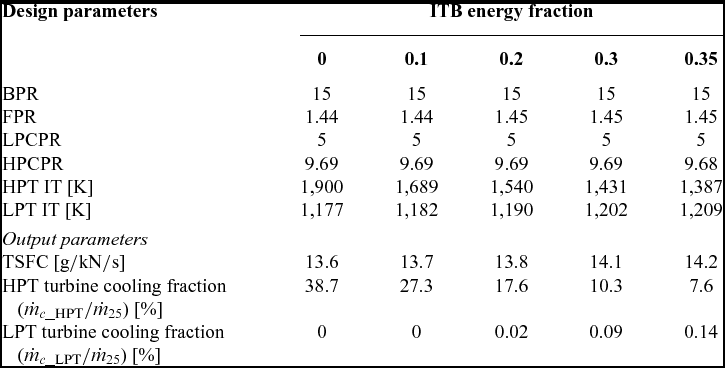
Among all the optimisation cases, the selected examples are presented in Table 5. The
 ${\dot{m}_{c\_{\rm{HPT}}}}$
is the HPT cooling air mass flow rate, the
 ${\dot{m}_{c\_{\rm{LPT}}}}$
is the LPT cooling air mass flow rate, and the
 ${\dot{m}_{25}}$
is the overall air mass flow rate at the HPC inlet. The BPR of each engine reaches the upper limit to maximise the propulsive efficiency. Since the ST (
 ${\dot{m}_a}/FN$
) is kept constant, the FPR of each cycle also remains unchanged. Moreover, the LPC pressure ratio in all cases reaches the maximum. This can be explained from two aspects. First, at a lower ITB energy fraction, the HPT inlet temperature increases and thereby increasing the HPT cooling air requirement. The optimiser tends to reduce the HPT work output by splitting the compression work more towards LPC. Second, when the ITB energy fraction increases, the optimiser tends to increase the ITB operating pressure by reducing the HPC pressure ratio, which is thermodynamically beneficial.
Engine optimisation results at Cruise
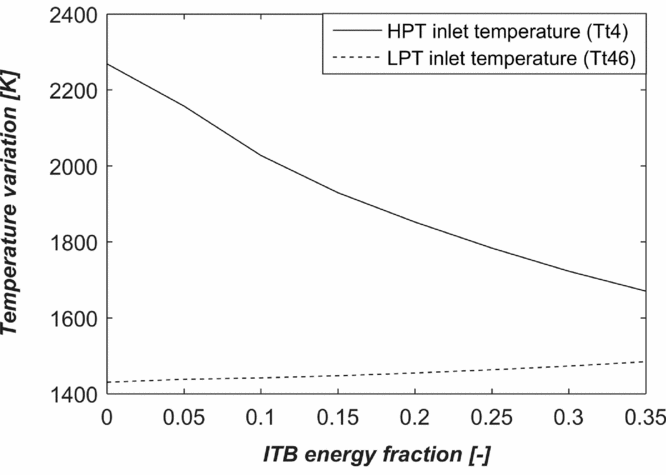
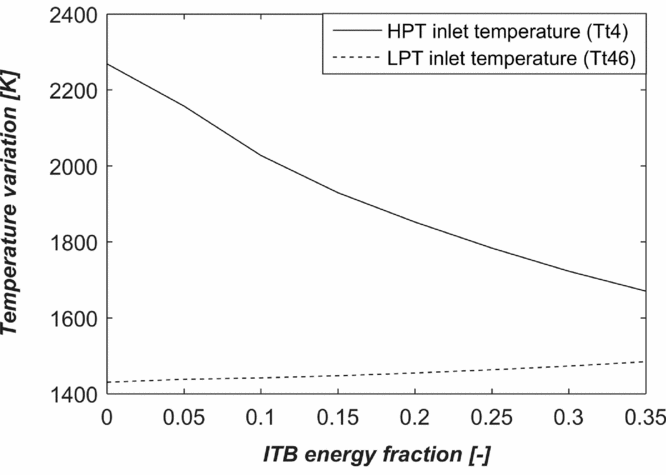
The variation of HPT and LPT inlet temperature for hot-day static thrust is shown in Fig. 12. It shows that the HPT inlet temperature decreases substantially with the increase in the ITB energy fraction. The increase in LPT inlet temperature, on the other hand, is confined by the constraint of constant ST. This helps to reduce the energy wastage in the exhaust heat, thereby improving the thermal efficiency of the reheat cycle.
Variation of turbine inlet temperatures versus ITB energy fraction at SLS.
5.2 Effects of ITB on engine performance and turbine cooling
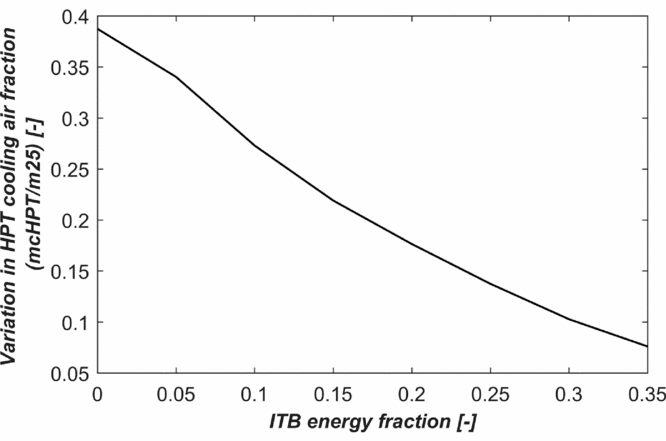
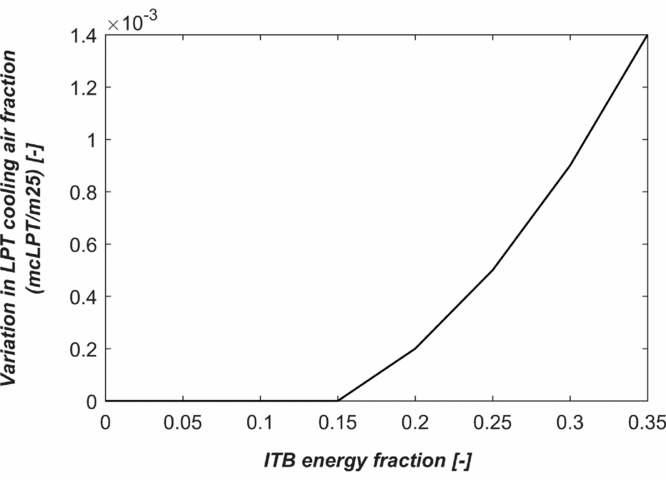
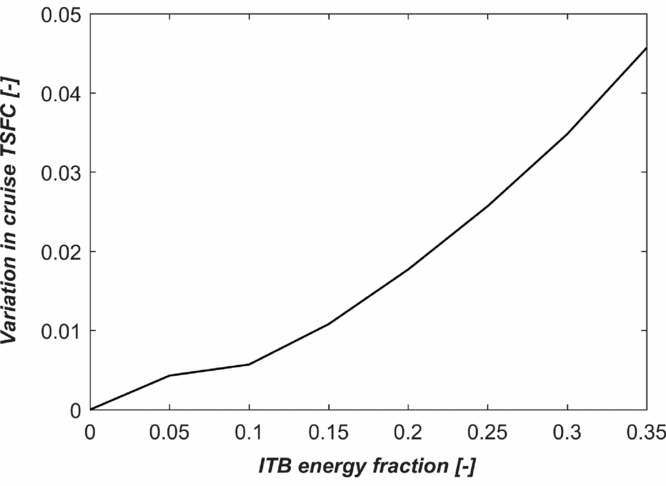
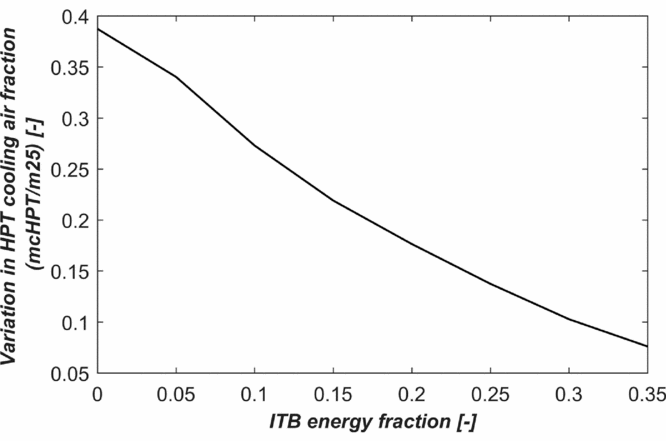
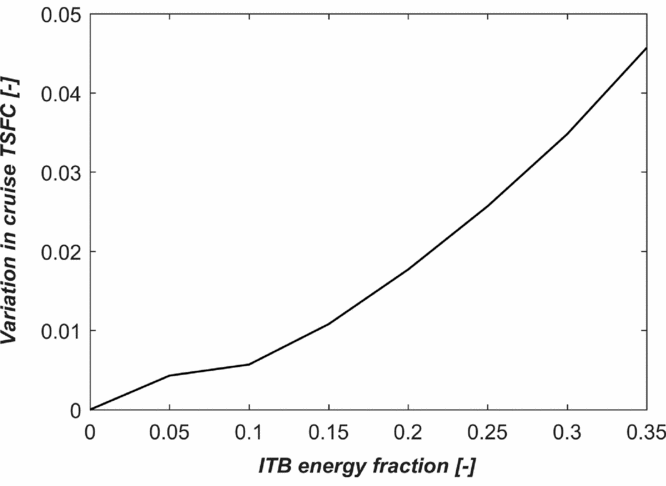
In Figs 13–15, one can see the variation of the HPT cooling, the variation of the LPT cooling and the variation of the cruise TSFC with respect to the ITB energy fraction, respectively. One can see that the HPT cooling fraction reduces substantially as ITB energy fraction increases due to the reduction in the HPT inlet temperature. With an ITB energy fraction of 0 (corresponding to the VHBR GTF engine), the highest HPT cooling air fraction is required. This reduction in cooling airflow improves the HPT efficiency substantially as can be observed from Fig. 16. It can be observed that LPT cooling is not required for ITB energy fraction below 0.15. It also can be observed from Fig. 15 that for ITB energy fraction below 0.15, the increase in TSFC is less than 1%. When the ITB energy fraction increases further, the deterioration in the TSFC increases due to the negative effect of the ITB on cycle thermal efficiency.
Variation of the HPT cooling requirement versus ITB energy fraction.
Variation in low pressure turbine (LPT) cooling requirement versus ITB energy fraction.

Variation in cruise Thrust Specific Fuel Consumption(TSFC) versus ITB energy fraction.
Variation of the HPT polytropic efficiency versus the cooling fraction.

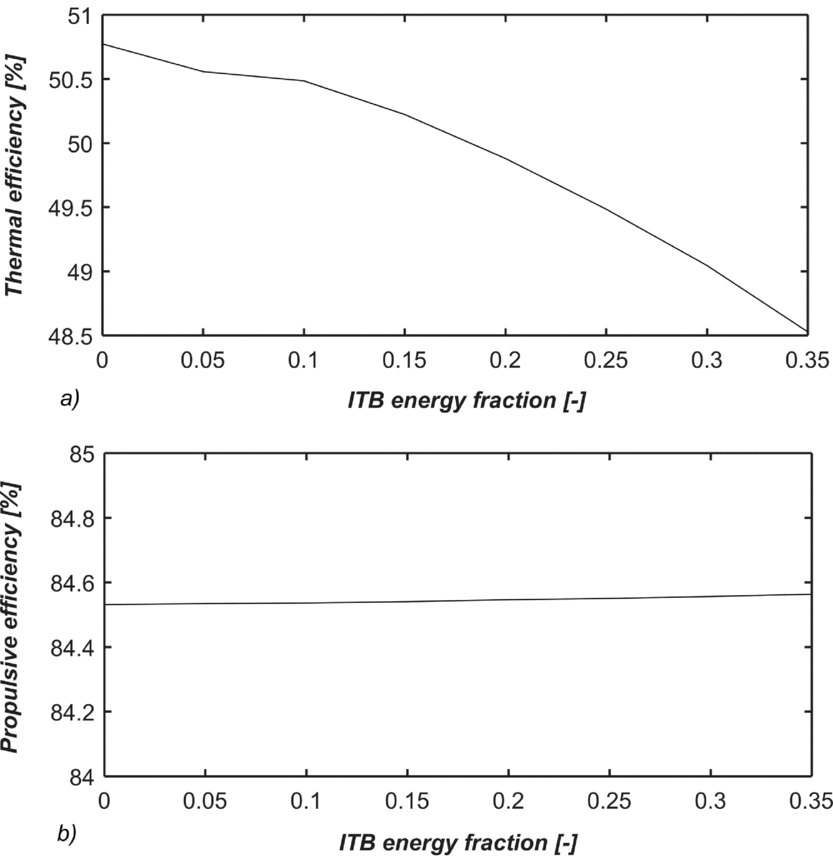
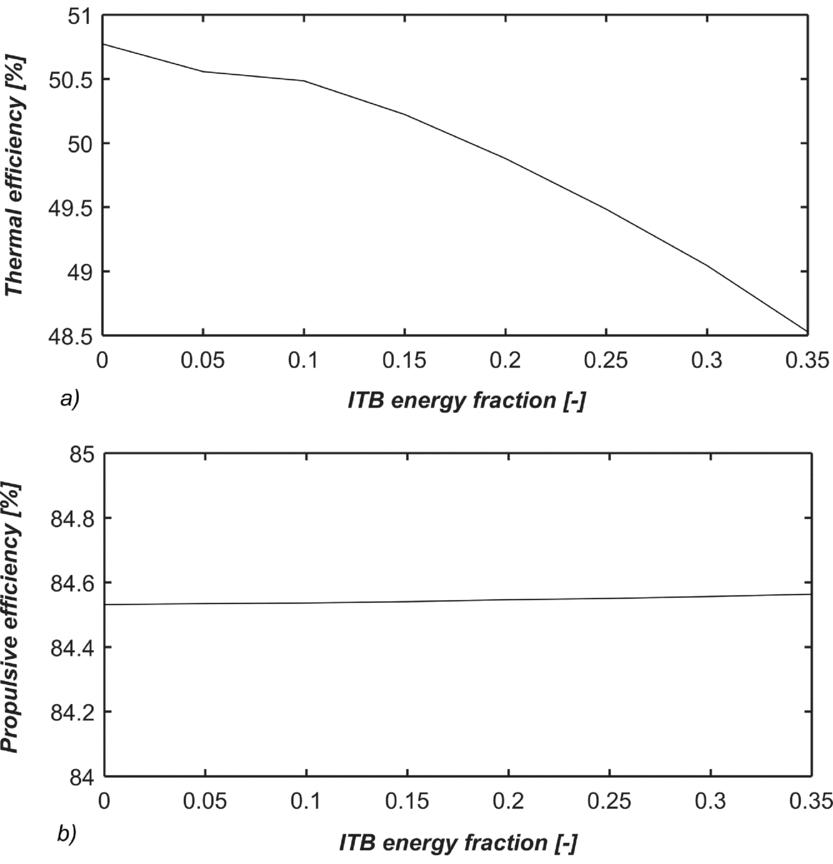
Figure 17 shows the variation of engine thermal efficiency and propulsive efficiency for various ITB energy fractions at cruise condition. Since the ST for each engine cycle is kept the same, the propulsive efficiency remains nearly constant for all engine types. However, the thermal efficiency reduces with increasing energy fraction because the combustion in ITB takes place at a lower pressure (when compared to the main combustion chamber).
(a) Variation in the thermal efficiency at cruise; (b) Variation in the propulsive efficiency at cruise.
5.3 Effects of ITB on NOx emission
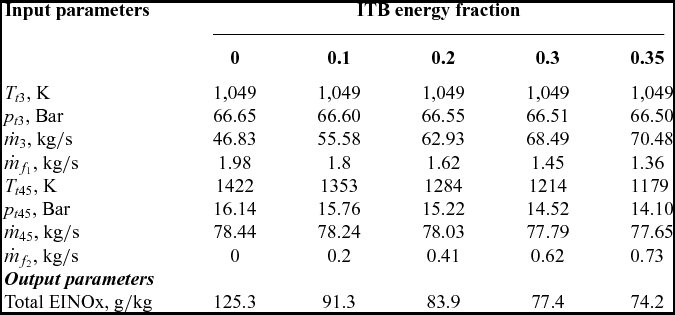
The effects of the ITB on NOx emission is studied at SLS hot-day take-off condition. The engine operating data is obtained from simulations executed in the previous section. The reactor set-up presented in Fig. 11 is used to evaluate NOx emission for each operating condition. To calculate the total NOx emission for GITB engine, the emission from each of the combustor must be evaluated. The combustor inlet conditions, gas composition and operating parameters are required. The values of these combustor operating parameters for various energy fractions is given in Table 6. Moreover, the calculated overall NOx Emission Index (EINOx) at different ITB energy fractions is presented in Table 6.
Inputs for the NOx emissions prediction at SLS ISA+15K
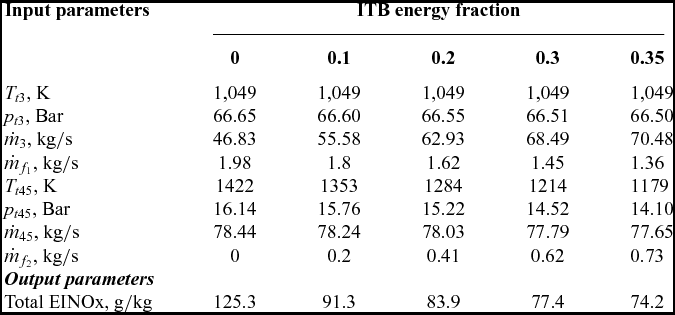
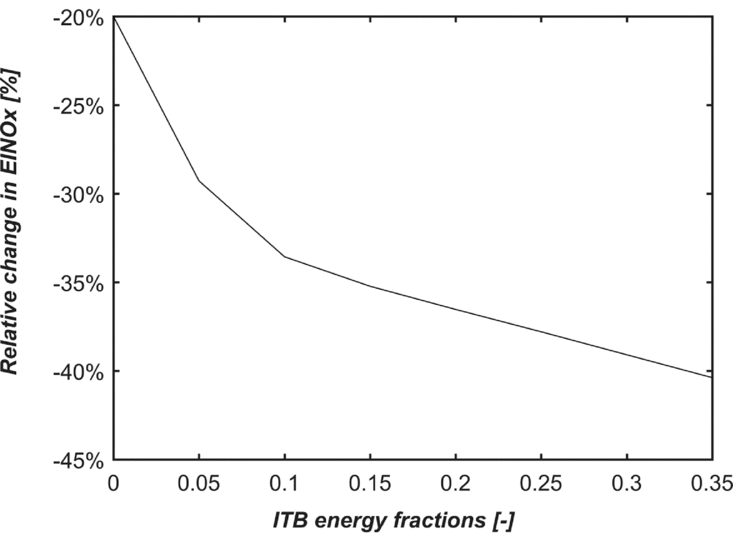
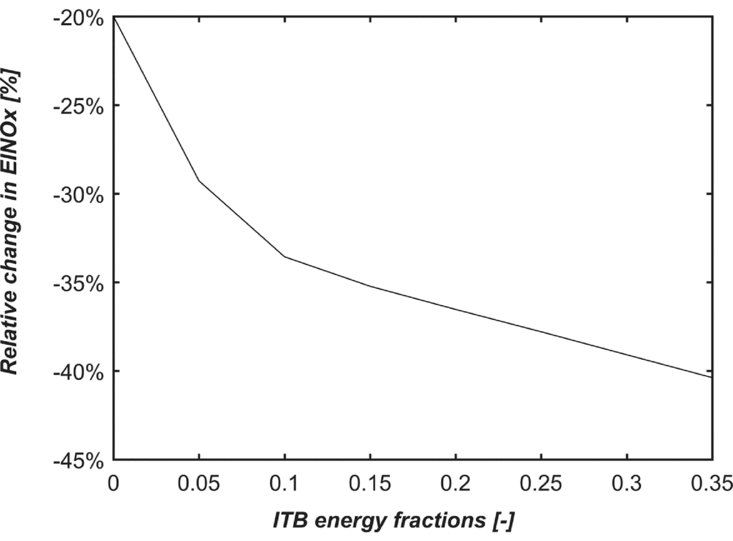
Figure 18 presents the variation in total EINOx versus the ITB energy fraction. The baseline engine is an advanced GTF engine with an ITB energy fraction of zero. It can be observed that due to the reduced energy input in each of the combustor, the NOx emission is lower than the single combustor configuration. Moreover, due to the NOx re-burning process in the ITB, a fraction of the NOx formed in the first combustor dissociates in the ITB, thereby reducing the total NOx emission at the exit of the ITB. Overall, the NOx emission reduces as the ITB energy fraction increases. It can be seen that the NOx emission can be reduced by up to 40% for an ITB energy fraction of 0.35. However, the penalty incurred in the thermal efficiency due to the higher ITB energy fraction should be taken into account, as discussed in the previous section. It should be noted that the above analysis and estimates about NOx reduction are conservative as the ITB is assumed to be similar as the main combustor in the current analysis. The ITB could be incorporated within the inter-turbine duct and novel combustion techniques like flameless combustion could be used to reduce the NOx emission even further, as elaborated by Rao and Bhat(Reference Rao and Bhat34).
Variation in NOx emission with ITB energy fraction at SLS ISA+15 K.
6.0 CONCLUSIONS
This analysis performed in this paper enables us to understand the potential advantages of using an Inter-stage Turbine Burner in a commercial VHBR turbofan engine. Primarily, the effect of the ITB on turbine cooling, NOx emission and fuel consumption has been presented. Several conclusions can be drawn from this research.
-
• The implementation of ITB helps to reduce the HPT operating temperature substantially, thereby resulting in a reduction in HPT cooling air requirement substantially, by up to 80%. This reduction in cooling air flow has a positive influence on HPT efficiency and the HPT operating life.
-
• The LPT cooling requirement is negligible (less than 0.2%) up to an ITB energy fraction of 0.35.
-
• The implementation of ITB reduces the thermal efficiency of the engine due to the pressure losses and heat addition at lower pressure; however, the improvement in turbine efficiency due to reduction in cooling can mitigate this effect to a large extent.
-
• With reduced energy input in each combustor and “NOx re-burning” in the ITB, the proposed GITB turbofan can reduce the NOx emission by up to 40% when compared to a contemporary GTF engine. This reduction is conservative, novel combustion techniques such as flameless combustion (as elaborated by Rao and Bhat) could be employed in ITB to reduce the NOx emission even further.
-
• Just as the addition of the gear on the LP spool helped to increase the engine propulsive efficiency without compromising the thermal efficiency, the ITB could help the engine to increase the engine OPR and TIT without compromising the engine NOx emission.