




No CrossRef data available.
Article contents
- Abstract
- INTRODUCTION
- POLYMORPHIC AND VARIANT ANTIGENS
- SIGNATURES OF SELECTION ON ANTIGEN GENES
- METHODS FOR DETECTING SELECTION ON GENES
- A CLOSE EXAMINATION OF ONE METHOD
- MORE THAN ONE METHOD IS REQUIRED
- EVIDENCE OF IMMUNE SELECTION ON THE P. FALCIPARUM APICAL MEMBRANE ANTIGEN 1
- EVIDENCE OF IMMUNE SELECTION ON THE P. FALCIPARUM MEROZOITE SURFACE PROTEIN 1
- PATHOGENS WITH EPIDEMIC POPULATIONS
- PHYLOGENETIC CONSIDERATIONS
- References
Measuring immune selection
Published online by Cambridge University Press: 29 May 2003
Article contents
- Abstract
- INTRODUCTION
- POLYMORPHIC AND VARIANT ANTIGENS
- SIGNATURES OF SELECTION ON ANTIGEN GENES
- METHODS FOR DETECTING SELECTION ON GENES
- A CLOSE EXAMINATION OF ONE METHOD
- MORE THAN ONE METHOD IS REQUIRED
- EVIDENCE OF IMMUNE SELECTION ON THE P. FALCIPARUM APICAL MEMBRANE ANTIGEN 1
- EVIDENCE OF IMMUNE SELECTION ON THE P. FALCIPARUM MEROZOITE SURFACE PROTEIN 1
- PATHOGENS WITH EPIDEMIC POPULATIONS
- PHYLOGENETIC CONSIDERATIONS
- References
Abstract
Immune responses that kill pathogens or reduce their reproductive rate are generally important in protecting hosts from infection and disease. Pathogens that escape the full impact of such responses will survive, and any heritable genetic basis of this evasion will be selected. Due to the memory component of vertebrate immune responses, pathogens with rare alleles of a target antigen can have an advantage over those with common alleles, leading to the maintenance of a polymorphism. At the genetic level, there ought to be detectable signatures of balancing selection in the genes encoding these antigens. Here, methods for identifying these selective signatures are reviewed. Their practical utility for identifying which antigens are targets of protective immune responses is discussed.
Information
- Type
- Research Article
- Information
- Copyright
- © 2002 Cambridge University Press
INTRODUCTION
Immune responses to pathogens involve diverse mechanisms, directed against many different target epitopes. However, only a minority of these responses may be protective to the host. Empirical description of all immune responses in natural infections is an enormous task which is not guaranteed to identify the protective responses. Methods for focusing research efforts on protective immune responses are therefore desirable.
Logically, mechanisms and targets of protective immunity should be best understood in studies of pathogens with small genomes and few expressed proteins. The specificity of responses to particular viruses, including Human Immunodeficiency Virus-1 (HIV-1) and related viruses in monkeys has been dissected in fine detail. Concurrent study of genetic variation in the hosts and in the viruses has proved critical in understanding which responses are protective (Evans et al. 1999; Allen et al. 2000; Kelleher et al. 2001). There is tight genetic restriction of cytotoxic T cell (CTL) responses against viral peptides, with differences between hosts in MHC class I alleles determining whether an effective response is made. Due to the high viral mutation rate, mutants with alterations in CTL epitope sequences frequently arise, and their growth and selection is affected by the specificity of the CTL response in the host (Goulder et al. 2001). It has even been noted that where selection of sequence variants is not seen, this is evidence for the absence of a protective immune response to that sequence (Hay et al. 1999). This may be an extreme system, but it raises the question of whether an understanding of immune selection on pathogen antigens may be generally useful.
POLYMORPHIC AND VARIANT ANTIGENS
It is observed that many pathogen antigens are polymorphic (multiple allelic forms existing in the species), and many others undergo variation within a clone (due to the differential expression of multiple loci in the genome). Examples of single-locus antigen genes that are highly polymorphic in pathogens of humans or domestic animals are given in Table 1, and examples of multi-locus genes responsible for antigenic variation are given in Table 2. The significance of such polymorphism and variation is not known in most cases. Particular protein domains may be involved in pathogen adhesion to (or invasion of) host cells, causing variation in tissue tropism and virulence. Additionally, these or other domains may be targets of protective immune responses. The distribution and function of polymorphism and variation therefore warrants investigation.


The range of pathogens with single-locus polymorphic (Table 1) and multi-locus variant (Table 2) antigens is very similar. The one obvious exception is that viruses with small genomes cannot have multi-locus antigen genes, but otherwise the existence of either polymorphic or variant antigens appears not to be phylogenetically restricted. Virtually all of the polymorphic or variant antigens known so far have a surface location. It may also be noted that the majority of polymorphic antigens (Table 1) are on the invasive stages of the pathogens, whereas most of the variant antigens (Table 2) are on the surface of infected cells or on extracellular pathogens. This latter trend is not absolute, and there is at least one example known of a variant antigen expressed in an invasive stage of a rodent malaria parasite (Preiser et al. 1999), but it may be worth future attention.
A common hypothesis is that there is frequency-dependent selection on antigens, so that a pathogen with a rare antigenic type is more likely to escape acquired immune responses than a pathogen with a common type. This depends on the memory component of vertebrate immune responses, and the advantage of the rare type is soon lost if it becomes very common. In the case of polymorphic antigens encoded by single gene loci in the pathogen genome (Fig. 1A), this would be an effective means of selection maintaining different alleles within populations. This would not indicate that the pathogen has a ‘strategy’ to escape immune responses, but rather the opposite. It is simply the result of ongoing allele-specific mortality of the pathogen, from which no allele has found an escape to fixation.

Fig. 1. A. Scheme of immune selection on a polymorphic pathogen surface antigen (3 different clones within a host). Allele-specific immune responses cause differential survival of the unrecognised genotype, and thus natural selection on heritable variation. B. Scheme of immune selection on transcriptionally-determined phenotypes of a variant pathogen surface antigen encoded by 3 variant genes (with 3 different phenotypes of one clone within a host). Variant-specific immune responses cause differential survival of the unrecognised phenotype, but this has an identical genotype to the other variants so there is no heritable change.
Antigens encoded by multiple variant gene loci can provide another means of survival, as a single pathogen clone has a range of options for expression (Fig. 1B). The genetic mechanisms by which phenotypic switching occurs within a clone will affect the type of selection to which the pathogen is subjected. In a single clone infection, antigenic phenotypes may switch without any changes occurring in the genome, by alteration of gene transcription. Immune selection among the various phenotypes will not lead to heritable change in a population of identical clones. However, selection may occur between genotypically different pathogens, and this selection would potentially involve the whole repertoire of gene loci encoding the variant antigens (together with the switching mechanism itself).
So, why do polymorphic single-locus antigen genes under balancing selection not always evolve into multi-locus genes by duplication? It would seem to be generally advantageous for a pathogen genome to contain options for many antigenic types and to temporally express different alternative rare types, rather than encoding and expressing only one type that is subject to greater mortality when common. However, the existence of a highly effective and exclusive expression switching mechanism would be a logical pre-requisite for a hypothetical selective advantage of antigen gene duplication and diversification in the genome. A pathogen with an increased antigenic repertoire, which was constantly expressed, would be likely to have a serious disadvantage. It would thus appear that evolution of multi-locus systems of antigenic variation requires co-evolution of the antigenic repertoire (due to duplication and changes in the antigen gene coding sequences) and the regulation of their expression (due to changes in the promoter sequences and the expression of transcription factors which bind to them, or possibly involving other mechanisms). This requirement for co-evolution of repertoire and regulation could be a general impediment to the evolution of antigen variation systems.
Here, a simple question is considered which is relevant to either single-locus or multi-locus systems. How is it possible to identify which antigens are under selection by immune responses, and moreover, to identify the particular domains under the strongest selection?
SIGNATURES OF SELECTION ON ANTIGEN GENES
An understanding of selection on multi-locus variant antigen genes will be highly complex. The heritability of a switch in antigenicity may be uncertain, and not necessarily determined by whether there is a change at the DNA sequence level. Some transcriptional changes result from ‘epigenetic’ modification of parts of the genome, for example by methylation of DNA or acetylation of histones, at specific loci or whole chromosomal regions such as telomeres. These modifications may affect the phenotypes of subsequent generations, and in that sense display a form of inheritance. In eukaryotes, the existence and mechanisms of epigenetic inheritance differs among phylogenetic groups (Martienssen & Colot, 2001), and it is likely that they differ greatly among pathogens. Conversely, some mutational changes in DNA sequences are inherently unstable and may not be heritable in the long-term. In particular, homopolymeric tracts (continuous runs of a single nucleotide) are liable to a high frequency of slip-strand mutation leading to the loss or gain of a single nucleotide, leading to frameshifts within coding sequences (Parkhill et al. 2000). This provides a mechanism of ‘phase variation’ which switches protein expression on and off in different generations, and therefore is potentially important in varying the expression of antigens and other virulence genes. For each system of antigen variation, thorough genomic and transcriptional characterization of the genes is ideally required as a basis for studies of natural selection.
In contrast, testing for signatures of selection on single-locus genes can be relatively straightforward, at least in principle. This is because of the development of the neutral theory of molecular evolution (Kimura, 1983; Li, 1997). Understanding how genes will vary and diverge in populations without selection (due to mutation, gene frequency drift, population division, and migration), and how they are constrained by negative selection on deleterious mutations, provides a means of noting the exceptions (i.e. genes at which the polymorphism is influenced by positive selection). A common misconception is that genetic variation that shows a non-random pattern is evidence of selection. In fact, neutral processes do not normally lead to random patterns in DNA variation, but rather to a range of possible patterns, caused by the combined effects of mutation, recombination, gene frequency drift, and population size and structure. The expected range of neutral variation can only be predicted by a consideration of the processes themselves. There is extensive statistical understanding of the patterns of nucleotide variation that can occur under neutrality, allowing expectations to be made under different models, and thereby allowing the detection of significant observed departures from these (Kreitman, 2000).
METHODS FOR DETECTING SELECTION ON GENES
It is of practical importance to consider which of these analytical methods are most useful for detecting evidence of selection on pathogen antigen genes. One way in which this may be approached is to compare the results of previous studies. It is of particular interest to examine a number of different statistical tests applied to the same antigen gene, or alternatively to examine the results of the same test applied to different antigen genes. The malaria parasite Plasmodium falciparum has the largest number of polymorphic single-locus antigen genes yet described, of which 13 have been explored for evidence of selection by one method or another, which should provide a reasonably broad base for such preliminary comparisons. These are listed in Table 3 (with criteria for inclusion given in the footnote). Four of the methods listed, named after their inventors (Watterson, 1978; Tajima, 1989; McDonald & Kreitman, 1991; Fu & Li, 1993), are formal tests of whether patterns of polymorphism in a given locus depart from neutral expectations. The remaining two, dN/dS ratio and fixation (FST) indices, are effective for comparative analyses of variation in multiple genes or regions of a gene, to detect loci which are unusual (Nei & Gojobori, 1986; McDonald, 1994). The dN/dS ratio, i.e. the ratio of the proportion of nonsynonymous (amino-acid altering) nucleotide allelic differences per nonsynonymous site versus the proportion of synonymous (silent) differences per synonymous site, can also operate in principle as a formal test of neutrality. However, this is skewed by biases in nucleotide composition and codon usage in many organisms, including P. falciparum, so other approaches to account for this are required.

In Table 3, the P. falciparum antigen genes marked with an asterisk for a given analysis show where data were indicative of diversifying selection. Evidence of selection on the ama1 gene (encoding apical membrane antigen 1 in the micronemes of the invasive merozoite stage) has emerged from all four different approaches applied to it (McDonald-Kreitman, dN/dS ratio, Tajima's, and Fu & Li's tests). Similarly, there are indications of selection from each of the three analyses applied to msp2 (dN/dS ratio, Ewens-Watterson, and FST), the two analyses applied to glurp (McDonald-Kreitman, and Ewens-Watterson), the two analyses applied to pfs48/45 (McDonald-Kreitman, and FST), and the two analyses applied to lsa-1 (McDonald-Kreitman, and dN/dS ratio). Conversely, there was no evidence of selection from either of two analyses of the S-antigen gene (dN/dS ratio, and FST) or two analyses of the pfs25 gene (McDonald-Kreitman, and dN/dS ratio). For all of the above genes, the different analyses lead to very concordant results. From this, it is reasonable to conclude that there is stronger evidence of selection on the ama1, msp2, glurp, lsa-1, and pfs48/45 genes than on the S-antigen or pfs25 genes.
For some other antigen genes (e.g. csp, msp1, and eba-175) there are apparent differences between analyses in Table 3, with evidence of selection provided by one test but not another. It is these latter cases that might be expected to discriminate between tests (regarding their power or validity). Do some tests yield false positive results, or are other tests inherently lacking in power? It is not clear that either problem exists, because of the different nature and size of the data sets analysed by each of the tests, meaning that accurate comparison between tests cannot be done. Moreover, different regions of the msp1 and eba-175 genes were studied in the different tests applied to each gene, so the results are not comparable. In summary, it is advisable to employ multiple analyses in the investigation of evidence of selection on a gene. Most tests are informative to some extent, and it is not clear from Table 3 whether any one test has generally proved more useful than others. However, the amount and the nature of the data needed for each type of analysis differs, and this may prove the deciding factor for future work which is likely to require study of larger numbers of genes. The sequence-based method which probably requires fewest samples and the least amount of sequencing is the McDonald-Kreitman test.
A CLOSE EXAMINATION OF ONE METHOD
We will consider the performance of the McDonald-Kreitman test in more detail. Table 4 shows the results of this test applied to 9 different antigen genes of P. falciparum. This test examines the numbers of polymorphic nucleotides which are synonymous (silent) and non-synonymous (amino acid altering), in a sample of P. falciparum alleles, and also the number of synonymous and non-synonymous nucleotide fixed differences between P. falciparum and the homologous gene from a closely-related species (in this case the chimpanzee parasite P. reichenowi). At each level, intra-specific and inter-specific, it is observable that there are more non-synonymous than synonymous differences. This observation in itself may be expected in the absence of any positive or negative selection. This is firstly because of the trivial but universal feature that most nucleotide positions in coding sequences are non-synonymous (synonymous positions are mainly at the third position in codons). Secondly, in the case of Plasmodium there is a particularly restricted codon usage (some synonymous alternative codons being scarcely used) due to the extreme A+T richness of the genome. However, as these general effects are the same for both P. falciparum and P. reichenowi (which have similar codon usage), bias will not affect the McDonald-Kreitman test here (but care needs to be taken when applying this test to other species). For this procedure, to test whether non-synonymous or synonymous differences are particularly skewed in ratios within a species or between species, a 2×2 table is constructed. Fisher's exact test of significance is applied, and the ‘Neutrality Index’ odds ratio shows to what extent there is an excess (odds ratio >1) or deficit (<1) of within-species nonsynonymous polymorphisms.

Five of the nine genes analysed in Table 4 show a significant excess of intra-specific non-synonymous versus synonymous polymorphism (compared to the ratios for inter-specific differences), including genes encoding antigens considered prime candidates for a blood-stage malaria vaccine (ama1, eba-175, glurp). The significant results do not simply go with the genes which have a lot of sequence polymorphism. The results are rather more revealing, possibly even surprising. The most highly significant result is for lsa-1 (the gene encoding liver stage antigen-1), indicating strong diversifying selection on the amino acid sequence in P. falciparum. LSA-1 has been previously noted to have few amino acid polymorphisms, encouraging hopes that a vaccine might be based on conserved sequences in this case (Fidock et al. 1994; Aidoo et al. 1995). However, what matters here (and everywhere else) is the quality rather than the quantity of allelic differences. For example, at position 85 in the LSA-1 protein there are 3 amino acid alleles, due to 3 different nucleotides at the first position in the codon (highly unlikely under neutrality given the low overall polymorphism). Interestingly, synthetic peptides including the alternatives at this position have very different binding profiles to human HLA class I alleles, and interferon γ responses (putatively by cytotoxic T lymphocytes) are specific to the allelic peptides (Bucci et al. 2000). This suggests that these acquired allele-specific responses may be protective, and this may maintain the amino acid alleles in a frequency-dependent manner. Further work is needed to identify the nature of selection on LSA-1 sequences, as the results would be relevant to design of a P. falciparum vaccine containing LSA-1 (Kurtis et al. 2001).
In contrast, the McDonald-Kreitman analysis shows no evidence of selection on csp (the gene encoding the circumsporozoite protein), although the dN/dS ratio within P. falciparum alone has been taken as evidence for positive selection (Table 3). Which result should be accepted, or can they be reconciled? As with any single type of analysis, the McDonald-Kreitman test will be able to identify a real non-neutral pattern of sequence polymorphism in some cases, but not others. For example, it could be that there is positive diversifying selection on the csp gene causing adaptive changes between species as well as allelic differences within species, and both effects would cancel out the ability of the McDonald-Kreitman test to detect either. Immunological studies have clearly shown T cell responses to allele-specific peptide sequences of the CSP (Zevering, Khamboonruang & Good, 1994; Gilbert et al. 1998; Plebanski et al. 1999) and have led to the hypothesis that these maintain an adaptive polymorphism, either by escape or by antagonism (Gilbert et al. 1998; Plebanski et al. 1999). However, it is not known whether these particular responses are effective in killing parasites, and there is evidence that most protective responses to the CSP-based RTS,S/AS02 vaccine are not allele-specific (Bojang et al. 2001). In this case, and in general, there is a need to perform further analyses to detect the precise type of selection operating.
MORE THAN ONE METHOD IS REQUIRED
There is a real possibility that some signatures of diversifying selection on pathogen antigens are not caused by immune responses. If the results of one test are taken in isolation, and caution not applied to the processes of hypothesis generation and testing, misleading conclusions are likely. The McDonald-Kreitman test in Table 4 shows evidence of diversifying selection on the pfs48/45 gene (encoding a major component of the malaria parasite gametocyte and gamete surface) in P. falciparum. It would be incorrect to conclude from this that selection maintains variation within P. falciparum populations. The pfs48/45 sequences were derived from isolates of scattered origin, rather than being sampled from one local population, so the result could be due to geographically divergent selection fixing different alleles in different populations (Fig. 2). Detailed studies of the distribution of pfs48/45 alleles throughout the world show that they are more geographically skewed than alleles at any other locus (Drakeley et al. 1996; Conway et al. 2001). This employs the FST index as listed in Table 3, with pfs48/45 having exceptionally high values compared to other loci. This is the opposite to the result expected from balancing selection, and therefore does not lead to a hypothesis of allele specific immunity. A much more plausible hypothesis has emerged in this case, as the Pfs48/45 protein has a fertilisation role in the male gamete, and intense competition between male gametes is likely to drive adaptive changes (Conway et al. 2001; van Dijk et al. 2001).

Fig. 2. Scheme of two cases of positive diversifying selection within a species, with completely opposite causes. A. Balancing selection maintains allelic diversity within populations (for example due to frequency-dependent selection favouring rare types). B. Divergent selection in different populations leads to fixation of different alleles (adaptation of populations to different conditions). Note that broad sampling of genotypes from the species would yield similar diversity in each case. Structured sampling of different populations would be required to reveal the distribution of the alleles and the likely cause of selection.
Other antigen genes have yielded consistent evidence of balancing selection, maintaining variation within populations. The signatures of selection can be located in particular regions of the genes, and immune responses to the corresponding regions of the proteins can then be prospectively studied.
EVIDENCE OF IMMUNE SELECTION ON THE P. FALCIPARUM APICAL MEMBRANE ANTIGEN 1
The apical membrane antigen-1 gene (ama1) is present in a single copy in all Plasmodium species studied, and is also present in the distantly related apicomplexan Toxoplasma gondii (Hehl et al. 2000). There is sequence polymorphism in ama1 of P. falciparum, which is markedly higher at non-synonymous compared to synonymous nucleotide sites (Hughes & Hughes, 1995; Verra & Hughes, 1999). The predominance of non-synonymous changes is particularly high among alleles of P. falciparum, when compared to inter-specific differences with P. reichenowi in the McDonald-Kreitman test, as noted in Table 4 (Kocken et al. 2000). This is highly significant for the surface-accessible ‘ectodomain’ region of the mature protein, but there is no effect seen in the region encoding the N-terminal ‘signal and prosequence’ which is cleaved prior to externalisation of the remainder of the protein on the merozoite surface (Kocken et al. 2000). Focusing on the sequence encoding the ectodomain, a large survey of alleles was then made from a single endemic population in Nigeria, and multiple tests were applied to locate any non-neutral effects more precisely. Figure 3 shows a sliding window plot along the sequence for indices of neutrality (Tajima's and Fu & Li's). Departure from neutrality was significant, with strongest evidence of diversifying selection (the most positive values of Tajima's and Fu & Li's indices) on domains I and III of the sequence (Polley & Conway, 2001).

Fig. 3. Scheme of Plasmodium falciparum ama1 with two sliding window tests of neutrality, using a sample of 51 alleles randomly taken from one population in Nigeria. A. Block scheme showing the major domains of the protein (Domain I–III together comprise the merozoite surface-accessible ‘ectodomain’ of the mature protein). B. Sliding window plots Tajima's D index (positive values indicate balancing selection, negative would indicate directional selection). C. Sliding window of Fu & Li's D and F indices (positive values indicate balancing selection, negative would indicate directional selection). Horizontal lines at the top of panels B and C show the positions of Domains I–III.
It was thus predicted that acquired protective immune responses exist against allele-specific epitopes in the P. falciparum AMA1 protein, particularly in Domains I and III. Direct evidence of this has emerged from recent assays of parasite invasion inhibition by human antibodies affinity-purified to one allelic form of AMA1 (3D7 type), and by antibodies from a rabbit immunised with that allelic form (Hodder et al. 2001). Homologous (3D7) parasites were highly inhibited by both antibody preparations, but parasites with a divergent AMA1 allele sequence (HB3 type) were less effectively inhibited. Another heterologous parasite (D10) had a sequence more similar to 3D7 (being identical in Domain I), and this was very effectively inhibited, suggesting that inhibitory antibodies recognise allele-specific sequences in Domain I (Hodder, Crewther & Anders, 2001). Further work is required to investigate whether there are inhibitory antibodies to Domain III.
EVIDENCE OF IMMUNE SELECTION ON THE P. FALCIPARUM MEROZOITE SURFACE PROTEIN 1
The merozoite surface protein 1 (MSP1) is encoded by a single copy gene in all Plasmodium parasites, with a high level of sequence polymorphism in each species studied. In P. falciparum, more than 30% of the amino acid residues differ among naturally occurring alleles (Miller et al. 1993), although there are a few regions of the protein sequence in which less than 10% of residues are polymorphic (such as the c-terminal MSP119 fragment). Immunisation with purified MSP1 has conferred a significant level of protection to blood-stage challenge in New World Monkeys (Hall et al. 1984; Siddiqui et al. 1987), and it is considered essential to identify the targets of protective antibodies in this model and also in naturally acquired human immunity. Much attention has been focused on the c-terminal MSP119, which is a major target of antibodies that inhibit invasion in vitro (Patino et al. 1997; O’Donnell et al. 2001). The remainder of the protein has been much less intensively studied.
Alleles of the P. falciparum msp1 gene exist at stable frequencies over time in highly endemic populations (Conway, Greenwood & McBride, 1992; Ferreira et al. 1998), although they are less stable in epidemic or low-endemic populations (Babiker, Satti & Walliker, 1995; Silva et al. 2000). To investigate whether polymorphism in any single part of msp1 is under particularly strong balancing selection, polymorphic sites in different parts of the gene (Fig. 4A) were typed in multiple population samples from endemic areas in Africa and Southeast Asia, and the allele frequency distributions analysed. Of the 10 polymorphic sites studied in the 6 African populations, the one with the lowest geographical variance (FST) in frequencies among populations (i.e. the polymorphic site at which most of the overall diversity exists also within each of the local populations) was block 2 (bk2, Fig. 4B). Also, of the 4 polymorphic sites studied in the two Southeast Asian populations, block 2 had the most similar allele frequencies in both populations and thus the lowest FST value (Fig. 4C).

Fig. 4. A. Scheme of the P. falciparum msp1 gene (blocks with solid shading have the most, diagonal shading intermediate, and no shading the least amino acid polymorphisms; Tanabe et al. 1987). Below are (i) 10 polymorphic sites studied in 6 population samples from Africa, (ii) 4 polymorphic sites studied in 2 populations in Southeast Asia (Conway et al. 2000a). B. Summary of FST indices (the proportion of overall allelic variation which differs among populations) for the 10 polymorphic sites (intragenic loci) among the 6 populations in Africa. C. Summary of FST indices for the 4 polymorphic sites among the 2 populations in Southeast Asia. Asterisks show where FST values were significantly >0. Arrows indicate the particular site in the gene (block 2, abbreviated to bk2) with the lowest FST index in both continental analyses (i.e. at which most of the overall diversity is also represented within each local population).
From these results, it was predicted that allele-specific protective immune responses occur against the block 2 part of the MSP1 protein, causing balancing selection which maintains alleles within populations. To test this, a cohort of Gambian children was studied for serum antibody reactivities to different recombinant proteins representing different allelic forms of block 2. The antibody reactivities prior to the annual malaria transmission season were tested as predictors of an outcome of clinical malaria at any point during follow up throughout the malaria season. Antibodies against any of the recombinant proteins representing the two most frequent allelic types of block 2 in The Gambia (K1-like and MAD20-like) were strongly associated with a lower prospective risk of clinical malaria (relative risks of significantly <1.0, Fig. 5). Children with antibodies against both K1-like and MAD20-like types had an even lower risk of malaria, consistent with the additive effect expected with allele-specific immunity (Conway et al. 2000a). Antibodies to the rarest of the block 2 types (RO33-like) were not significantly associated with protection.

Fig. 5. Associations of anti-MSP1 block 2 antibodies with protection from clinical malaria in a longitudinal cohort study of Gambian children (data from Conway et al. 2000a). Reactivity of IgG in serum from 337 Gambian children in June (prior to the malaria transmission season) was tested for positivity by ELISA against a panel of 9 recombinant proteins representing block 2 sequences which fall into 3 major types (K1-like, MAD-like, and RO33-like; these have local allele frequencies in The Gambia of 0.51, 0.33 and 0.16, respectively). This positivity was tested for association with the subsequent experience of clinical malaria in these children from July–November (throughout the transmission season). A relative risk of <1 indicates where antibody reactivity is associated with a reduced risk of malaria (asterisks show where this is statistically significant).
PATHOGENS WITH EPIDEMIC POPULATIONS
The studies of P. falciparum that form the above examples have utilised the fact that this pathogen shows quite stable endemicity throughout much of its range, particularly in Africa. The acquisition of non-sterile protective immunity with repeated exposure throughout life is a characteristic feature of the epidemiology, as is the temporal stability of the frequency distributions of antigen types. These features are characteristic of many endemic pathogens apart from malaria parasites, including some of those causing diseases of human and veterinary importance. In contrast, there are many pathogens which inflict most clinical disease during epidemics. Those which cause only rare or sporadic human outbreaks, such as Cryptosporidium parvum (Fayer, Morgan & Upton, 2000) or Ebola virus (Oyok et al. 2001), are not maintained within the population and it is likely that human immune selection plays only a minor role in their evolution.
However, pathogens which cause regular human epidemics, and those which are normally maintained asymptomatically in humans (with ‘emergence’ of symptomatic cases at some times and places), are likely to be under immune selection. Indeed, distinct antigenic types evolve, for example in Neisseria meningitidis group A (Zhu et al. 2001) and Streptococcus group A (Hoe et al. 1999; Kaplan, Wotton & Johnson, 2001) and human immune selection can cause a replacement of a previous antigenic type with a new one rather than maintenance of a polymorphism. Such positive selection of new types causes alleles to go towards fixation leading to a different signature of selection at the DNA level compared with selection that favours rare types regardless of their age. In other words, important antigens of common epidemic pathogens are more likely to be under directional selection, and those of common endemic pathogens are more likely to be under balancing selection. For epidemic pathogens, the direction and magnitude of allele frequency changes over time are important parameters to measure, as well as the frequency distributions of alleles in different populations at one time. If the replacement of antigen types is measurable over contemporary or recent historical time, phylogenetic analyses of the evolution of the antigen genes may be structured in relation to known epidemiological or infection events (Zhu et al. 2001). In these cases, such analyses can yield more efficient information than gene frequency based analyses, as more information can potentially be derived from a given amount of sequence information (Zanotto et al. 1999; Nielsen, 2001).
PHYLOGENETIC CONSIDERATIONS
A general method for detecting selection in phylogenies involves a maximum likelihood approach, using codon-based models of nucleotide substitution (reviewed by Yang & Bielawski, 2000). This can account for different nucleotide transition/transversion ratios and codon bias when calculating the number of potential synonymous and nonsynonymous sites in the data set. The models operate at the level of instantaneous changes between codons which are identified from phylogenetic trees representing the various sequences in the data set. Thus the analytical models can allow for variable selection intensities amongst codon sites, where not all sites in the sequence will have the same dN/dS ratio. This is important as many codons in a sequence are likely to be under negative or purifying selection (where mutations are deleterious and selected against) and thus have a dN/dS ratio of less than 1, and the method is therefore capable of detecting sites under positive selection even against this background of negative selection operating at other sites within the gene. In contrast, other methods which calculate dN/dS give an average ratio for all sites analysed and so are more greatly influenced by negative selection.
The maximum likelihood approach applies a series of models to the data set including models which incorporate selection, and assigns a likelihood value to each model allowing comparison between models. This maximum likelihood approach has been used to test for positive selection in several pathogen genes (Table 5). A problem arises where recombination is evident in a data set, as no single branching phylogeny will be accurate for all polymorphic sites (a net-like structure would best show the relationship between gene sequences). There is some indication that the method is not greatly affected by different possible alternative tree morphologies (Yang et al. 2000), but the use of any single phylogeny in these cases will cause some individual sites to be oversampled, as they will appear on more than one branch due to recombination. Care must be taken therefore to assess the level of recombination in a data set before applying this or other phylogenetic analyses and interpreting their outcome.

Where high levels of recombination exist, making the formation of an accurate intra-specific phylogeny impossible, an ad hoc method which includes information on codon bias but not on phylogenetic structure may be attempted (Yang & Nielsen, 2000). This is less powerful than the phylogenetic approach, as it assigns an overall dN/dS value which is the average across all sites and will therefore be affected by a background of negative selection. However, this retains the discriminatory feature of rejecting dN/dS ratios of >1 which are the result of codon bias rather than positive selection. For parasites such as P. falciparum (very high A/T content) and Toxoplasma gondii (very high G/C content) this may prove a useful approach.
It is relevant to note that many pathogens have probably become common in human populations quite recently, and contain only a very low overall level of nucleotide variation today. These include viral (Zanotto et al. 1996), bacterial (Sreevatsan et al. 1997; Achtman et al. 1999), and protozoan (Rich et al. 1998; Conway et al. 2000b; Volkman et al. 2001) examples. Some diseases caused by these pathogens have been known for hundreds or thousands of years, so they are not necessarily recent in an epidemiological or historic sense. However, an origin in the order of tens of thousands of years ago is still evolutionarily recent and can have an impact on current population structure and the choice of tests for selection, but is not likely to be a general disadvantage. Expanding populations tend to have an excess of rare new alleles and fewer at intermediate frequencies compared to older populations at mutation-drift equilibrium (Li, 1997). This will cause an opposite effect on nucleotide frequency distributions to that caused by balancing selection, so frequency-based tests such as Tajima's (Tajima, 1989) will be conservative (i.e. a positive inference of balancing selection is likely to be robust). Intra-specific phylogenies will be shallow, but otherwise will be as robust (or non-robust depending on the amount of recombination) as in older species. Moreover, a low background of nucleotide diversity means that broadly surveying genomes for regions of high diversity could be a useful screening procedure, allowing particular loci to be chosen for further work. The evaluation of extensive or intensive means of identifying pathogen loci under immune selection is an ongoing priority for infectious disease research.
References
ACHTMAN, M., ZURTH, K., MORELLI, G., TORREA, G., GUIYOULE, A. & CARNIEL, E. (1999). Yersinia pestis, the cause of plague, is a recently emerged clone of Yersinia pseudotuberculosis. Proceedings of The National Academy of Sciences, USA 96, 14043–14048.CrossRefGoogle Scholar
AIDOO, M., LALVANI, A., ALLSOPP, C. E. M., PLEBANSKI, M., MEISNER, S. J., KRAUSA, P., BROWNING, M., MORRISJONES, S., GOTCH, F., FIDOCK, D. A., TAKIGUCHI, M., ROBSON, K. J. H., GREENWOOD, B. M., DRUILHE, P., WHITTLE, H. C. & HILL, A. V. S. (1995). Identification of conserved antigenic components for a cytotoxic T lymphocyte-inducing vaccine against malaria. Lancet 345, 1003–1007.CrossRefGoogle Scholar
ALLEN, T. M., O'CONNOR, D. H., JING, P., DZURIS, J. L., MOTHE, B. R., VOGEL, T. U., DUNPHY, E. & LLEBL, M. E. ETAL. (2000). Tat-specific cytotoxic T lymphocytes select for SIV escape variants during resolution of primary viraemia. Nature 407, 386–390.Google Scholar
ALLRED, D. R., CARLTON, J. M. R., SATCHER, R. L., LONG, J. A., BROWN, W. C., PATTERSON, P. E., O'CONNOR, R. M. & STROUP, S. E. (2000). The ves multigene family of B. bovis encodes components of rapid antigenic variation at the infected erythrocyte surface. Molecular Cell 5, 153–162.Google Scholar
ANDERSON, T. J. C. & DAY, K. P. (2000). Geographical structure and sequence evolution as inferred from the Plasmodium falciparum S-antigen locus. Molecular and Biochemical Parasitology 106, 321–326.CrossRefGoogle Scholar
BABIKER, H. A., SATTI, G. & WALLIKER, D. (1995). Genetic changes in the population of Plasmodium falciparum in a Sudanese village over a three year period. American Journal of Tropical Medicine and Hygiene 53, 7–15.CrossRefGoogle Scholar
BINKS, R. H., BAUM, J., ODUOLA, A. M. J., ARNOT, D. E., BABIKER, H. A., KREMSNER, P. G., ROPER, C., GREENWOOD, B. M. & CONWAY, D. J. (2001). Population genetic analysis of the Plasmodium falciparum erythrocyte binding antigen-175 (eba-175) gene. Molecular and Biochemical Parasitology 114, 63–70.CrossRefGoogle Scholar
BOJANG, K. A., MILLIGAN, P. J. M., PINDER, M., VIGNERON, L., ALLOUECHE, A., KESTER, K. E., BALLOU, W. R., CONWAY, D. J., REECE, W. H. H., GOTHARD, P., YAMUAH, L., DELCHAMBRE, M., VOSS, G., GREENWOOD, B. M., HILL, A., MCADAM, K. P. W. J., TORNIEPORTH, N., COHEN, J. D. & DOHERTY, T. (2001). Efficacy of RTS,S/AS02 malaria vaccine against Plasmodium falciparum infection in semi-immune adult men in The Gambia: a randomised trial. Lancet 358, 1927–1934.CrossRefGoogle Scholar
BORST, P. & ULBERT, S. (2001). Control of VSG expression sites. Molecular and Biochemical Parasitology 114, 17–27.CrossRefGoogle Scholar
BRAYTON, K. A., KNOWLES, D. P., MCGUIRE, T. C. & PALMER, G. H. (2001). Efficient use of a small genome to generate antigenic diversity in tick-borne ehrlichial pathogens. Proceedings of the National Academy of Sciences, USA 98, 4130–4135.CrossRefGoogle Scholar
BUCCI, K., KASTENS, W., HOLLINGDALE, M. R., SHANKAR, A., ALPERS, M. P., KING, C. L. & KAZURA, J. W. (2000). Influence of age and HLA type on interferon-gamma (IFN-gamma) responses to a naturally occurring polymorphic epitope of Plasmodium falciparum liver stage antigen-1 (LSA-1). Clinical and Experimental Immunology 122, 94–100.CrossRefGoogle Scholar
CONWAY, D. J. (1997). Natural selection on polymorphic malaria antigens and the search for a vaccine. Parasitology Today 13, 26–29.CrossRefGoogle Scholar
CONWAY, D. J., CAVANAGH, D. R., TANABE, K., ROPER, C., MIKES, Z. S., SAKIHAMA, N., BOJANG, K. A., ODUOLA, A. M. J., KREMSNER, P. G., ARNOT, D. E., GREENWOOD, B. M. & MCBRIDE, J. S. (2000a). A principal target of human immunity to malaria identified by molecular population genetic and immunological analyses. Nature Medicine 6, 689–692.Google Scholar
CONWAY, D. J., FANELLO, C., LLOYD, J. M., AL-JOUBORI, B. M. A.-S., BALOCH, A. H., SOMANATH, S. D., ROPER, C., ODUOLA, A. M. J., MULDER, B., POVOA, M. M., SINGH, B. & THOMAS, A. W. (2000b). Origin of Plasmodium falciparum malaria is traced by mitochondrial DNA. Molecular and Biochemical Parasitology 111, 163–171.Google Scholar
CONWAY, D. J., GREENWOOD, B. M. & MCBRIDE, J. S. (1992). Longitudinal study of Plasmodium falciparum polymorphic antigens in a malaria endemic population. Infection and Immunity 60, 1122–1127.Google Scholar
CONWAY, D. J., MACHADO, R. L. D., SINGH, B., DESSERT, P., MIKES, Z. S., POVOA, M. M., ODUOLA, A. M. J. & ROPER, C. (2001). Extreme geographical fixation of variation in the Plasmodium falciparum gamete surface protein gene Pfs48/45 compared with microsatellite loci. Molecular and Biochemical Parasitology 115, 145–156.CrossRefGoogle Scholar
DRAKELEY, C. J., DURAISINGH, M. T., POVOA, M., CONWAY, D. J., TARGETT, G. A. T. & BAKER, D. A. (1996). Geographical distribution of a variant epitope of Pfs48/45, a Plasmodium falciparum transmission-blocking vaccine candidate. Molecular and Biochemical Parasitology 81, 253–257.CrossRefGoogle Scholar
ESCALANTE, A. A., LAL, A. A. & AYALA, F. J. (1998). Genetic polymorphism and natural selection in the malaria parasite Plasmodium falciparum. Genetics 149, 189–202.Google Scholar
EVANS, D. T., O'CONNOR, D. H., JING, P., DZURIS, J. L., SIDNEY, J., DA SILVA, J., ALLEN, T. M., HORTON, H., VENHAM, J. E., RUDERSDORF, R. A., VOGEL, T., PAUZA, C. D., BONTROP, R. E., DEMARS, R., SETTE, A., HUGHES, A. L. & WATKINS, D. I. (1999). Virus-specific cytotoxic T lymphocyte responses select for amino-acid variation in simian immunodeficiency virus Env and Nef. Nature Medicine 5, 1270–1276.CrossRefGoogle Scholar
FAYER, R., MORGAN, U. & UPTON, S. J. (2000). Epidemiology of Cryptosporidium: transmission, detection, and identification. International Journal for Parasitology 30, 1305–1322.CrossRefGoogle Scholar
FELGER, I., MARSHALL, V. M., REEDER, J. C., HUNT, J. A., MGONE, C. S. & BECK, H.-P. (1997). Sequence diversity and molecular evolution of the merozoite surface antigen 2 of Plasmodium falciparum. Journal of Molecular Evolution 45, 154–160.CrossRefGoogle Scholar
FERREIRA, M. U., LIU, Q., ZHOU, M., KIMURA, M., KANEKO, O., VAN THIEN, H., ISOMURA, S., TANABE, K. & KAWAMOTO, F. (1998). Stable patterns of allelic diversity at the merozoite surface protein-1 locus of Plasmodium falciparum in clinical isolates from southern Vietnam. Journal of Eukaryotic Microbiology 45, 131–136.CrossRefGoogle Scholar
FIDOCK, D. A., GRAS-MASSE, H., LEPERS, J. P., BRAHIMI, K., BENMOHAMED, L., MELLOUK, S., GUERIN-MARCHAND, C., LONDONO, A., RAHARIMALALA, L., MEIS, J. F., LANGSLEY, G., ROUSSILHON, C., TARTAR, A. & DRUILHE, P. (1994). Plasmodium falciparum liver stage antigen-1 is well conserved and contains potent B and T cell determinants. Journal of Immunology 153, 190–204.Google Scholar
FU, Y.-X. & LI, W.-H. (1993). Statistical tests of neutrality of mutations. Genetics 133, 693–709.Google Scholar
FUDYK, T. C., MACLEAN, I. W., SIMONSEN, J. N., NJAGI, E. N., KIMANI, J., BRUNHAM, R. C. & PLUMMER, F. A. (1999). Genetic diversity and mosaicism at the por locus of Neisseria gonorrhoeae. Journal of Bacteriology 181, 5591–5599.Google Scholar
GILBERT, S. C., PLEBANSKI, M., GUPTA, S., MORRIS, J., COX, M., AIDOO, M., KWIATKOWSKI, D., GREENWOOD, B. M., WHITTLE, H. C. & HILL, A. V. S. (1998). Association of malaria parasite population structure, HLA, and immunological antagonism. Science 279, 1173–1177.CrossRefGoogle Scholar
GOULDER, P. J. R., BRANDER, C., TANG, Y., TREMBLAY, C., COLBERT, R. A., ADOO, M. M., ROSENBERG, E. S., NGUYEN, T., ALLEN, R., TROCHA, A., ALTFELD, M., HE, S. Q., BUNCE, M., FUNKHOUSER, R., PELTON, S. I., BURCHETT, S. K., MCINTOSH, K., KORBER, B. T. M. & WALKER, B. D. (2001). Evolution and transmission of stable CTL escape mutations in HIV infection. Nature 412, 334–338.CrossRefGoogle Scholar
GUBBELS, M.-J, KATZER, F., HIDE, G., JONGEJAN, F. & SHIELS, B. R. (2000). Generation of a mosaic pattern of diversity in the major merozoite-piroplasm surface antigen of Theileria annulata. Molecular and Biochemical Parasitology 110, 23–32.CrossRefGoogle Scholar
HALL, R., HYDE, J. E., GOMAN, M., SIMMONS, D. L., HOPE, I. A., MACKAY, M., SCAIFE, J., MERKLI, B., RICHLE, R. & STOCKER, J. (1984). Major surface antigen gene of a human malaria parasite cloned and expressed in bacteria. Nature 311, 379–382.CrossRefGoogle Scholar
HAY, C. M., RUHL, D. J., BASGOZ, N. O., WILSON, C. C., BILLINGSLEY, J. M., DEPASQUALE, M. P., D'AQUILA, R. T., WOLINSKY, S. M., CRAWFORD, J. M., MONTEFIORI, D. C. & WALKER, B. D. (1999). Lack of viral escape and defective in vivo activation of human immunodeficiency virus type 1-specific cytotoxic T lymphocytes in rapidly progressive infection. Journal of Virology 73, 5509–5519.Google Scholar
HEHL, A. B., LEKUTIS, C., GRIGG, M. E., BRADLEY, P. J., DUBREMETZ, J.-F., ORTEGA-BARRIA, E. & BOOTHROYD, J. C. (2000). Toxoplasma gondii homologue of Plasmodium apical membrane antigen 1 is involved in invasion of host cells. Infection and Immunity 68, 7078–7076.CrossRefGoogle Scholar
HODDER, A. N., CREWTHER, P. E. & ANDERS, R. F. (2001). Specificity of the protective antibody response to apical membrane antigen 1. Infection and Immunity 69, 3286–3294.CrossRefGoogle Scholar
HOE,
N. P., NAKASHIMA, K.,
LUKOMSKI, S., GRIGSBY, D.,
LIU, M., KORDARI, P. &
DOU, S.-J. et al. (1999). Rapid selection of complement-inhibiting protein variants in group A Streptococcus epidemic waves. Nature Medicine 5, 924–929.CrossRefGoogle Scholar
HOFFMAN, E. H. E., DA SILVEIRA, L. A., TONHOSOLO, R., PEREIRA, F. J. T., RIBEIRO, W. L., TONON, A. P., KAWAMOTO, F. & FERREIRA, M. U. (2001). Geographical patterns of allelic diversity in the Plasmodium falciparum malaria vaccine candidate, merozoite surface protein-2. Annals of Tropical Medicine and Parasitology 95, 117–132.CrossRefGoogle Scholar
HUGHES, M. K. & HUGHES, A. L. (1995). Natural selection on Plasmodium surface proteins. Molecular and Biochemical Parasitology 71, 99–113.CrossRefGoogle Scholar
KAPLAN, E. L., WOTTON, J. T. & JOHNSON, D. R. (2001). Dynamic epidemiology of group A streptococcal serotypes associated with pharyngitis. Lancet 358, 1334–1337.CrossRefGoogle Scholar
KELLEHER, A. D., LONG, C., HOLMES, E. C., ALLEN, R. L., WILSON, J., CONLON, C., WORKMAN, C., SHAUNAK, S., OLSON, K., GOULDER, P., BRANDER, C., OGG, G., SULLIVAN, J. S., DYER, W., JONES, I., MCMICHAEL, A. J., ROWLAND-JONES, S. & PHILLIPS, R. E. (2001). Clustered mutations in HIV-1 gag are consistently required for escape from HLA-B27-restricted cytotoxic T lymphocyte responses. Journal of Experimental Medicine 193, 375–385.CrossRefGoogle Scholar
KIMURA, M. (1983). The Neutral Theory of Molecular Evolution. Cambridge, Cambridge University Press.CrossRef
KOCKEN, C. H. M., NARUM, D. L., MASSOUGBODJI, A., AYIVI, B., DUBBELD, M. A., VAN DER WEL, A., CONWAY, D. J., SANNI, A. & THOMAS, A. W. (2000). Molecular characterisation of Plasmodium reichenowi apical membrane antigen-1 (AMA-1), comparison with P. falciparum AMA-1, and antibody-mediated inhibition of red cell invasion. Molecular and Biochemical Parasitology 109, 147–156.Google Scholar
KREITMAN, M. (2000). Methods to detect selection in populations with application to the human. Annual Review of Genomics and Human Genetics 1, 539–559.CrossRefGoogle Scholar
KURTIS, J. D., HOLLINGDALE, M. R., LUTY, A. J. F., LANAR, D. E., KRZYCH, U. & DUFFY, P. E. (2001). Pre-erythrocytic immunity to Plasmodium falciparum: the case for an LSA-1 vaccine. Trends in Parasitology 17, 219–223.CrossRefGoogle Scholar
LI, W.-H. (1997). Molecular Evolution. Sunderland, Mass, Sinauer Associates, Inc.
MARTIENSSEN, R. A. & COLOT, V. (2001). DNA methylation and epigenetic inheritance in plants and filamentous fungi. Science 293, 1070–1074.CrossRefGoogle Scholar
MCCOLL, D. J. & ANDERS, R. F. (1997). Conservation of structural motifs and antigenic diversity in Plasmodium falciparum merozoite surface protein-3 (MSP-3). Molecular and Biochemical Parasitology 90, 21–31.CrossRefGoogle Scholar
MCDONALD, J. H. (1994). Detecting natural selection by comparing geographic variation in protein and DNA polymorphisms. In Non-Neutral Evolution: Theories and Molecular Data (ed. GOLDING, B.), pp. 88–100. Chapman & Hall, New York & London.CrossRef
MCDONALD, J. H. & KREITMAN, M. (1991). Adaptive protein evolution at the Adh locus in Drosophila. Nature 351, 652–654.CrossRefGoogle Scholar
MEHR, I. J., LONG, C. D., SERKIN, C. D. & SEIFERT, H. S. (2000). A homologue of the recombination-dependent growth gene, rdgC, is involved in gonococcal pilin antigenic variation. Genetics 154, 523–532.Google Scholar
MILLER, L. H., ROBERTS, T., SHAHABUDDIN, M. & MCCUTCHAN, T. F. (1993). Analysis of sequence diversity in the Plasmodium falciparum merozoite surface protein-1 (MSP-1). Molecular and Biochemical Parasitology 59, 1–14.CrossRefGoogle Scholar
NEI, M. & GOJOBORI, T. (1986). Simple methods for estimating the numbers of synonymous and nonsynonymous substitutions. Molecular Biology and Evolution 3, 418–426.Google Scholar
NIELSEN, R. (2001). Statistical tests of selective neutrality in the age of genomics. Heredity 86, 641–647.CrossRefGoogle Scholar
O'DONNELL, R., DE KONING-WARD, T. F., BURT, R. A., BOCKAIRE, M., REEDER, J. C., COWMAN, A. F. & CRABB, B. S. (2001). Antibodies against merozoite surface protein (MSP)-1 19 are a major component of the invasion-inhibitory response in individuals immune to malaria. Journal of Experimental Medicine 193, 1403–1412.CrossRefGoogle Scholar
OKENU, D. M. N., THOMAS, A. W. & CONWAY, D. J. (2000). Allelic lineages of the merozoite surface protein 3 (msp3) gene in Plasmodium reichenowi and Plasmodium falciparum. Molecular and Biochemical Parasitology 109, 185–188.CrossRefGoogle Scholar
OYOK, T., ODONGA, C., MULWANI, E., ABUR, J., KADUCU, F., AKECH, M., OLANGO, J. & ONEK, P. ET AL. (2001). Outbreak of Ebola Hemorrhagic Fever – Uganda, August 2000–January 2001. Journal of the American Medical Association 285, 1010–1012.Google Scholar
OZWARA, H., KOCKEN, C. H. M., CONWAY, D. J., MWENDA, J. M. & THOMAS, A. W. (2001). Comparative analysis of Plasmodium reichenowi and P. falciparum erythrocyte-binding proteins reveals selection to maintain polymorphism in the erythrocyte-binding region of EBA-175. Molecular and Biochemical Parasitology 116, 81–84.Google Scholar
PARKHILL, J., WREN, B. W., MUNGALL, K., KETLEY, J. M., CHURCHER, C., BASHAM, D., CHILLINGWORTH, T., DAVIES, R. M., FELTWELL, T., HOLROYD, S., JAGELS, K., KARLYSHEV, A. V., MOULE, S., PALLEN, M. J., PENN, C. W., QUAIL, M. A., RAJANDREAM, M. A., RUTHERFORD, K. M., VAN VLIET, A. H. M., WHITEHEAD, S. & BARRELL, B. G. (2000). The genome sequence of the food borne pathogen Campylobacter jejuni reveals hypervariable sequences. Nature 403, 665–668.CrossRefGoogle Scholar
PATINO, J. A., HOLDER, A. A., MCBRIDE, J. S. & BLACKMAN, M. J. (1997). Antibodies that inhibit malaria merozoite surface protein-1 processing and erythrocyte invasion are blocked by naturally acquired human antibodies. Journal of Experimental Medicine 186, 1689–1699.CrossRefGoogle Scholar
PLEBANSKI, M., LEE, E. A. M., HANNAN, C. M., FLANAGAN, K. L., GILBERT, S. C., GRAVENOR, M. B. & HILL, A. V. S. (1999). Altered peptide ligands narrow the repertoire of cellular immune responses by interfering with T-cell priming. Nature Medicine 5, 565–571.CrossRefGoogle Scholar
POLLEY, S. D. & CONWAY, D. J. (2001). Strong diversifying selection on domains of the Plasmodium falciparum Apical Membrane Antigen 1 gene. Genetics 158, 1505–1512.Google Scholar
PREISER, P. R., JARRA, W., CAPIOD, T. & SNOUNOU, G. (1999). A rhoptry-protein-associated mechanism of clonal phenotypic variation in rodent malaria. Nature 398, 618–622.CrossRefGoogle Scholar
RANNALA, B., QIU, W. G. & DYKHUIZEN, D. E. (2000). Methods for estimating gene frequencies and detecting selection in bacterial populations. Genetics 155, 499–508.Google Scholar
RICH, S. M., LICHT, M. C., HUDSON, R. R. & AYALA, F. J. (1998). Malaria's eve: Evidence of a recent population bottleneck throughout the world populations of Plasmodium falciparum. Proceedings of the National Academy of Sciences, USA 95, 4425–4430.CrossRefGoogle Scholar
SIDDIQUI, W. A., TAM, L. Q., KRAMER, K. J., HUI, G. S. N., CASE, S. E., YAMAGA, K. M., CHANG, S. P., CHAN, E. B. T. & KAN, S.-C. (1987). Merozoite surface coat precursor protein completely protects Aotus monkeys against Plasmodium falciparum malaria. Proceedings of the National Academy of Sciences, USA 84, 3014–3018.CrossRefGoogle Scholar
SILVA, N. S., SILVEIRA, L. A., MACHADO, R. L. D., POVOA, M. M. & FERREIRA, M. U. (2000). Temporal and spatial distribution of the variants of merozoite surface protein-1 (MSP-1) in Plasmodium falciparum populations in Brazil. Annals of Tropical Medicine and Parasitology 94, 675–688.CrossRefGoogle Scholar
SMITH, J. D., GAMAIN, B., BARUCH, D. I. & KYES, S. (2001). Decoding the language of var genes and Plasmodium falciparum sequestration. Trends in Parasitology 17, 538–545.CrossRefGoogle Scholar
SREEVATSAN, S., PAN, X., STOCKBAUER, K. E., CONNELL, N. D., KREISWIRTH, B. N., WHITTAM, T. S. & MUSSER, J. M. (1997). Restricted structural gene polymorphism in the Mycobacterium tuberculosis complex indicates evolutionarily recent global dissemination. Proceedings of the National Academy of Sciences, USA 94, 9869–9874.CrossRefGoogle Scholar
STEPHENS, R. S. & LAMMEL, C. J. (2001). Chlamydia outer membrane protein discovery using genomics. Current Opinion in Microbiology 4, 16–20.CrossRefGoogle Scholar
STOTHARD, D. R., BOGUSLAWSKI, G. & JONES, R. B. (1998). Phylogenetic analysis of the Chlamydia trachomatis major outer membrane protein and examination of potential pathogenic determinants. Infection and Immunity 66, 3618–3625.Google Scholar
STRINGER, J. R. & KEELY, S. P. (2001). Genetics of surface antigen expression in Pneumocystis carinii. Infection and Immunity 69, 627–639.CrossRefGoogle Scholar
SUAREZ, C. E., FLORIN-CHRISTENSEN, M., HINES, S. A., PALMER, G. H., BROWN, W. C. & MCELWAIN, T. F. (2000). Characterization of allelic variation in the Babesia bovis merozoite surface antigen 1 (MSA-1) locus and identification of a cross-reactive inhibition-sensitive MSA-1 epitope. Infection and Immunity 68, 6865–6870.CrossRefGoogle Scholar
TAJIMA, F. (1989). Statistical method for testing the neutral mutation hypothesis by DNA polymorphism. Genetics 123, 585–595.Google Scholar
TANABE, K., MACKAY, M., GOMAN, M. & SCAIFE, J. G. (1987). Allelic dimorphism in a surface antigen gene of the malaria parasite Plasmodium falciparum. Journal of Molecular Biology 195, 273–287.CrossRefGoogle Scholar
THEISEN, M., THOMAS, A. W. & JEPSEN, S. (2001). Cloning, nucleotide sequencing and analysis of the gene encoding the glutamate-rich protein (GLURP) from Plasmodium falciparum. Molecular and Biochemical Parasitology 115, 269–273.CrossRefGoogle Scholar
TSUCHIYA, E., SUGAWARA, K., HONGO, S., MATSUZAKI, Y., MURAKI, Y., LI, Z. N. & NAKAMURA, K. (2001). Antigenic structure of the haemagglutinin of human influenza A/H2N2 virus. Journal of General Virology 82, 2475–2484.CrossRefGoogle Scholar
VAN DIJK, M. R., JANSE, C. J., THOMPSON, J., WATERS, A. P., BRAKS, J. A. M., DODEMONT, H. J., STUNNENBERG, H. G., VAN GEMERT, G.-J., SAUERWEIN, R. W. & ELING, W. (2001). A central role for P48/45 in malaria parasite male gamete fertility. Cell 104, 153–164.CrossRefGoogle Scholar
VERRA, F. & HUGHES, A. L. (1999). Evidence for ancient balanced polymorphism at the apical membrane antigen-1 (AMA-1) locus of Plasmodium falciparum. Molecular and Biochemical Parasitology 105, 149–153.Google Scholar
VIDAL, N., PEETERS, V. N., MULANGA-KABEYA, C., NZILAMBI, N., ROBERTSON, D., ILUNGA, W., SEMA, H., TSHIMANGA, K., BONGO, B. & DELAPORTE, E. (2000). Unprecedented degree of human immunodeficiency virus type 1 (HIV-1) group M genetic diversity in the Democratic Republic of Congo suggests that the HIV-1 pandemic originated in Central Africa. Journal of Virology 74, 10498–10507.CrossRefGoogle Scholar
VISESHAKUL, N., KAMPER, S., BOWIE, M. V. & BARBET, A. F. (2000). Sequence and expression analysis of a surface antigen gene family of the rickettsia Anaplasma marginale. Gene 253, 45–53.CrossRefGoogle Scholar
VOLKMAN, S. K., BARRY, A. E., LYONS, E. J., NIELSEN, K. M., THOMAS, S. M., CHOI, M., THAKORE, S. S., DAY, K. P., WIRTH, D. F. & HARTL, D. L. (2001). Recent origin of Plasmodium falciparum from a single progenitor. Science 293, 482–484.CrossRefGoogle Scholar
YANG, Z. & BIELAWSKI, J. P. (2000). Statistical methods for detecting molecular adaptation. Trends in Ecology and Evolution 15, 496–503.CrossRefGoogle Scholar
YANG, Z. & NIELSEN, R. (2000). Estimating synonymous and nonsynonymous substitution rates under realistic evolutionary models. Molecular Biology and Evolution 17, 32–43.CrossRefGoogle Scholar
YANG, Z., NIELSEN, R., GOLDMAN, N. & PEDERSEN, A.-M. K. (2000). Codon-substitution models for heterogeneous selection pressure at amino acid sites. Genetics 155, 431–449.Google Scholar
ZANOTTO, P. M. D., GOULD, E. A., GAO, G. F., HARVEY, P. H. & HOLMES, E. C. (1996). Population dynamics of flaviviruses revealed by molecular phylogenies. Proceedings of the National Academy of Sciences, USA 93, 548–553.CrossRefGoogle Scholar
ZANOTTO, P. M. D., KALLAS, E. G., DE SOUZA, R. F. & HOLMES, E. C. (1999). Genealogical evidence for positive selection in the nef gene of HIV-1. Genetics 153, 1077–1089.Google Scholar
ZEVERING, Y., KHAMBOONRUANG, C. & GOOD, M. F. (1994). Natural amino acid polymorphisms of the circumsporozoite protein of Plasmodium falciparum abrogate specific human CD4+ T cell responsiveness. European Journal of Immunology 24, 1418–1425.CrossRefGoogle Scholar
ZHANG, J.-R. & NORRIS, S. J. (1998). Kinetics and in vivo induction of genetic variation of vlsE in Borrelia burgdorferi. Infection and Immunity 66, 3689–3697.Google Scholar
ZHU, P., VAN DER ENDE, A., FALUSH, D., BRIESKE, N., MORELLI, G., LINZ, B., POPOVIC, T., SCHUURMAN, I. G. A., ADEGBOLA, R. A., ZURTH, K., GAGNEUX, S., PLATONOV, A. E., RIOU, J. Y., CAUGANT, D. A., NICOLAS, P. & ACHTMAN, M. (2001). Fit genotypes and escape variants of subgroup III Neisseria meningitidis during three pandemics of epidemic meningitis. Proceedings of the National Academy of Sciences, USA 98, 5234–5239.CrossRefGoogle Scholar
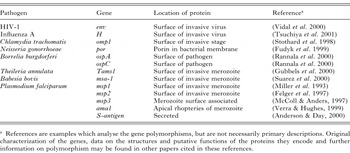
Table 1. Examples of highly polymorphic single-locus antigen genes in major pathogens of humans or domestic animals
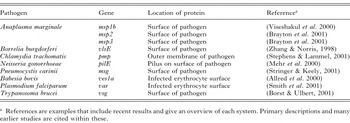
Table 2. Examples of multi-locus genes encoding variant antigens in major pathogens of humans or domestic animals
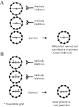
Fig. 1. A. Scheme of immune selection on a polymorphic pathogen surface antigen (3 different clones within a host). Allele-specific immune responses cause differential survival of the unrecognised genotype, and thus natural selection on heritable variation. B. Scheme of immune selection on transcriptionally-determined phenotypes of a variant pathogen surface antigen encoded by 3 variant genes (with 3 different phenotypes of one clone within a host). Variant-specific immune responses cause differential survival of the unrecognised phenotype, but this has an identical genotype to the other variants so there is no heritable change.
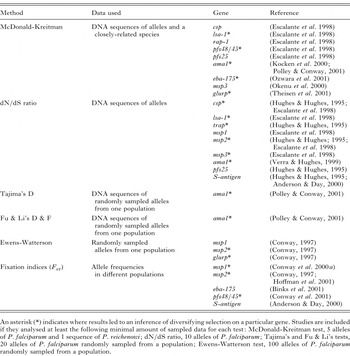
Table 3. Molecular population genetic studies testing for evidence of selection on P. falciparum polymorphic antigen genes
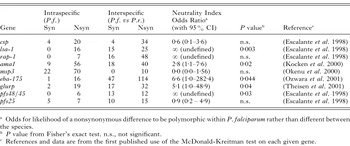
Table 4. Neutrality index and significance of the McDonald-Kreitman test for nucleotide polymorphism in P. falciparum antigen genes compared with divergence from their P. reichenowi homologues

Fig. 2. Scheme of two cases of positive diversifying selection within a species, with completely opposite causes. A. Balancing selection maintains allelic diversity within populations (for example due to frequency-dependent selection favouring rare types). B. Divergent selection in different populations leads to fixation of different alleles (adaptation of populations to different conditions). Note that broad sampling of genotypes from the species would yield similar diversity in each case. Structured sampling of different populations would be required to reveal the distribution of the alleles and the likely cause of selection.

Fig. 3. Scheme of Plasmodium falciparum ama1 with two sliding window tests of neutrality, using a sample of 51 alleles randomly taken from one population in Nigeria. A. Block scheme showing the major domains of the protein (Domain I–III together comprise the merozoite surface-accessible ‘ectodomain’ of the mature protein). B. Sliding window plots Tajima's D index (positive values indicate balancing selection, negative would indicate directional selection). C. Sliding window of Fu & Li's D and F indices (positive values indicate balancing selection, negative would indicate directional selection). Horizontal lines at the top of panels B and C show the positions of Domains I–III.
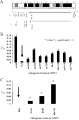
Fig. 4. A. Scheme of the P. falciparum msp1 gene (blocks with solid shading have the most, diagonal shading intermediate, and no shading the least amino acid polymorphisms; Tanabe et al. 1987). Below are (i) 10 polymorphic sites studied in 6 population samples from Africa, (ii) 4 polymorphic sites studied in 2 populations in Southeast Asia (Conway et al. 2000a). B. Summary of FST indices (the proportion of overall allelic variation which differs among populations) for the 10 polymorphic sites (intragenic loci) among the 6 populations in Africa. C. Summary of FST indices for the 4 polymorphic sites among the 2 populations in Southeast Asia. Asterisks show where FST values were significantly >0. Arrows indicate the particular site in the gene (block 2, abbreviated to bk2) with the lowest FST index in both continental analyses (i.e. at which most of the overall diversity is also represented within each local population).

Fig. 5. Associations of anti-MSP1 block 2 antibodies with protection from clinical malaria in a longitudinal cohort study of Gambian children (data from Conway et al. 2000a). Reactivity of IgG in serum from 337 Gambian children in June (prior to the malaria transmission season) was tested for positivity by ELISA against a panel of 9 recombinant proteins representing block 2 sequences which fall into 3 major types (K1-like, MAD-like, and RO33-like; these have local allele frequencies in The Gambia of 0.51, 0.33 and 0.16, respectively). This positivity was tested for association with the subsequent experience of clinical malaria in these children from July–November (throughout the transmission season). A relative risk of <1 indicates where antibody reactivity is associated with a reduced risk of malaria (asterisks show where this is statistically significant).
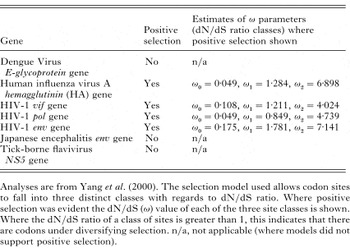
Table 5. Pathogen genes studied by Phylogenetic Analysis using Maximum Likelihood (PAML) to look for evidence of positive selection
 You have
Access
- 35
- Cited by