


1. Introduction
The finance-inequality nexus has attracted considerable attention amid a recent global rise in income inequality (Alvaredo et al. Reference Alvaredo, Chancel, Piketty, Saez and Zucman2018). In principle, financial development may reduce inequality by lowering informational asymmetries and financial constraints, expanding access to savings and investment opportunities, and fostering risk sharing (Claessens and Perotti Reference Claessens and Perotti2007; Demirgüç-Kunt and Levine Reference Demirgüç-Kunt and Levine2009). By strengthening capital allocation, investment oversight, and risk diversification, it can also stabilize economic cycles and reduce macroeconomic volatility. Whether financial development actually reduces inequality in practice, however, is far from settled. Other theoretical and empirical work finds that finance can widen disparities rather than narrow them, with the net effect depending on the stage of development and on the inclusiveness of access (Greenwood and Jovanovic Reference Greenwood and Jovanovic1990; Jaumotte et al. Reference Jaumotte, Lall and Papageorgiou2013; de Haan and Sturm Reference de Haan and Sturm2017). These conflicting findings motivate our study.
We revisit the finance-inequality relationship by exploring the moderating role of economic literacy, a mechanism that has received little attention. Previous studies focus largely on how the extent of financial development affects inequality (Clarke et al. Reference Clarke, Xu and Zou2006; Beck et al. Reference Beck, Demirgüç-Kunt and Levine2007; Jaumotte et al. Reference Jaumotte, Lall and Papageorgiou2013; de Haan and Sturm Reference de Haan and Sturm2017; Thornton and Di Tommaso Reference Thornton and Di Tommaso2020). We ask instead whether the distributional consequences of finance depend on the population’s ability to understand and use financial services effectively (Lusardi and Mitchell Reference Lusardi and Mitchell2007, Reference Lusardi and Mitchell2014; Lo Prete Reference Lo Prete2013, Reference Lo Prete2018). Economic literacy, the ability to grasp fundamental economic principles, make sound financial decisions, and understand how a modern economy functions, may determine whether financial development broadens inclusion or amplifies existing disparities (Grohmann et al. Reference Grohmann, Klühs and Menkhoff2018; Lusardi and Streeter Reference Lusardi and Streeter2023). Where literacy is high, individuals can participate more fully and effectively in financial markets, dampening the inequality-enhancing effects of financial development; where it is low, inclusive access is harder to achieve, and the advantages of already financially sophisticated groups are magnified (Klapper et al. Reference Klapper, Lusardi and Panos2013; Jappelli Reference Jappelli2010). The problem, however, is not only one of access. Perceived and actual literacy often diverge, so that many financial decisions are guided by confidence rather than genuine understanding (Anderson et al. Reference Anderson, Baker and Robinson2017), and lower literacy paired with misplaced confidence is associated with more severe financial hardship for the households least able to absorb it (Bourova et al. Reference Bourova, Anderson, Ramsay and Ali2018). Economic literacy thus acts as a conditioning factor, shaping how financial development translates into distributional outcomes.
We build on Lo Prete (Reference Lo Prete2013, Reference Lo Prete2018), the first to study economic literacy and the finance-inequality relationship at the macroeconomic level. Lo Prete’s (Reference Lo Prete2013, Reference Lo Prete2018) studies establish that more economically literate populations exhibit lower inequality and that the direct finance-inequality association weakens once economic literacy is taken into account. A test of whether economic literacy alters the effect of finance on inequality, however, shows no evidence that it does. Our analysis reaches a different conclusion. Using annual data and an identification strategy suited to a moderator that varies little within countries, we find that financial development increases inequality where economic literacy is low, and this effect weakens as economic literacy rises.
We measure economic literacy using two metrics of different construction: the survey-based IMD economic literacy index and the objectively constructed Financial Knowledge Index of Oliver-Márquez et al. (Reference Oliver-Márquez, Guarnido-Rueda and Amate-Fortes2021), built from macroeconomic indicators. We measure financial development with the multidimensional Financial Development Index of Svirydzenka (Reference Svirydzenka2016), which captures the depth, access, and efficiency of financial systems. The moderating effect of economic literacy is negative, significant, and robust across both measures, indicating that the result does not depend on how economic literacy is measured. This moderating role is one that Oliver-Márquez et al. (Reference Oliver-Márquez, Guarnido-Rueda, Amate-Fortes and Martínez-Navarro2022), who link financial knowledge to inequality, do not examine. Estimation is by System GMM (Arellano and Bover Reference Arellano and Bover1995; Blundell and Bond Reference Blundell and Bond1998), which addresses the endogeneity of financial development through internal instruments.
We test this hypothesis on a panel of forty-eight countries over 1995–2008, with income inequality measured by the post-tax Gini from the Standardized World Income Inequality Database (Solt Reference Solt2020). That financial development is positively associated with inequality, once its endogeneity is addressed, is consistent with theories in which the early gains from finance accrue to those already integrated into the financial system (Greenwood and Jovanovic Reference Greenwood and Jovanovic1990; de Haan and Sturm Reference de Haan and Sturm2017), and with the most recent objective-measure evidence on finance and inequality (Oliver-Márquez et al. Reference Oliver-Márquez, Guarnido-Rueda, Amate-Fortes and Martínez-Navarro2022). At low levels of economic literacy, financial development raises inequality; as literacy rises, the effect weakens, and at sufficiently high levels, it may become negligible. The result holds under an alternative measure of financial development, a reduced instrument set, and controls for institutional quality.
These results carry a clear policy implication. The distributional effect of financial development is not fixed; it depends on whether a population can engage effectively with the financial system. Because the inequality-enhancing effect of finance is weaker where economic literacy is higher, economic literacy is a lever policymakers can act on directly, in contrast to the slower-moving structural features of financial systems. Treating economic literacy as a complement to financial sector development, rather than relying on financial deepening alone, can help ensure that the gains from finance are more broadly shared rather than concentrated among those already equipped to benefit.
The remainder of the paper proceeds as follows. Section 2 reviews representative theoretical and empirical literature on financial development, inequality, and economic literacy. Section 3 presents the data and methodology. Section 4 reports the results and robustness checks. Section 5 concludes.
2. Related literature
2.1 Theory on finance and inequality
The theoretical literature offers mixed predictions about the distributional role of finance, in part because finance, inequality, and growth are jointly determined. One strand studies how inequality shapes growth and how financial development conditions that link. Galor and Moav (Reference Galor and Moav2004) show that the inequality-growth relationship evolves over the course of development: in early stages, inequality supports growth by channeling resources into physical capital accumulation, whereas as human capital becomes the primary driver of growth, greater equality fosters development by facilitating human capital investment; as financial development relaxes credit constraints, the role of inequality in driving growth weakens.
Braun et al. (Reference Braun, Parro and Valenzuela2019) find that inequality hinders growth in countries with underdeveloped financial markets, where poor individuals lack the resources for productive investment, while easier access to credit offsets this effect in more financially developed economies. These results bear on the distributional question indirectly, through the finance-conditioned inequality-growth nexus. A second strand speaks to it directly: Greenwood and Jovanovic (Reference Greenwood and Jovanovic1990) predict an inverted-U relationship, in which early financial development disproportionately benefits already-connected individuals and raises inequality, but as financial systems deepen and access broadens, inequality eventually declines.
2.2 Empirical evidence on finance and inequality
Empirical studies also yield diverse findings. Clarke et al. (Reference Clarke, Xu and Zou2006) report that inequality decreases as the financial sector expands, once endogeneity is addressed. Beck et al. (Reference Beck, Demirgüç-Kunt and Levine2007) find that financial development slows the growth of the Gini coefficient and raises incomes of the poorest quintile, so that policies shaping formal finance can reduce inequality of opportunity while enhancing efficiency (Demirgüç-Kunt and Levine Reference Demirgüç-Kunt and Levine2009). In contrast, financial deregulation in advanced economies has often been associated with rising inequality, with gains concentrated among top earners (Jaumotte et al. Reference Jaumotte, Lall and Papageorgiou2013), and de Haan and Sturm (Reference de Haan and Sturm2017) show that financial development can exacerbate inequality depending on political, though not necessarily economic, institutional quality. Our direct-effect estimate aligns with this latter strand. Overall, while financial deepening tends to support growth (Levine et al. Reference Levine, Loayza and Beck2000; Demirgüç-Kunt et al. Reference Demirgüç-Kunt, Klapper, Singer, Ansar and Hess2020), its distributional consequences are context-specific and far from uniform.
The literature also emphasizes the importance of measurement. Since the 1970s, most empirical research has relied on indicators such as the ratio of private credit to GDP or the ratio of stock market capitalization to GDP. Rajan and Zingales (Reference Rajan and Zingales1998) show that higher levels of these indicators are associated with faster economic growth, while Arcand et al. (Reference Arcand, Berkes and Panizza2015) argue that beyond a threshold, further credit expansion ceases to benefit growth. Dabla-Norris and Srivisal (Reference Dabla-Norris and Srivisal2013) demonstrate that financial development reduces macroeconomic volatility in output, consumption, and investment, though the stabilizing effect weakens beyond a certain point. Consequently, multidimensional measures such as the Svirydzenka (Reference Svirydzenka2016) index, which incorporates depth, access, and efficiency, are now preferred to capture the complex role of financial systems. Using this composite index, Thornton and Di Tommaso (Reference Thornton and Di Tommaso2020) find that financial development reduces inequality in the long run across income groups, with the effect strongest in high-income countries.
2.3 Economic literacy and distributional outcomes
An emerging body of research identifies economic literacy as a determinant of both financial inclusion and inequality. Access to finance is often unequal, limited by fixed transaction costs, entry restrictions, and political influence favoring the wealthy (Claessens and Perotti Reference Claessens and Perotti2007). Economic literacy works against these barriers: a more literate population navigates financial markets more effectively, which lowers the cost of participation and improves the use of financial services (Grohmann et al. Reference Grohmann, Klühs and Menkhoff2018).
Economic literacy also shapes wealth accumulation and resilience, and the gaps it leaves are unevenly distributed. Lusardi and Mitchell (Reference Lusardi and Mitchell2007, Reference Lusardi and Mitchell2014) show that literacy and financial planning are strongly associated with higher retirement wealth, yet low-income, less-educated, Black, and Hispanic households consistently display lower literacy and greater vulnerability. Fornero and Monticone (Reference Fornero and Monticone2011) likewise link financial knowledge to retirement behavior, and Clark et al. (Reference Clark, Lusardi and Mitchell2024) find that greater financial resilience – the capacity to plan, manage debt, and absorb shocks – leads to better economic outcomes, with financial literacy among its correlates.
These gaps widen inequality most when households are exposed to risk. During market volatility, less financially sophisticated investors are the most exposed (Klapper et al. Reference Klapper, Lusardi and Panos2013), and low literacy limits stock-market participation and worsens portfolio outcomes among low-wealth households (van Rooij et al. Reference van Rooij, Lusardi and Alessie2011). The burden falls hardest where literacy is low and financial products are complex, particularly under high inflation (Lusardi and Streeter Reference Lusardi and Streeter2023).
This exposure is compounded by behavioral factors. Biases and limited attention distort financial decisions when understanding is thin, and perceived literacy often outruns actual literacy; low literacy paired with overconfidence, rather than low literacy alone, is what leaves households least able to avoid the most serious consequences of default (Bourova et al. Reference Bourova, Anderson, Ramsay and Ali2018), with misperceived literacy shaping financial decisions more broadly (Anderson et al. Reference Anderson, Baker and Robinson2017). Consumer-protection and disclosure frameworks have developed alongside literacy as complementary safeguards (Lefevre and Chapman Reference Lefevre and Chapman2017), and both the underlying biases and the need for such safeguards bear most on less financially sophisticated households. Even the gaps themselves have cultural roots, as Davoli and Rodríguez-Planas (Reference Davoli and Rodríguez-Planas2024) show for the gender gap in economic literacy, highlighting its distributional relevance.
Much of this evidence rests on individual surveys; studying economic literacy across countries instead requires comparable measures, which the literature has pursued along two lines. The first administers a common survey across countries. Atkinson and Messy (Reference Atkinson and Messy2012) develop the instrument adopted by the OECD and its International Network on Financial Education to measure adult financial literacy comparably. The survey-based IMD index we utilize belongs to this same tradition, though it differs in form: it records senior business leaders’ assessments of population-level literacy rather than surveying individuals about their own knowledge and behavior. The second constructs composite indices from country-level data following the OECD (2008) guidelines, the basis for much of the later macroeconomic measurement of financial literacy, including the Financial Knowledge Index that is the second of our two measures.
With comparable cross-country measures available, a macroeconomic literature on economic literacy and inequality emerged, to which our paper is most closely related through Lo Prete (Reference Lo Prete2013, Reference Lo Prete2018). Using a cross-section of 30 countries over 1980–2005, Lo Prete (Reference Lo Prete2013) finds that the link between finance and inequality weakens once economic literacy is taken into account and concludes that the inequality-reducing effect of finance operates through people’s ability to use financial instruments rather than through the size of the financial sector. Lo Prete (Reference Lo Prete2018) adds panel and instrumental-variable evidence and confirms that higher economic literacy is associated with lower inequality growth. The interaction between financial development and economic literacy, however, is not estimated as significant, which would suggest that economic literacy does not condition the effect of finance on inequality. In a related design, Seven (Reference Seven2022) interacts finance with cognitive skill (PISA scores) in a static panel and finds the marginal effect of finance declining as skill rises.
Separately, macroeconomic literature examines the aggregate consequences of financial literacy. Boikos et al. (Reference Boikos, Panagiotidis and Voucharas2026) find, on a panel of 61 countries, that higher financial literacy is associated with faster GDP per capita growth and mitigates the diminishing returns to financial deepening, while Oliver-Márquez et al. (Reference Oliver-Márquez, Guarnido-Rueda, Amate-Fortes and Martínez-Navarro2022) study financial knowledge and income inequality across 63 countries and report a negative, non-linear association. We bring these strands together, asking whether economic literacy conditions the effect of financial development on inequality once the interaction is identified on annual data within a dynamic panel.
3. Material and methods
3.1 Data
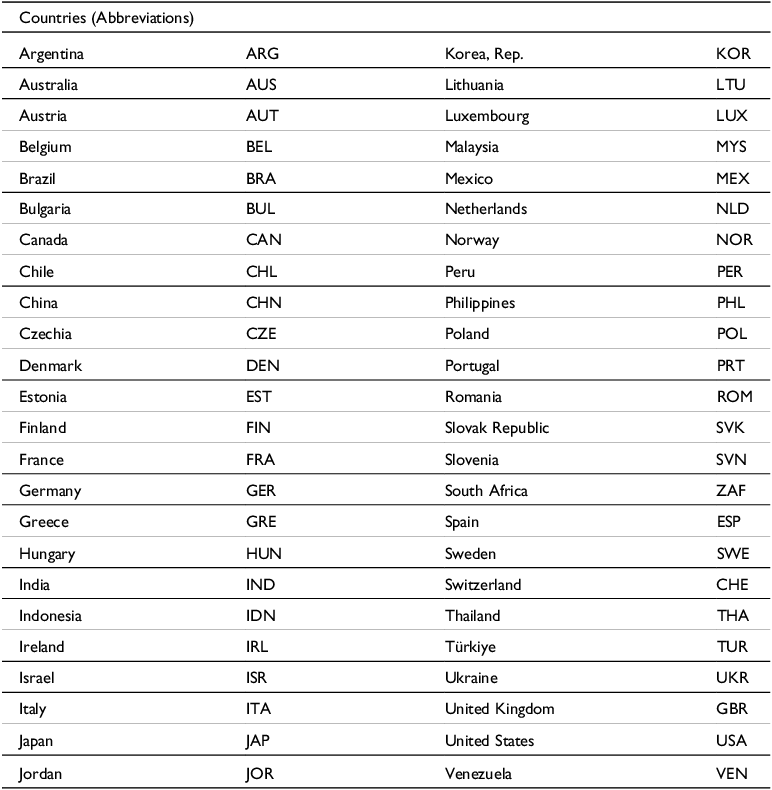
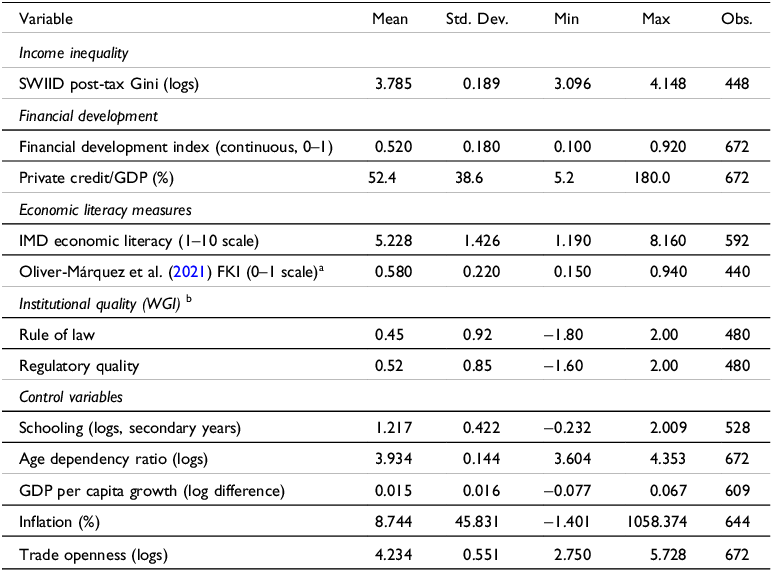
The dataset constructed for this paper includes data on the distribution of income, the level of financial development, and the degree of economic literacy. In addition, it incorporates information on macroeconomic conditions and demographic characteristics. Our sample consists of forty-eight (48) countries over the 1995–2008 period. The list of countries is reported in Table 1, and Table 2 reports descriptive statistics.
List of countries

Table 1. Long description
A table with two columns and forty-eight rows. The first column lists country names, and the second column lists their corresponding abbreviations. The countries and abbreviations are as follows: Argentina (ARG), Australia (AUS), Austria (AUT), Belgium (BEL), Brazil (BRA), Bulgaria (BUL), Canada (CAN), Chile (CHL), China (CHN), Czechia (CZE), Denmark (DEN), Estonia (EST), Finland (FIN), France (FRA), Germany (GER), Greece (GRE), Hungary (HUN), India (IND), Indonesia (IDN), Ireland (IRL), Israel (ISR), Italy (ITA), Japan (JAP), Jordan (JOR), Korea, Rep. (KOR), Lithuania (LTU), Luxembourg (LUX), Malaysia (MYS), Mexico (MEX), Netherlands (NLD), Norway (NOR), Peru (PER), Philippines (PHL), Poland (POL), Portugal (PRT), Romania (ROM), Slovak Republic (SVK), Slovenia (SVN), South Africa (ZAF), Spain (ESP), Sweden (SWE), Switzerland (CHE), Thailand (THA), Türkiye (TUR), Ukraine (UKR), United Kingdom (GBR), United States (USA), Venezuela (VEN).
Summary statistics (1995–2008, 48 countries)

Table 2. Long description
A table summarizing statistics for various variables across 48 countries from 1995 to 2008. The table has 12 rows and 6 columns. The columns are labeled Variable, Mean, Std. Dev., Min, Max, and Obs. The rows are grouped under different categories: Income inequality, Financial development, Economic literacy measures, Institutional quality, and Control variables. Each row lists a specific variable along with its mean, standard deviation, minimum, maximum, and number of observations. For example, the SWIID post-tax Gini (logs) has a mean of 3.785, a standard deviation of 0.189, a minimum of 3.096, a maximum of 4.148, and 448 observations. The table provides a comprehensive overview of the distribution of income, financial development, economic literacy, institutional quality, and various control variables across the specified countries and time period.
Notes: Summary statistics for 48 countries, 1995–2008. The SWIID post-tax Gini is the measure of income inequality. The continuous Financial Development Index (Svirydzenka Reference Svirydzenka2016, IMF) is the main measure of financial development; private credit/GDP is used as a robustness check. Sources: Gini measure from the Standardized World Income Inequality Database (Solt Reference Solt2020); FDI from IMF International Financial Statistics; private credit/GDP from the WB Global Financial Development Database; IMD Economic Literacy from the IMD World Competitiveness Yearbook; FKI is constructed from Oliver-Márquez et al. (Reference Oliver-Márquez, Guarnido-Rueda and Amate-Fortes2021); rule of law and regulatory quality from the WB Worldwide Governance Indicators; GDP growth, inflation, trade openness, age dependency from the WB World Development Indicators; Schooling from the Barro and Lee (Reference Barro and Lee2013) database, linearly interpolated from quinquennial to annual.
a The Financial Knowledge Index is constructed over the 44 countries and the 1999–2008 window used in our FKI specifications, a narrower country set and shorter span than the source study. The descriptive statistics reported here are specific to this sample and are not directly comparable to those in Oliver-Márquez et al. (Reference Oliver-Márquez, Guarnido-Rueda and Amate-Fortes2021).
b The Worldwide Governance Indicators are produced biennially before 2002 (1996, 1998, 2000) and annually thereafter (2002–2008); the intervening years (1997, 1999, 2001) are not interpolated, giving a maximum of 480 observations (48 × 10) for rule of law and regulatory quality.
Income inequality is commonly measured with the Gini coefficient, which captures the degree to which the distribution of income across individuals or households within an economy deviates from perfect equality. We measure income inequality using the post-tax Gini coefficient from the Standardized World Income Inequality Database (SWIID; Solt Reference Solt2020), which reconciles inequality estimates from different source datasets to make them comparable across countries and over time, while preserving information on source-specific uncertainty. Because it captures inequality in disposable household income, that is, income after direct taxes and public transfers, it is the appropriate dependent variable for assessing how financial development and economic literacy shape the distribution of realized economic resources. The Gini enters all specifications in natural logs.
By finance, we refer to the capacity of financial contracts, markets, and intermediaries to enable the screening of investment opportunities, monitor investments post-funding, and facilitate the pooling, trading, and management of risk. Much of the empirical literature on economic growth, inequality, and financial development has relied on single-dimensional indicators of financial depth, such as the private credit-to-GDP ratio or the stock market capitalization-to-GDP ratio (Rajan and Zingales Reference Rajan and Zingales1998; Beck et al. Reference Beck, Demirgüç-Kunt and Levine2007; Lo Prete Reference Lo Prete2013; Arcand et al. Reference Arcand, Berkes and Panizza2015). However, these conventional measures capture only part of financial development. As our main indicator, we therefore use the Financial Development Index (FDI) of Svirydzenka (Reference Svirydzenka2016), published through the International Financial Statistics (IFS) of the International Monetary Fund (IMF). The FDI takes values between 0 and 1 and aggregates three dimensions of financial systems: depth (the size and liquidity of the system), access (the ability of households and firms to use financial services), and efficiency (the ability of institutions to provide services at low cost with sustainable revenues, together with the activity level of capital markets). Each dimension is measured across both financial institutions (banks, insurance companies, and mutual funds) and financial markets (stock and bond markets). We use the FDI as a continuous variable, since the relationship between finance and inequality may be non-linear (Greenwood and Jovanovic Reference Greenwood and Jovanovic1990; Thornton and Di Tommaso Reference Thornton and Di Tommaso2020), and dichotomizing the index would discard informative variation. As a further robustness check, we re-estimate using the private credit-to-GDP ratio.
To capture economic-specific competencies, we use an economic literacy metric. Economic literacy is the ability to comprehend essential economic principles relevant to personal financial choices and to the functioning of a modern economy. Our measure is the economic literacy indicator from the IMD World Competitiveness Yearbook (WCY), which we refer to as the IMD economic literacy index. It draws on a survey of senior business leaders representing a cross-section of the national business community. Administered annually, the survey asks respondents to rate the statement “economic literacy among the population is generally high” on a 1–10 scale.
To verify that our results are not specific to the IMD measure, we also utilize the Financial Knowledge Index (FKI) of Oliver-Márquez et al. (Reference Oliver-Márquez, Guarnido-Rueda and Amate-Fortes2021). The FKI is methodologically independent in construction from the IMD index in three respects. First, it is built from objective macroeconomic and structural indicators – among them GDP per capita, tertiary graduation rates and mean years of schooling, portfolio-equity and insurance-company assets relative to GDP, internet usage, pension-fund assets, and an old-age population ratio – rather than from survey perceptions. Second, it follows the OECD (2008) Handbook on Constructing Composite Indicators, aggregating these indicators by a geometric mean with weights given by the inverse of each indicator’s standard deviation. Third, it combines four conceptually distinct sub-indices: economic capacity, educational training, use, and need. Lo Prete (Reference Lo Prete2013, Reference Lo Prete2018) measured economic literacy primarily with the IMD index; although Lo Prete (Reference Lo Prete2018) additionally checked robustness against several alternative competence proxies – education in finance, general schooling, PISA scores, and a time-varying version of the IMD literacy indicator – none of these is an objectively constructed macroeconomic composite of the kind the FKI provides. Re-estimating the moderating effect with the FKI therefore subjects it to a measure built on a fundamentally different methodology – objective macroeconomic and structural indicators aggregated under the OECD (2008) guidelines – rather than to a second perception-based index. The IMD index and the FKI are, to our knowledge, the only macro-level measures with sufficient cross-country and time-series coverage for our sample period.
The FKI is available from 1999, whereas the IMD index, our primary measure, runs only through 2008; the upper bound of our 1995–2008 sample period is therefore set by the IMD index. The FKI also omits four countries in our sample (China, India, Ukraine, and Venezuela), so the FKI specifications cover at most 44 of the 48 countries, over 1999–2008; this reduced coverage, together with the shorter window, accounts for the smaller number of observations in those specifications. The Oliver-Márquez et al. (Reference Oliver-Márquez, Guarnido-Rueda and Amate-Fortes2021) FKI extends to 2014, but we restrict the FKI specifications to 1999–2008 so that the two literacy measures are assessed on a common window. Because the IMD index is perception-based, it is likely measured with error, which would tend to attenuate the estimated interaction toward zero rather than inflate it. The estimate is therefore plausibly conservative. If the same conclusion holds for the FKI, which is objectively constructed and unlikely to share the IMD index’s error structure, it makes it improbable that the finding is an artifact of either measure.
We also include country-specific macroeconomic and demographic controls. Growth of real GDP per capita and inflation capture macroeconomic conditions; inequality may differ in faster-growing economies and in those with less stable prices. Real GDP per capita growth (log difference) is the annual growth rate of GDP per capita, defined as gross domestic product divided by midyear population; inflation (in %) is the annual change in the GDP deflator. Trade openness (in natural logs), the ratio of imports plus exports to GDP, accounts for differences associated with integration into international trade. These three series are drawn from the World Bank’s World Development Indicators (WDI). Schooling and the age dependency ratio capture human capital and demographic differences across countries. Schooling (in natural logs) is the average years of secondary-school attainment among the population aged 25 and older, from the Barro and Lee (Reference Barro and Lee2013) database. The age dependency ratio (in natural logs), also from the WDI, is the ratio of dependents (those younger than 15 or older than 64) to the working-age population (ages 15–64).
Given the high persistence of inequality typically observed in cross-country panels, we verify that our inequality measure is stationary in levels before proceeding to estimation. Table 3 reports the Im-Pesaran-Shin (IPS) panel unit root statistic with an individual intercept and one lag. The null hypothesis of a unit root is rejected at the 1% significance level. The result confirms that the high persistence of inequality reflects the slow-moving nature of distributional outcomes (Solt Reference Solt2020) rather than non-stationarity, which justifies modeling it in levels with a lagged dependent variable rather than in differences.
Panel unit root test for income inequality

Table 3. Long description
A table with one row and four columns. The columns are labeled Inequality measure, IPS W-stat, p-value, and Conclusion. The row data is as follows: Inequality measure: SWIID post-tax gini (logs), IPS W-stat: -2.91, p-value: 0.002, Conclusion: Stationary.
Notes: Im-Pesaran-Shin (IPS) panel unit root test with individual intercept and one lag. Null hypothesis: all panels contain a unit root. Sample: 48 countries, 1995–2008.
3.2 Empirical methodology
In this section, we proceed with our estimation methodology, investigating whether the variation in economic literacy, which serves as an indicator of individuals’ capacity to access and utilize financial markets, can shed light on the finance-inequality relationship. The estimation equation is defined as follows:
 $$\eqalign{& Y_{i,t} = \alpha + \gamma Y_{i,t-1} + \beta _1 {\rm FINDEV}_{i,t} + \beta _2 {\rm ECLIT}_{i,t} + \beta _3 ({\rm FINDEV} \times {\rm ECLIT})_{i,t} \cr & \hskip2pc + \beta _4 {\bf X}_{i,t} + \phi _i + \psi _t + \epsilon _{i,t}}$$
The dependent variable Y i, t is the natural log of the SWIID post-tax Gini. ECLIT denotes a country’s economic-literacy capability. We proxy it in two ways: with the survey-based IMD economic literacy index and with the objectively constructed FKI of Oliver-Márquez et al. (Reference Oliver-Márquez, Guarnido-Rueda and Amate-Fortes2021). These measures are related but not identical: the IMD index reflects perceived economic literacy, and the FKI captures financial knowledge through objective structural indicators. FINDEV denotes financial development, which we measure with the multidimensional Financial Development Index of Svirydzenka (Reference Svirydzenka2016); as a robustness check, we re-estimate using the private credit-to-GDP ratio.
The vector X collects the control variables: trade openness, inflation, and real GDP per capita growth capture macroeconomic conditions, while the age dependency ratio and average years of secondary schooling capture demographic characteristics. The terms φi and ψt denote country and time fixed effects, respectively; the FINDEV × ECLIT interaction tests whether economic literacy moderates the effect of financial development on income inequality.
Panel data analysis addresses potential specification biases more effectively than cross-sectional analysis, but a central concern remains: financial development and income inequality may be jointly determined. Beck et al. (Reference Beck, Demirgüç-Kunt and Levine2007) argue that lower income inequality can itself foster a more efficient financial sector through political channels, which would bias estimates of the effect of financial development on inequality.
Several studies addressing the finance-inequality nexus confront this reverse causality with external instruments for financial development (Jappelli Reference Jappelli2010; Lo Prete Reference Lo Prete2018), such as the origins of a country’s legal system and creditor rights (La Porta et al. Reference La Porta, Lopez-de-Silanes, Shleifer and Vishny1997) and the strength-of-investor-protection index from the Doing Business Project. These instruments are time-invariant, however, which limits their use in a dynamic panel: holding fixed the country-level variation they exploit would effectively collapse the analysis to a cross-sectional setting, eliminating the within-country variation that identifies the moderating effect of economic literacy. Internal GMM instruments are therefore more appropriate for this dynamic panel framework.
We instead preserve the panel structure required for dynamic identification by relying on internal instrumentation through the System GMM (SGMM) estimator (Arellano and Bover Reference Arellano and Bover1995; Blundell and Bond Reference Blundell and Bond1998), which uses lagged values of the endogenous regressors to address reverse causality. It also has to be noted that SGMM is sensitive to instrument proliferation (Roodman Reference Roodman2009; Bazzi and Clemens Reference Bazzi and Clemens2013). Therefore, we keep the instrument count well below the number of countries and perform robustness checks with a reduced instrument set. All specifications are estimated by two-step System GMM with Windmeijer-corrected (Windmeijer Reference Windmeijer2005) robust standard errors, which adjust for the downward bias in the two-step standard errors that arises in finite samples.
A separate limitation concerns the frequency of the data. Lo Prete (Reference Lo Prete2018) averages annual observations into seven non-overlapping four-year blocks, a standard way to remove business-cycle noise. Economic literacy, however, is highly persistent within countries: in the IMD series, about 82% of the total variation is cross-country rather than over time.Footnote 1 Averaging this already limited within-country variation into multi-year blocks leaves little with which to identify a moderating effect, so an interaction estimated on such data is imprecise. Retaining annual observations preserves that variation, from which our estimator identifies the interaction.
4. Estimation
In this section, we present our benchmark System GMM estimates, then report a set of robustness checks.
4.1 Main results
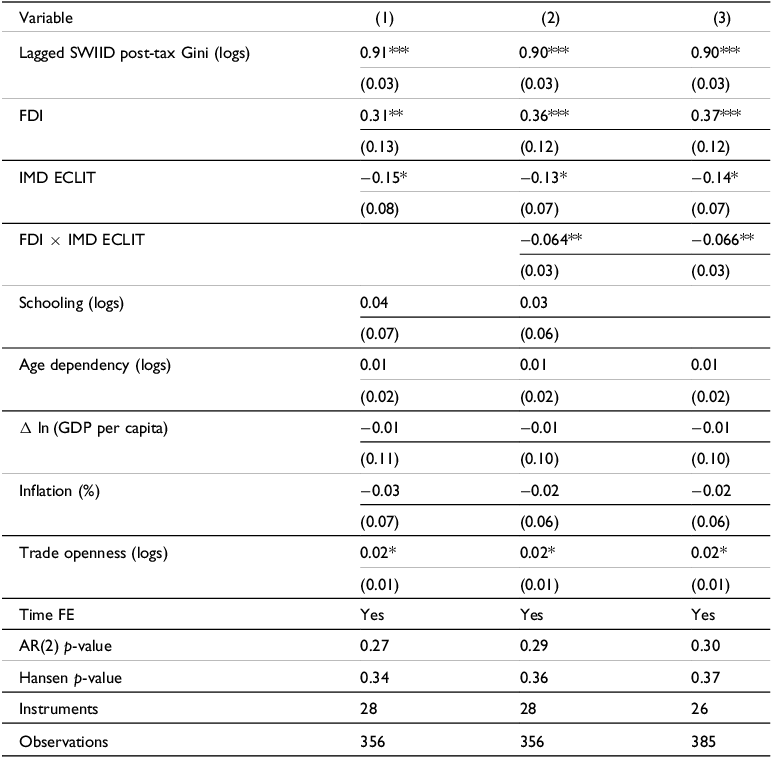
The benchmark estimator is System GMM (Arellano and Bover Reference Arellano and Bover1995; Blundell and Bond Reference Blundell and Bond1998). It addresses the endogeneity of the lagged dependent variable, accommodates weakly exogenous regressors, and corrects for the short-panel bias that arises when fixed-effects estimators are applied to dynamic specifications with relatively short time dimensions (Nickell Reference Nickell1981). Tables 4 and 5 report our main results using two methodologically independent measures of economic literacy capability: the IMD economic literacy index and the Oliver-Márquez et al. (Reference Oliver-Márquez, Guarnido-Rueda and Amate-Fortes2021) FKI. Column (1) includes financial development and economic literacy as separate regressors alongside the full set of controls; Column (2) adds their interaction and is our main specification; and Column (3) re-estimates the interaction specification without the schooling control to confirm that the moderating effect is not affected by general human capital.
SGMM estimates with IMD economic literacy index

Table 4. Long description
A table with three columns and twelve rows. The columns are labeled (1), (2), and (3). The rows are labeled with variables: Lagged SWIID post-tax Gini (logs), FDI, IMD ECLIT, FDI x IMD ECLIT, Schooling (logs), Age dependency (logs), Δln (GDP per capita), Inflation (%), Trade openness (logs), Time FE, AR(2) p-value, Hansen p-value, Instruments, Observations. Each cell contains numerical values and standard errors in parentheses. Column (1) includes financial development and economic literacy as separate regressors alongside the full set of controls. Column (2) adds their interaction and is the main specification. Column (3) re-estimates the interaction specification without the schooling control.
Notes: Two-step System GMM estimates with Windmeijer-corrected robust standard errors in parentheses. The dependent variable is the natural log of the SWIID post-tax Gini. FDI denotes the continuous Financial Development Index of Svirydzenka (Reference Svirydzenka2016), and ECLIT denotes the IMD Economic Literacy Index. All specifications include time fixed effects and a constant, not reported. Column (1) excludes the interaction term; Column (2) includes the interaction term and the schooling control; Column (3) includes the interaction term but omits the schooling control. Column (3) has more observations because schooling has missing values. The sample period is 1995–2008. *p < 0.10, **p < 0.05, ***p < 0.01.
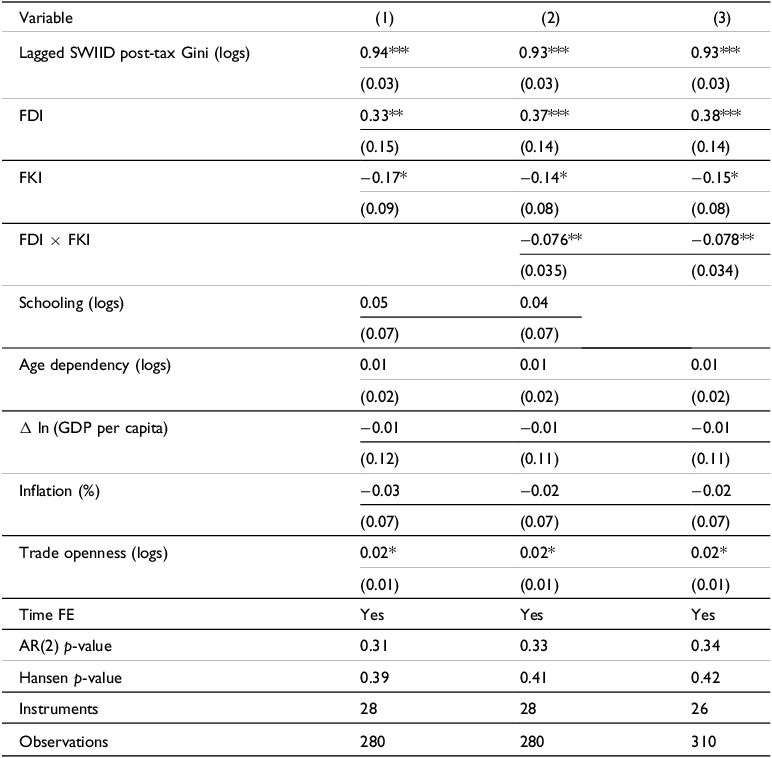
SGMM estimates with the Financial Knowledge Index (FKI)

Table 5. Long description
A table comparing SGMM estimates with the Financial Knowledge Index (FKI) across three columns. The table has 13 rows and 3 columns. Column headers are labeled as (1), (2), and (3). Row labels include Lagged SWIID post-tax Gini (logs), FDI, FKI, FDI x FKI, Schooling (logs), Age dependency (logs), Δln (GDP per capita), Inflation (%), Trade openness (logs), Time FE, AR(2) p-value, Hansen p-value, Instruments, and Observations. Each row contains values corresponding to the columns. Notable trends include significant values for Lagged SWIID post-tax Gini (logs), FDI, FKI, and FDI x FKI across the columns. The table also includes p-values and the number of instruments and observations used in the analysis.
Notes: Two-step System GMM estimates with Windmeijer-corrected robust standard errors in parentheses. The dependent variable is the natural log of the SWIID post-tax Gini. FDI denotes the continuous Financial Development Index of Svirydzenka (Reference Svirydzenka2016), and FKI denotes the Oliver-Márquez et al. (Reference Oliver-Márquez, Guarnido-Rueda and Amate-Fortes2021) Financial Knowledge Index, a 0–1 composite index constructed from objective macroeconomic and structural indicators. All specifications include time fixed effects and a constant, not reported. Column (1) excludes the interaction term; Column (2) includes the interaction term and the schooling control; Column (3) includes the interaction term but omits the schooling control. Column (3) has more observations because schooling has missing values. The sample period is 1999–2008. *p < 0.10, **p < 0.05, ***p < 0.01.
Column (1) of Table 4 shows that financial development is positively and significantly associated with income inequality once the endogeneity of finance is addressed, consistent with theories in which the initial gains from financial deepening accrue disproportionately to households and firms already integrated into the financial system (Greenwood and Jovanovic Reference Greenwood and Jovanovic1990; de Haan and Sturm Reference de Haan and Sturm2017). Economic literacy on its own enters negatively, with marginal significance, consistent with the finding in Lo Prete (Reference Lo Prete2013, Reference Lo Prete2018) that more economically literate populations exhibit lower inequality growth. The lagged dependent variable is large and significant, reflecting the well-documented persistence of distributional outcomes (Solt Reference Solt2020).
Column (2) introduces the interaction between financial development and economic literacy and constitutes our central result. The interaction coefficient is negative and significant at the 5% level, indicating that the inequality-enhancing effect of financial development is mitigated in countries with higher levels of economic literacy. The financial development coefficient becomes larger and more significant, so that at low levels of economic literacy the effect of finance on inequality is unambiguously positive, while at sufficiently high levels of economic literacy the marginal effect attenuates and may become negligible. Economic literacy’s main effect remains negative and marginally significant.
Column (3) repeats the interaction specification but omits the schooling control. If economic literacy were simply proxying for general human capital, removing schooling would be expected to alter the interaction term; instead, it is essentially unchanged, as are the financial development coefficient and economic literacy’s main effect. The moderating role of economic literacy therefore does not appear to operate through schooling.
These estimates can be reconciled with Lo Prete (Reference Lo Prete2013, Reference Lo Prete2018). That work establishes, in cross-country and instrumental-variable estimation, that higher economic literacy is associated with lower inequality and that the direct finance-inequality association weakens once economic literacy is taken into account. Where we differ is the interaction: we find it negative and significant, whereas in Lo Prete (Reference Lo Prete2018) it is not instrumented and is statistically insignificant. We attribute this difference to identification. As we discuss in the Methodology section of the paper, economic literacy is highly persistent within countries, so averaging annual data into multi-year blocks and instrumenting finance only with time-invariant external instruments leaves little within-country variation from which a moderating effect can be estimated. Retaining annual data and instrumenting internally through System GMM, we recover an interaction that is negative and significant.
On the direct effect, our result differs from Lo Prete (Reference Lo Prete2013, Reference Lo Prete2018); this difference reflects a different dependent variable. Specifically, while Lo Prete models the growth of the Gini and finds no significant effect of finance, we model the level of Gini and find finance positively associated with inequality. With the interaction included, the positive financial-development coefficient measures the effect of finance where economic literacy is at its lowest, not an average across countries. Because the interaction is negative, this effect diminishes as economic literacy rises, and at the upper end of the literacy range it may become negligible. A specification that enters finance and economic literacy additively, without the interaction, cannot capture this conditionality and reports finance as a single unconditional association. The positive direct association is itself consistent with recent objective-measure evidence on finance and inequality (Oliver-Márquez et al. Reference Oliver-Márquez, Guarnido-Rueda, Amate-Fortes and Martínez-Navarro2022). Furthermore, Seven (Reference Seven2022) provides a useful contrast, finding finance to be inequality-reducing in a static panel framework that instruments the finance-by-skill interaction with legal origins. In our dynamic specification with internal instruments, however, the direct association is positive, suggesting that the result depends partly on how endogeneity and within-country variation are addressed.
Instruments follow standard practice in the growth and development literature. Lagged values of the dependent variable and of the endogenous and weakly exogenous regressors serve as “GMM-style” instruments: we use the second and third lags of the dependent variable, GDP per capita growth, trade openness, inflation, schooling, economic literacy, the financial development index, and the financial development–economic literacy interaction. Because the interaction is a product of two instrumented regressors, it is itself treated as endogenous and instrumented through its own lags rather than entered as exogenous. The time effects and the age dependency ratio, treated as exogenous, serve as instruments for themselves (IV-style).
Across all specifications, the diagnostic tests support the validity of this approach. The AR(2) test gives no evidence of second-order autocorrelation, and the Hansen (Reference Hansen1982) test does not reject the overidentifying restrictions. The instrument count stays below the number of cross-sectional units, mitigating concerns about instrument proliferation (Roodman Reference Roodman2009).
A central concern is whether the IMD index, constructed from executive surveys, adequately captures population-level economic understanding (Jappelli Reference Jappelli2010; Lo Prete Reference Lo Prete2018). To address this, Table 5 re-estimates the benchmark using the Oliver-Márquez et al. (Reference Oliver-Márquez, Guarnido-Rueda and Amate-Fortes2021) Financial Knowledge Index, which is independent of the IMD measure in construction: it is built from objective macroeconomic and structural variables rather than survey perceptions, follows the OECD (2008) Handbook on Constructing Composite Indicators, and aggregates four sub-indices (economic capacity, educational training, use, and need). Because the FKI is available only from 1999, this specification covers the 1999-2008 portion of the panel.
The results in Table 5 are in accordance with those in Table 4. Financial development is positive and significant throughout, the FKI main effect is negative and marginally significant, and the FDI × FKI interaction is negative and significant at the 5% level. As with the IMD ECLIT index, dropping the schooling control in Column (3) leaves the interaction essentially unchanged.
As before, the AR(2) and Hansen (Reference Hansen1982) tests raise no concerns. Furthermore, the fact that the moderating effect holds across two measures of economic literacy of different constructions, one survey-based and one built from objective macroeconomic indicators, may offer some assurance that it is not specific to a single index.
4.2 Marginal effects
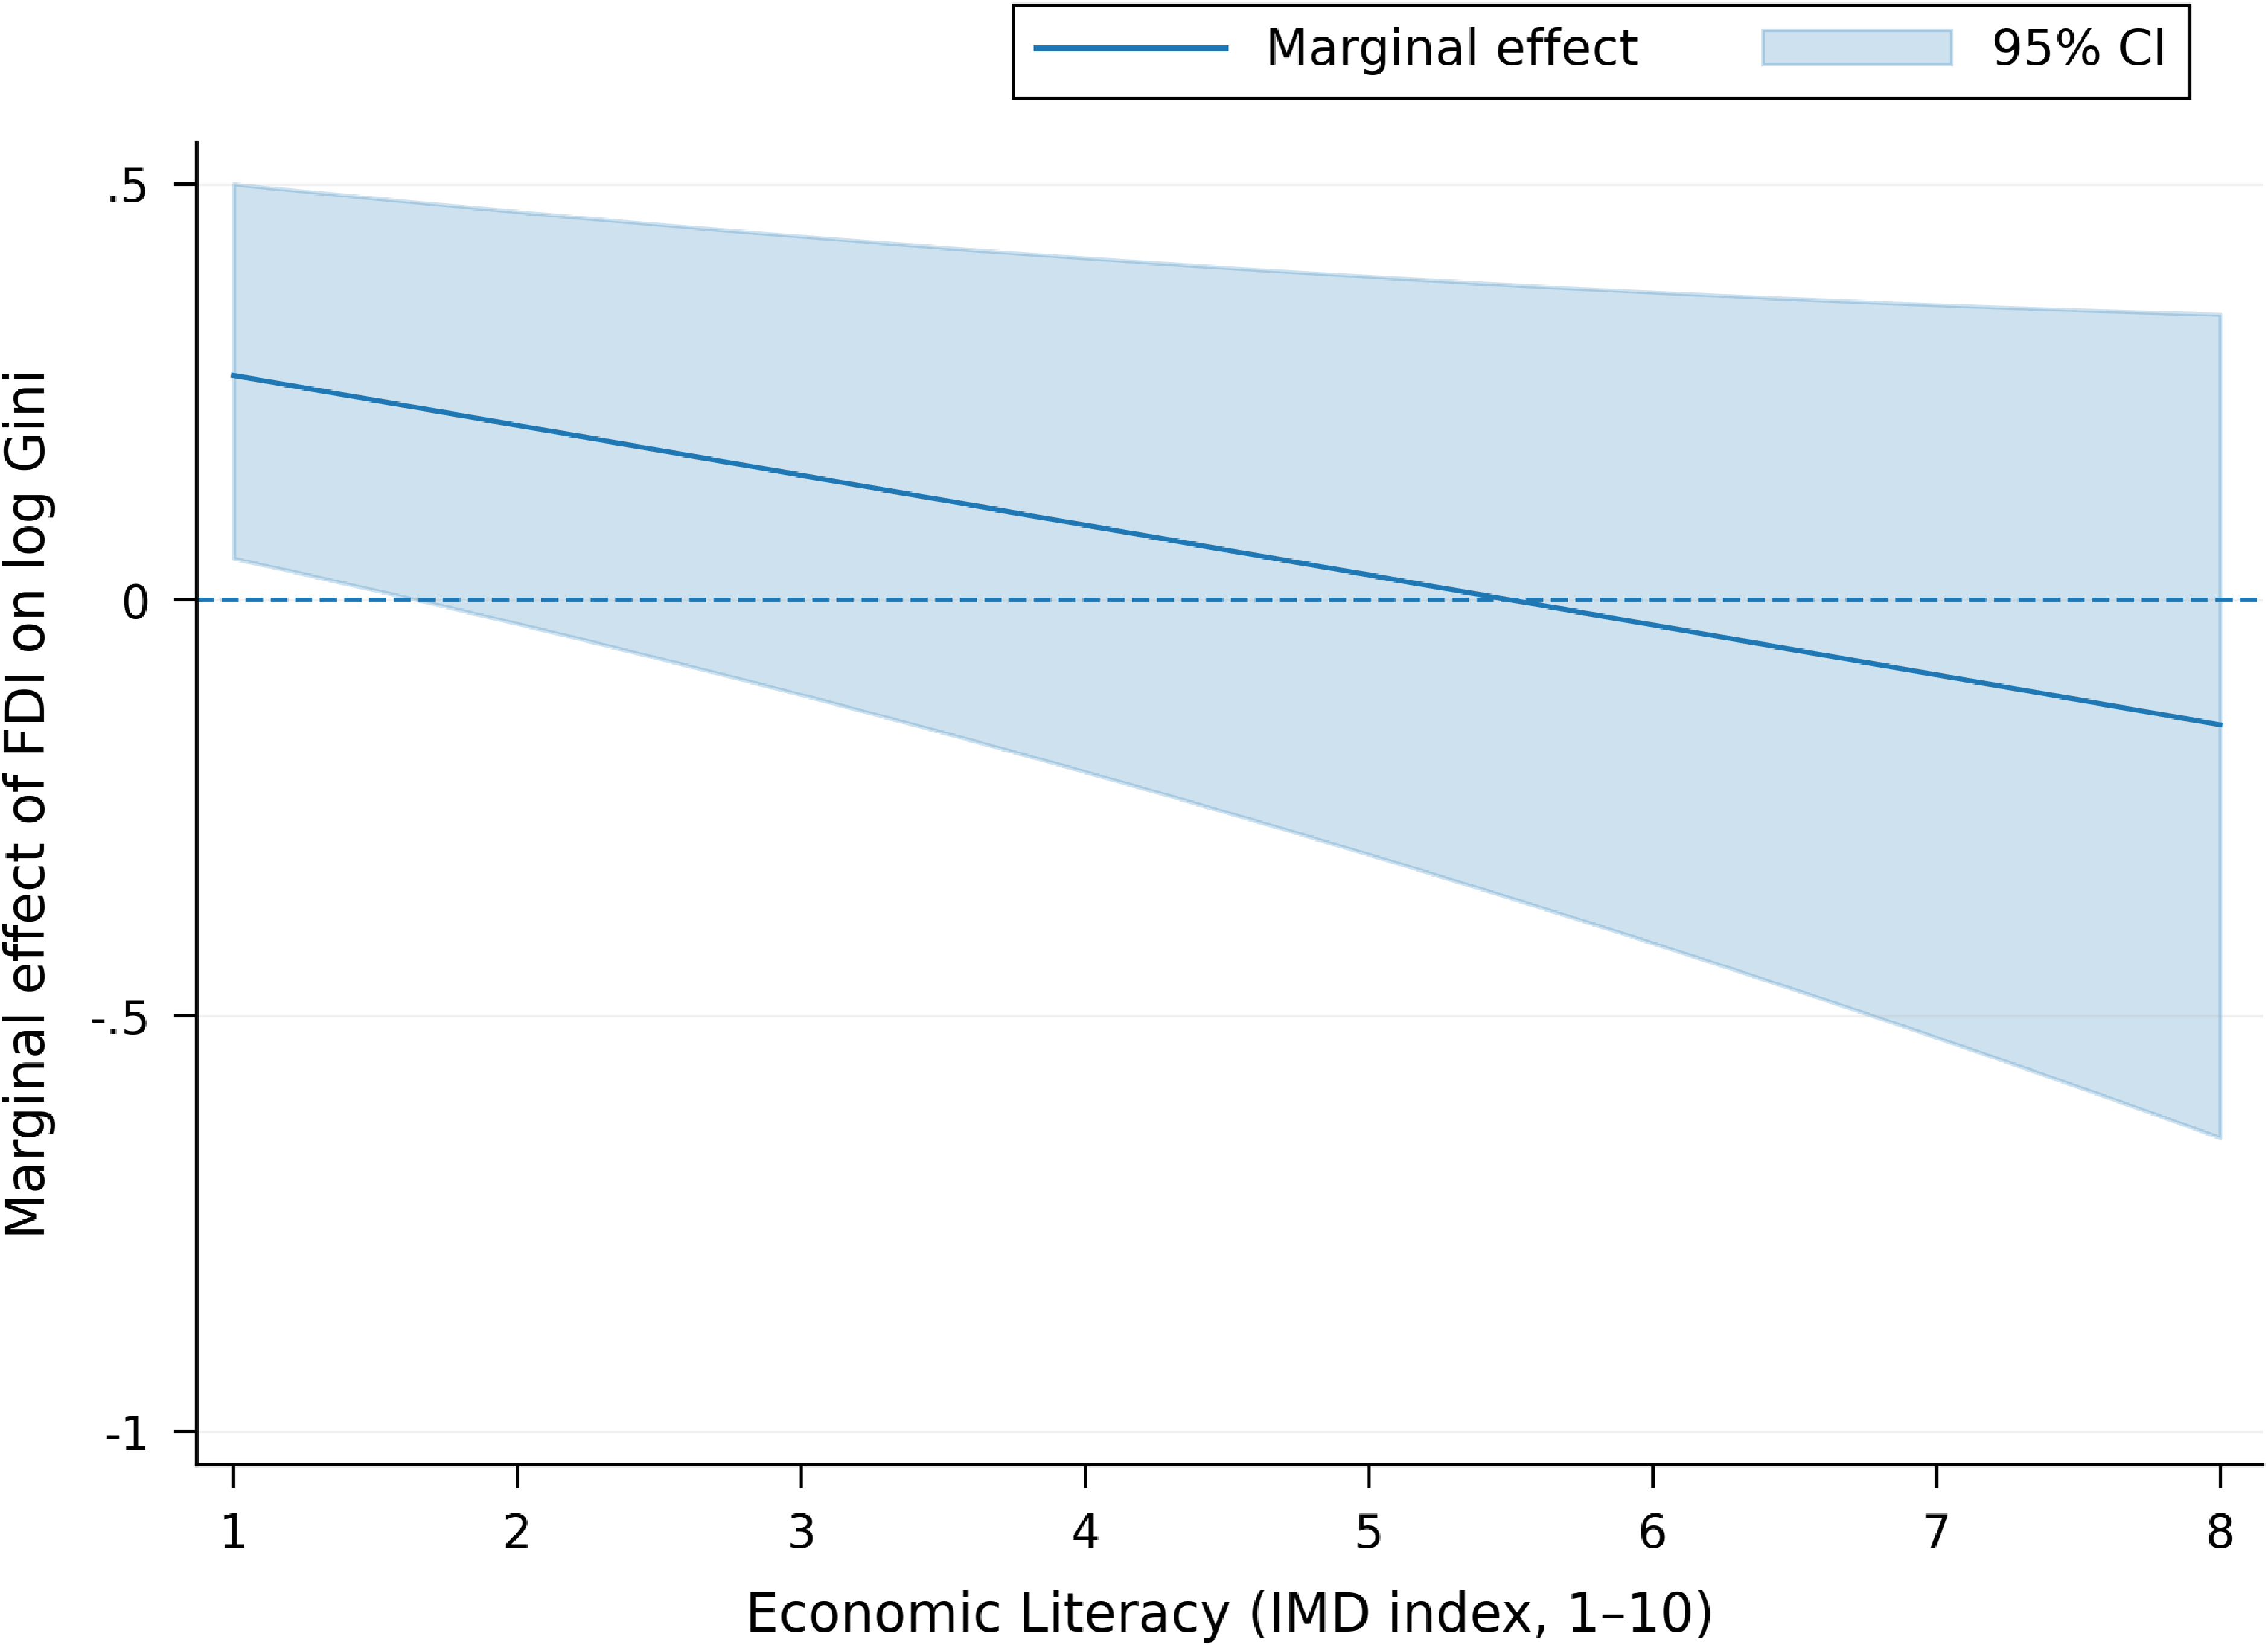
To interpret the moderating effect, Figure 1 plots the marginal effect of financial development on log inequality across the observed range of the IMD economic literacy index, with the 95% confidence interval derived from the benchmark specification in Table 4, Column (2). At low levels of economic literacy, financial development is strongly inequality-enhancing. At an IMD ECLIT value of 2, near the bottom of the observed range, the marginal effect is about 0.23: a one-unit increase in the Financial Development Index would raise the log post-tax Gini by roughly that amount, a sizeable distributional effect. This effect weakens steadily as economic literacy increases and crosses zero at an IMD ECLIT value of approximately 5.6, just above the sample mean of 5.23. Beyond this point, the point estimate becomes negative, reaching about − 0.15 at an IMD ECLIT value of 8, but the confidence interval at the high-literacy end is wide and includes zero. The effect there is therefore best interpreted as statistically indistinguishable from zero. The confidence interval widens toward both ends of the literacy distribution, where observations are sparser, so estimates at the extremes should be read with more caution than those near the mean. These are short-run, within-period effects.
Quantitatively, each one-point increase in the IMD economic literacy index lowers the marginal effect of financial development on log inequality by 0.064, the absolute value of the interaction coefficient in Table 4, Column (2). At the sample mean, the marginal effect is statistically indistinguishable from zero. Among observations with below-mean economic literacy, financial development is inequality-enhancing; above the mean, the effect attenuates and may approach zero. This pattern is consistent with economic literacy acting as a conditioning factor that shapes whether financial development translates into broader inclusion or concentrated benefits.
Marginal effect of financial development by economic literacy.
Notes: The figure plots the marginal effect of a one-unit increase in the continuous Financial Development Index (FDI) on the log of the SWIID post-tax Gini at different levels of the IMD economic literacy index (1–10 scale), based on the SGMM benchmark specification reported in Table 4, Column (2). The shaded area indicates the 95% confidence interval. The horizontal dashed line marks a zero marginal effect.

4.3 Robustness checks
We report three robustness exercises that test the sensitivity of the moderating effect of economic literacy on financial development: an alternative continuous finance measure (private credit/GDP), a reduced instrument set, and the inclusion of controls for institutional quality. Across all three, the interaction between financial development and economic literacy remains negative and significant, with magnitudes essentially unchanged relative to our benchmark results.
4.3.1 Alternative measure of financial development
The composite Financial Development Index of Svirydzenka (Reference Svirydzenka2016) is our preferred measure because it captures depth, access, and efficiency within a single multidimensional indicator. Much of the empirical finance-inequality literature, however, has relied on the more traditional measure of private credit to GDP (Rajan and Zingales Reference Rajan and Zingales1998; Beck et al. Reference Beck, Demirgüç-Kunt and Levine2007; Lo Prete Reference Lo Prete2013, Reference Lo Prete2018).
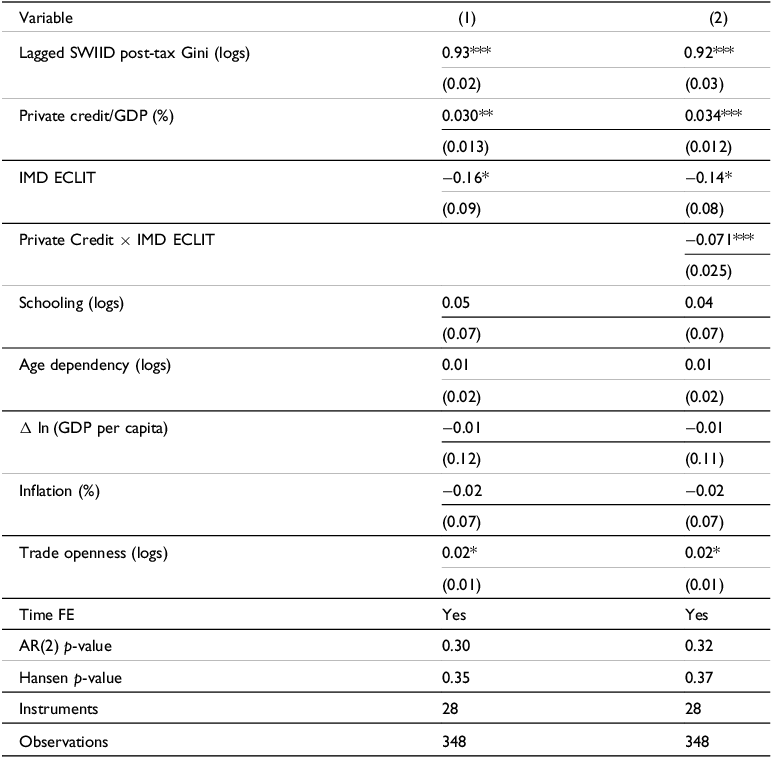
To verify that our results are not driven by the construction of the composite financial development index, Table 6 re-estimates the benchmark using private credit to GDP as a proxy for financial development. The private credit coefficient is positive and significant in both columns, indicating that greater credit market activity is associated with higher income inequality. The interaction between private credit and economic literacy is negative and significant, again suggesting that higher economic literacy mitigates the inequality-enhancing effect of credit market expansion. The diagnostic tests provide no evidence of second-order autocorrelation, and the Hansen test does not reject the overidentifying restrictions. The moderating role of economic literacy therefore persists under this simpler, single-dimensional measure of financial development. Notably, private credit to GDP is the measure used by Lo Prete (Reference Lo Prete2013, Reference Lo Prete2018), where the interaction is insignificant. Recovering a significant interaction with the same finance measure suggests that the difference reflects identification rather than the choice of finance proxy, as discussed in the Main Results.
SGMM estimates with private credit/GDP

Table 6. Long description
A table with two columns of regression results, labeled (1) and (2). The table includes variables such as Lagged SWIID post-tax Gini (logs), Private credit/GDP (percent), IMD ECLIT, Private Credit x IMD ECLIT, Schooling (logs), Age dependency (logs), ΔIn (GDP per capita), Inflation (percent), and Trade openness (logs). Each variable has corresponding coefficients and standard errors listed for both columns. The table also includes diagnostic tests such as Time FE, AR(2) p-value, Hansen p-value, the number of Instruments, and Observations. Row 1: Lagged SWIID post-tax Gini (logs), 0.93, 0.92. Row 2: Private credit/GDP (percent), 0.030, 0.034. Row 3: IMD ECLIT, -0.16, -0.14. Row 4: Private Credit x IMD ECLIT, -0.071. Row 5: Schooling (logs), 0.05, 0.04. Row 6: Age dependency (logs), 0.01, 0.01. Row 7: ΔIn (GDP per capita), -0.01, -0.01. Row 8: Inflation (percent), -0.02, -0.02. Row 9: Trade openness (logs), 0.02, 0.02. Row 10: Time FE, Yes, Yes. Row 11: AR(2) p-value, 0.30, 0.32. Row 12: Hansen p-value, 0.35, 0.37. Row 13: Instruments, 28, 28. Row 14: Observations, 348, 348.
Notes: Two-step System GMM estimates with Windmeijer-corrected robust standard errors in parentheses. The dependent variable is the natural log of the SWIID post-tax Gini. Private credit/GDP denotes claims on the private sector as a percent of GDP, from the World Bank Global Financial Development Database. ECLIT denotes the IMD Economic Literacy Index. All specifications include time fixed effects and a constant, not reported. Column (1) excludes the interaction term; Column (2) includes the interaction term. The sample period is 1995–2008. *p < 0.10, **p < 0.05, ***p < 0.01.
4.3.2 Reduced instrument set
A standard concern with System GMM is that the instrument count can grow with the time dimension of the panel, leading to instrument proliferation and a less informative Hansen test (Roodman Reference Roodman2009). When instruments are numerous relative to the number of cross-sectional units, the Hansen (Reference Hansen1982) test loses power and can produce implausibly high p-values that mask invalid instruments. A common rule of thumb is therefore to keep the instrument count below the number of groups. Our benchmark uses 28 instruments against 48 countries, an instrument-to-country ratio of roughly 0.6, which is comfortably within this guideline.
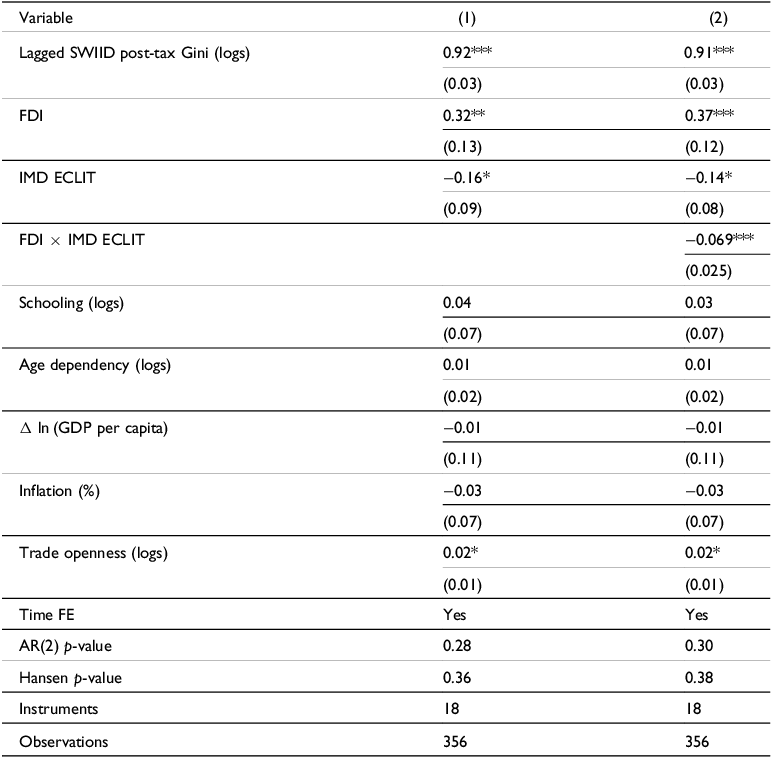
As a further test, we re-estimate the benchmark with a smaller instrument set. Specifically, we restrict the lag depth to the second lag only and apply the collapse option, which limits the number of moment conditions used for each variable and reduces the instrument count from 28 to 18, lowering the instrument-to-country ratio to below 0.4. If the benchmark estimates were being driven by an overfitted instrument matrix, sharply reducing the instrument count in this way would be expected to alter the coefficients or weaken the diagnostics. Instead, as reported in Table 7, the reduced specification yields estimates that are very close to the benchmark. Financial development remains positive and significant in both columns, and the FDI × ECLIT interaction remains negative and significant, with a magnitude close to that in the main specification. The diagnostic tests provide no evidence of second-order autocorrelation, and the Hansen test does not reject the overidentifying restrictions. The stability of the interaction across instrument sets indicates that the moderating role of economic literacy is not driven by the instrument matrix used in the benchmark.
SGMM estimates with reduced instrument set

Table 7. Long description
The table presents estimates from a regression analysis with a reduced instrument set. It includes two columns of results, labeled (1) and (2), and various economic variables. The variables include Lagged SWIID post-tax Gini (logs), FDI, IMD ECLIT, FDI x IMD ECLIT, Schooling (logs), Age dependency (logs), Δln(GDP per capita), Inflation (%), and Trade openness (logs). Each variable is associated with a coefficient value and a standard error in parentheses. The table also includes diagnostic tests such as Time FE, AR(2) p-value, Hansen p-value, the number of Instruments, and the number of Observations. The coefficients and their significance levels are reported for each variable, indicating their impact on financial development.
Notes: Two-step System GMM estimates with Windmeijer-corrected robust standard errors in parentheses. The dependent variable is the natural log of the SWIID post-tax Gini. FDI denotes the continuous Financial Development Index of Svirydzenka (Reference Svirydzenka2016), and ECLIT denotes the IMD Economic Literacy Index. All specifications include time fixed effects and a constant, not reported. Column (1) excludes the interaction term; Column (2) includes the interaction term. The instrument count is reduced from 28 to 18 by using only the second lag and applying the collapse option. The sample period is 1995–2008. *p < 0.10, **p < 0.05, ***p < 0.01.
4.3.3 Institutional quality controls
A further concern is that economic literacy may proxy for broader institutional quality rather than population-level economic understanding (de Haan and Sturm Reference de Haan and Sturm2017). Countries with more economically literate populations may also have stronger rule of law, better regulatory environments, and more effective governance, any of which could shape how financial development affects inequality through channels distinct from economic literacy itself. If so, the interaction we attribute to economic literacy might instead reflect the quality of a country’s institutions. We address this directly by adding two governance indicators from the World Bank Worldwide Governance Indicators (WGI), rule of law and regulatory quality, to the benchmark specification. If the moderating role of literacy primarily reflected governance, adding these controls would be expected to attenuate the interaction; if it reflects a distinct channel, the interaction should persist.
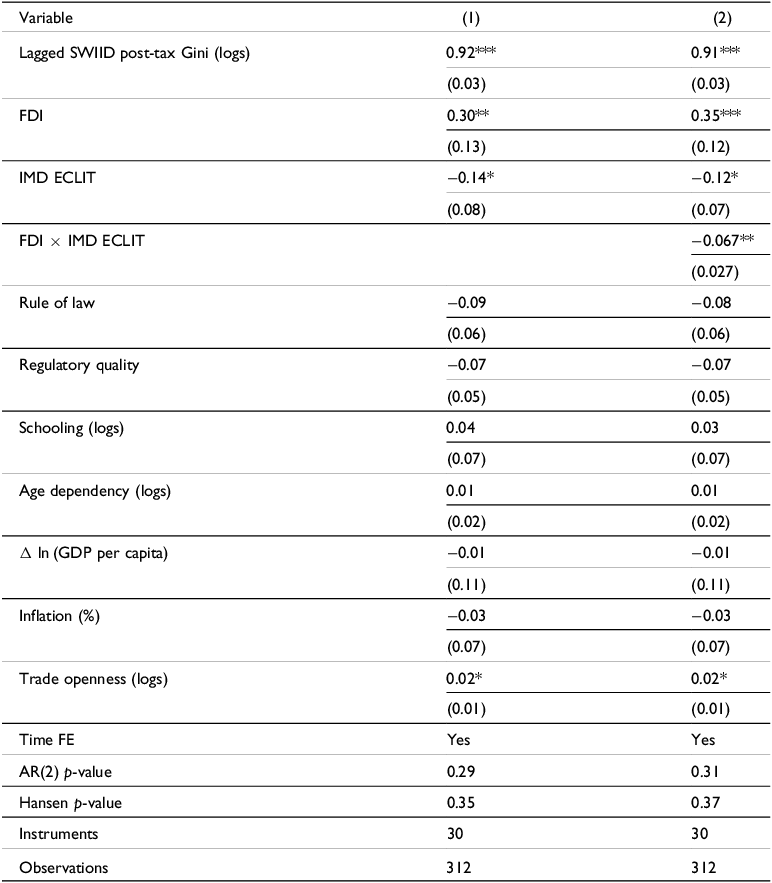
The results, reported in Table 8, support the latter interpretation. Both governance indicators enter with negative signs, consistent with stronger governance being associated with lower inequality, but neither is statistically significant once the literacy interaction is included. In contrast, the financial development coefficient and the FDI × ECLIT interaction remain close to the benchmark estimates in Table 4, both in magnitude and in significance.
SGMM estimates with institutional quality controls

Table 8. Long description
A table with two columns of regression results labeled (1) and (2). The table includes variables such as Lagged SWIID post-tax Gini (logs), FDI, IMD ECLIT, FDI x IMD ECLIT, Rule of law, Regulatory quality, Schooling (logs), Age dependency (logs), Δln (GDP per capita), Inflation (%), and Trade openness (logs). Each variable has corresponding coefficients and standard errors. Notable trends include significant coefficients for Lagged SWIID post-tax Gini, FDI, and IMD ECLIT in both columns, with FDI x IMD ECLIT being significant only in column (2). The table also includes information on Time FE, AR(2) p-value, Hansen p-value, Instruments, and Observations.
Notes: Two-step System GMM estimates with Windmeijer-corrected robust standard errors in parentheses. The dependent variable is the natural log of the SWIID post-tax Gini. FDI denotes the continuous Financial Development Index of Svirydzenka (Reference Svirydzenka2016), and ECLIT denotes the IMD Economic Literacy Index. Rule of law and regulatory quality are from the World Bank Worldwide Governance Indicators. All specifications include time fixed effects and a constant, not reported. Column (1) excludes the interaction term; Column (2) includes the interaction term. Rule of law and regulatory quality are produced biennially before 2002 (1996, 1998, 2000) and annually from 2002 to 2008; the intervening years are not interpolated. The estimation sample is therefore confined to country-years with available governance data. The sample period is 1996–2008. *p < 0.10, **p < 0.05, ***p < 0.01.
The stability of the interaction after controlling for rule of law and regulatory quality suggests that economic literacy conditions the finance-inequality relationship through a channel that is not simply reducible to general institutional quality. Economic literacy therefore appears to capture variation beyond the strength of a country’s institutional environment. This distinction matters substantively, as it suggests that strengthening the population’s ability to understand and use financial services may have distributional value, even after accounting for improvements in governance.
4.4 Limitations and future research
Our study has several limitations, each pointing to a direction for future work. First, our analysis is restricted to the 1995-2008 period by the availability of the IMD economic-literacy index, our primary measure, which ends in 2008. The Oliver-Márquez et al. (Reference Oliver-Márquez, Guarnido-Rueda and Amate-Fortes2021) FKI extends beyond this window; we restrict attention to 1999–2008 to hold the comparison with the IMD index fixed. Other cross-country measures either begin later or appear only as one-off cross-sections, which limits the time span over which the moderating role of economic literacy can be identified. As longer or more frequent series become available, future research could revisit the moderating channel with newer data and could test whether it holds equally across groups, since economic literacy is known to differ systematically along demographic and cultural lines (Davoli and Rodríguez-Planas Reference Davoli and Rodríguez-Planas2024).
Second, our sample period ends before several major changes in financial systems. Since 2010, fintech, mobile banking, and digital finance have reshaped access to financial services, especially in developing economies, where financial literacy is an important driver of inclusion (Grohmann et al. Reference Grohmann, Klühs and Menkhoff2018). Post-crisis reforms have also changed regulation and consumer protection. How these shifts would affect the moderating role of economic literacy is unclear. On one hand, digital tools may have lowered the barriers that low economic literacy creates. On the other hand, financial products have grown more complex, which raises the premium on economic literacy and can leave less economically literate households more exposed, particularly when inflation is high (Lusardi and Streeter Reference Lusardi and Streeter2023); consistent with this, Başar et al. (Reference Başar, Keskin, Esen, Merter and Balcıoğlu2025) find that the savings benefits of FinTech accrue mainly to individuals with stronger financial literacy. Extending the analysis through the post-crisis and digital-finance era is therefore a priority, and the post-2010 data would also allow the moderating channel to be examined during episodes of financial stress, where literacy gaps are most consequential (Klapper et al. Reference Klapper, Lusardi and Panos2013).
Third, the IMD index is survey-based and reflects business leaders’ perceptions of population-level literacy rather than direct measurement. As discussed in the Data section, any such measurement error would tend to attenuate the estimated moderating effect toward zero, so the estimate is plausibly conservative. The methodologically independent FKI partially mitigates this concern, but direct, population-level measurement of economic literacy, of the kind the OECD/INFE framework (Atkinson and Messy Reference Atkinson and Messy2012) was designed to provide, would be preferable where cross-country panels become available.
Fourth, the unbalanced structure of our panel prevents the use of non-linear panel GMM approaches that would allow threshold effects to be estimated jointly with endogenous regressors and threshold variables (Seo and Shin Reference Seo and Shin2016). This is a meaningful constraint, because both the finance-inequality relationship and the role of economic literacy appear to be non-linear: financial development may follow an inverted U-shaped path (Greenwood and Jovanovic Reference Greenwood and Jovanovic1990; Kim and Lin Reference Kim and Lin2011), its distributional effect varies with a country’s income level (Thornton and Di Tommaso Reference Thornton and Di Tommaso2020), and financial literacy itself appears to mitigate the diminishing returns to financial development (Boikos et al. Reference Boikos, Panagiotidis and Voucharas2026). Likewise, the macroeconomic relationship between financial knowledge and inequality has been found to be non-linear in knowledge itself (Oliver-Márquez et al. Reference Oliver-Márquez, Guarnido-Rueda, Amate-Fortes and Martínez-Navarro2022), a curvature in the literacy effect that is distinct from the finance-conditional-on-literacy interaction we estimate. Our interaction implies a single crossover point, as already discussed. Future work with longer or more balanced panels could estimate this threshold directly and could test whether it shifts with a country’s stage of development.
5. Concluding remarks
This paper builds on Lo Prete (Reference Lo Prete2013, Reference Lo Prete2018), who first introduced economic literacy into the cross-country finance-inequality literature and proposed that it conditions the distributional consequences of financial development. That conditioning role, however, had not yet been identified in panel data. We provide that evidence. Retaining annual data and instrumenting internally through System GMM, we recover a negative and significant moderating effect of economic literacy on the finance-inequality relationship. The finding holds across both literacy measures, with negative and significant interaction coefficients in each case, and the agreement of an objectively constructed measure, the FKI of Oliver-Márquez et al. (Reference Oliver-Márquez, Guarnido-Rueda and Amate-Fortes2021), with the perception-based IMD index makes it improbable that the result depends on how literacy is measured. At low levels of economic literacy, financial development is inequality-enhancing; as literacy rises, this effect weakens, and at sufficiently high levels it may become negligible. The interaction remains negative and significant under an alternative measure of financial development, a reduced instrument set, and controls for institutional quality.
These results relate to the broader macroeconomic literature in several ways. The negative association between economic literacy and inequality is consistent with Lo Prete (Reference Lo Prete2013, Reference Lo Prete2018) and Oliver-Márquez et al. (Reference Oliver-Márquez, Guarnido-Rueda, Amate-Fortes and Martínez-Navarro2022), a main effect on which this literature already agrees. The positive direct effect of financial development aligns with the positive finance coefficient in recent objective-measure evidence (Oliver-Márquez et al. Reference Oliver-Márquez, Guarnido-Rueda, Amate-Fortes and Martínez-Navarro2022) and with the broader strand finding that financial deepening can widen the distribution (Jaumotte et al. Reference Jaumotte, Lall and Papageorgiou2013; de Haan and Sturm Reference de Haan and Sturm2017). More broadly, where much of this literature treats finance and literacy as separate determinants of inequality, our findings point to economic literacy as a conditioning factor in the finance-inequality relationship, adding to a body of work that examines how the distributional effects of finance vary with characteristics of the populations that use the financial system (Lo Prete Reference Lo Prete2013, Reference Lo Prete2018; Seven Reference Seven2022).
Our analysis has implications for policy. While financial development can exacerbate income inequality, this effect is mitigated in countries with higher levels of economic literacy. Economic literacy is thus not a substitute for financial development but a condition under which its gains are more widely shared. Policymakers may therefore consider fostering it as a complement to financial sector development through initiatives such as economic education in school curricula, community-based financial education, and workplace training. Recent experimental evidence suggests that even low-cost, scalable programs can raise financial knowledge (Clark et al. Reference Clark, Lin, Lusardi, Mitchell and Sticha2025). Realizing this role, however, will require sustained investment in the macro-level measurement of economic literacy, which remains scarce.
Supplementary material
The supplementary material for this article can be found at https://doi.org/10.1017/flw.2026.10014.
Acknowledgements
We thank the editor, Annamaria Lusardi, and two anonymous reviewers for their insightful comments and constructive suggestions, which helped us substantially improve the paper. We are also grateful to participants at the C.R.E.T.E. 2024 and S.E.A. 2024 conferences and the Bank of Greece research seminar for their valuable feedback. Georgios Koimisis gratefully acknowledges support from the O’Malley School of Business at Manhattan University through the Gabriel Hauge Fellowship and Danielle McGowan Vetere’s contribution to a preliminary version of this work. The usual disclaimer applies.
Conflicts of Interest
The authors declare that they have no known competing financial interests or personal relationships that could have appeared to influence the work reported in this paper.
Declaration of generative AI in the writing process
During the preparation of this work, the authors used Quillbot in order to improve the readability of the paper. After using this tool, the authors reviewed and edited the content as needed and take full responsibility for the content of the manuscript.



 Open access

