


Introduction
In recent years a number of experimenters (Reference GlenGlen, 1955; Reference SteinemannSteinemann, 1958; Butkovich and Landauer, 1958; Reference VoytkovskiyVoytkovskiy, 1960; Reference Mellor and TestaMellor and Testa, 1969) have investigated quantitatively the creep response of polycrystalline ice to applied load. These experiments have shown that the relationship between rate of strain and applied stress can be described by a power-type law

where σ is the applied stress and ė the resulting strain-rate. However, the various experiments do not give consistent values for the parameters A and n. For example, reported values of n range from close to 1 to over 4. Some of these differences may possibly be explained by failure of the power law to describe ice rheology over a large stress range. For example, n may increase with increasing stress, in which case the description as a power law is not strictly applicable but is approximately valid for only a limited range of stress (Reference SteinemannSteinemann, 1958; Reference Butkovich and LandauerButkovich and Landauer, 1960; Reference Mellor and TestaMellor and Testa, 1969). On the other hand, some of these differences may arise because the samples used in the various experiments were not structurally the same, and because a well-defined steady-state deformation was not always achieved. Because of these difficulties, it is not at all certain that one of the experimentally determined flow laws or some average of them will reasonably represent the properties of natural glacier ice, which can be structurally quite different from the experimental samples, and which has been subjected to stress over considerably longer intervals of time.
Measurements of ice deformation in temperate and nearly temperate glaciers (Reference Gerrard, Gerrard, Perutz and RochGerrard and others, 1952; Reference SharpSharp, 1953; Reference MathewsMathews, 1959; Reference MeierMeier, 1960; Reference Paterson and SavageSavage and Paterson, 1963; Reference Kamb and ShreveKamb and Shreve, 1966; Reference Shreve and SharpShreve and Sharp, 1970) have shown that, in fact, glacier ice deforms in rough agreement with the power law (n = 4.2) deduced by Reference GlenGlen (1955) from quasi-viscous analysis of his experiments done at −0.02° C. However, apparent differences exist. Some field observations give values of n higher than expected on this basis (e.g. Reference Kamb and ShreveKamb and Shreve, 1966); others give lower values of n (e.g. Reference Shreve and SharpShreve and Sharp, 1970). Similarly some observations suggest that temperate glacier ice has a higher apparent viscosity than expected from the laboratory experiments (e.g. Reference Savage and PatersonPaterson and Savage, 1963); others suggest the opposite (e.g. Reference Shreve and SharpShreve and Sharp, 1970).
These analyses of bore-hole deformation data have been based on the assumption that the surface-parallel shear stress varies linearly with depth from zero at the surface to some value at the base, which is usually taken equal to the average basal shear stress as computed from the hydraulic radius of the channel. This assumption is valid only in special circumstances (Reference NyeNye, 1965); measurements of velocity across a complete cross-section of Athabasca Glacier indicate that this assumption breaks down there (Reference RaymondRaymond, 1971[b], p. 72). Thus, apparent differences between results of different field experiments and experimentally determined flow laws may represent failure of the assumptions about the distribution of stress instead of actual rheological effects. In order to avoid the standard assumptions about stress, one is confronted with an interesting inverse problem. The purpose of this paper is to consider how the stress field and rheological parameters may be determined in a flowing medium from measurements of the three-dimensional distribution of velocity and only general assumptions about the rheology of the material. The techniques are applied to measurements of deformation made in the Athabasca Glacier (Reference RaymondRaymond, 1971 [a], Reference Raymond[b]).
Rheolocical Assumptions
It is assumed that the relationship between the applied stress τ ij and the resulting rate of strain ė ij can be described by

where 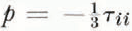 is the mean compressive stress, τ
ij
′ = τ
ij
+ pδ
ij
are the deviatoric stress components, and η is an effective viscosity which may be a function of the non-zero invariants of the strain-rate tensor
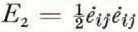 and E
3 = det │ė
ij
│. (Here and in subsequent equations, subscripts i and j range from 1 to 3 and a repeated subscript in a term indicates summation over this range.) In addition, η may depend on other parameters such as temperature, texture, chemical composition, etc. The possibility of plastic behavior with a non-zero yield stress is excluded by the additional explicit requirement that the deviatoric stress be zero whenever the strain-rate is zero.
The material described by Equation (1) is an isotropic, incompressible, viscous fluid in which the viscosity depends on the rate of deformation (or equivalently the state of stress) but does not depend on the mean stress. If η is entirely independent of the rate of strain, then the material behaves like a simple Newtonian fluid. If η is a function only of the second invariant of strain-rate E 2, then the material is identical to that considered by Reference NyeNye (1957) for theoretical analysis of glacier flow. If η is a function of both invariants E 2 and E 3 then the material behavior is more complicated than has yet been applied to glaciers, but it can still be treated easily by some of the methods described below.
There are a number of reasons why Equation (1) may be in reality too simple. The response of a crystalline solid depends on the history of loading and not just the present stress. Equation (1) would apply only if the stress has been constant sufficiently long for a steady state to be achieved. It is possible that creep response may depend on the mean stress, although experimental evidence (Reference RigsbyRigsby, 1958; Reference Haefeli, Haefeli, Jaccard and QuervainHaefeli and others, 1968) show that this dependence is weak. Measurements of c-axis fabrics in glacier ice (Reference KambKamb, 1959; Reference RigsbyRigsby, 1960) have shown that crystals are usually not randomly oriented. Because of the strong plastic anisotropy of ice single crystals (Reference NakayaNakaya, 1958; Reference Higashi and RiehlHigashi, 1969), it is reasonable to expect that glacier ice may be somewhat anisotropic. Even if these difficulties did not exist, it is still possible that the behavior of glacier ice could be more complicated than is describable by Equation (1). Reference GlenGlen (1958) has discussed this in detail. However, until more experimental information is available, it does not seem necessary to consider more general material behavior. The purpose of the following analysis is to discuss to what extent the applicability of Equation (1) can be tested, and if it is applicable, how the specific functional dependence of η on E 2 and E 3 can be determined.
Methods of Analysis
Conditions for equilibrium of a material describable by Equation (1) which is undergoing slow steady deformation and is acted upon by gravity are:

where ρ is the density of the material and g i are the components of the gravitational acceleration. Choose coordinates (x, y, z) such that the y = 0 plane approximates the glacier surface. Let the z-axis be horizontal, the y-axis point downward, and the x-axis be directed down-glacier. Define at each point on the glacier surface a local coordinate system (x′, y′, z′) for which y′ is normal to the local surface and points downward and x′ has azimuth identical to the azimuth of the x-axis. Let y s (x, z) represent the glacier surface. Then the equations of equilibrium become:


where u, v and w are the x, y and z components of velocity, where

is the difference between the mean compressive stress p and the sum of the weight of the overlying ice and atmospheric pressure p a, and where

are the components of an effective body force composed of the respective components of g and gradients in the overburden pressure. At the surface y = y s (x, z):


Normally, one attempts to solve the equations of equilibrium for the distribution of velocity given the behavior of the material and appropriate boundary conditions. Here the purpose is to consider the inverse problem in which one attempts to determine the distribution of η given the distribution of velocity as determined by field measurements. From this point of view Equations (3) are viewed as three first-order partial differential equations in two unknown functions η and p. If the region in which the velocity is known intersects the surface y s (x, z), then Equations (4) provide boundary conditions. Presumably Equations (3) and (4) could be solved to define η and p throughout this volume. This will not always be possible. Obviously a necessary condition on the velocity field is that ė x′y′ and ė y′z′ be zero on y s, so that Equations (4a) and (4b) can be satisfied. Since there are three differential equations to be satisfied and only two unknown functions to be determined, it also seems likely that a solution will not exist for an otherwise arbitrary distribution of velocity, but additional conditions would have to be satisfied in order to guarantee the existence of a solution. Non-existence of a solution would indicate that the material behaves in a fashion which cannot be described by Equation (1). Further it is not apparent that Equations (4) are adequate boundary conditions. If the solution is to exist at all, ė x′y′ and ė y′z′ must equal zero on y s (x, z) in which case Equations (4a) and (4b) would seem not to give any constraint on η or p. This suggests that even if a solution exists it may not be unique, no matter what accuracy and resolution is achieved in the measurement of the velocity distribution. To gain some insight into these mathematical questions, it is useful to consider some special cases.
Rectilinear flow. Consider the case where the top surface is planar, so that y
s (x, z) = 0 and (x′, y′, z) are aligned with the (x, y, z) coordinates, where the flow is rectilinear (v = w = 0), and where the density does not depend on x or z. The only non-zero components of strain-rate are 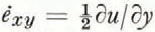 and
 . If Equation (1) applies, u must be independent of x because of incompressibility and ∂u/∂y must be zero on y = 0 by Equation (4a). Assume that the ice rheology is x independent, so ∂η/∂x = 0. Equations (3b), (3c) and (4c) require that p* be zero, and when this is the case they are satisfied.
Equation (3a) becomes

Equation (5) is a first-order partial differential equation with a single dependent variable η. In general, there is a single characteristic curve passing through each point with direction given by

Thus the characteristic curves are parallel to the gradient of u. On a contour diagram of u the curves would run normal to the contours. At points where both ∂u/∂y and ∂u/∂z are zero, the direction of the characteristic curves is undetermined, and there can be more than one curve passing through such a point. Figure 1 shows a hypothetical distribution of u and the associated characteristic curves in a valley glacier with cylindrical channel and planar upper surface.

Specifying the dependent variable along a characteristic will in general not enable one to determine the solution elsewhere. Since the surface of a glacier undergoing rectilinear flow is a characteristic, it would seem that Equations (3) and (4) are not sufficient to determine a solution. However, it is also true that specifying the value of the dependent variable at one point on a characteristic determines it at all other points on that characteristic. For the hypothetical distribution of velocity shown in Figure 1, every point in the cross-section is joined by a characteristic curve to a single point on the surface at which velocity is maximum. This suggests that a solution for η could be obtained, if a suitable condition at the intersection point could be formulated.
To investigate these possibilities, Equation (5) can be expressed with respect to a new coordinate system (t, n) defined by a one-to-one transformation

This coordinate system is chosen so that curves of constant n are parallel to the characteristics and curves of constant t are parallel to the u-contours. By using the fact that ∂u/∂n = 0 and defining τ s = ηh t ∂u/∂t, Equation (5) becomes

where

are the scale moduli of the coordinate transformation defined by Equations (7). The quantity  gives the gradient of u and is twice the shear strain-rate (denoted ė
s) acting across a surface parallel to the velocity contour; τ
s = 2ηė
s represents the corresponding shear stress.
A suitable condition on τ s at the intersection point is that it be zero. This is compatible with the requirement that the shear stress be zero whenever the shear strain-rate is zero. With this condition, Equation (8) can be solved along any chosen characteristic curve defined by a particular value of n to determine uniquely τ s(t, n). It is convenient to choose t = 0 at the intersection point. It is easily verified that a solution to Equation (8) with τ s = 0 for t = 0 is

Thereafter η(t, n) = τ s(t, n)[h t ∂u/∂t]−1 = τ s(t, n)/2ė s is easily calculated.
There is a very simple physical explanation, for the above conclusions. Since ∂u/∂n = 0, the x component of the traction acting on cylindrical surfaces parallel to the characteristics and the x-axis is zero. Consequently, the gross equilibrium of a pie-shaped segment of material (shaded area in Fig. 1) bounded by two characteristics (coordinate lines n
1 and n
2) and a velocity contour (coordinate line t) must be accomplished by the action of a shear stress across the velocity contour. If the distance along the velocity contour (t) between n
l and n
2 is L(t, n
1, n
2), if A(t, n
1, n
2) is the included area, and if 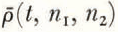 is the average density over that area, then the average shear stress is

By taking 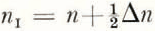 and
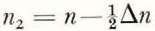 and by taking note that

and

it is easily verified that Equations (10) and (11) are equivalent in the limit Δn → 0. Equation (11) not only gives one an intuitive understanding of the content of Equation (8), and its solution given by Equation (10), but also suggests a graphical way of solving for τ s without explicitly writing out u(y, z) in analytical form and defining the coordinate transformation of Equation (7). Further, it is clear that the above solution for τ s and η is unique.
If one considers other possible rectilinear flow fields which satisfy the boundary condition Equation (4a), views the contour diagram of u as a topographic surface, and applies the above geometrical arguments, it is easily verified that unique solutions to τ s for Equation (5) exist as long as there are no basins (minima) either below the surface y = 0 or “dammed up” against it. (For example, this can still be so if there is more than one maximum lying on the surface or even if there is a maximum below the surface.) If this were not so, there would be two possibilities. The basin could be entirely surrounded by ridge crests, passes, and the surface y = 0. If the material behavior were compatible with Equation (1), then the region would be surrounded by shear-stress-free surfaces and could not be held in place. On the other hand, the downslope into the basin could extend all of the way to the channel boundary. Nevertheless, mechanical equilibrium would require a negative η which is not physically reasonable. One can easily contrive patterns of contours, albeit somewhat esoteric, which for these reasons are incompatible with material behavior describable by Equation (1).
Strain-rate field independent of x. Now consider the slightly more complicated case where the top surface is cylindrical with generators parallel to the x-axis (∂y s/∂x = 0), where v and w are independent of x, but not necessarily zero, and where ∂u/∂x is independent of position. In this case the strain-rate field is independent of x. In addition assume that the density is independent of x and z and that the material is rheologically homogeneous in the longitudinal direction, so that ∂η/∂x = 0. Under these conditions, Equation (4c) together with Equations (3b) and (3c) require that ∂p*/∂x = 0.
Equation (3a) again reduces to Equation (5). Under the same restrictions on the distribution of u in the cross-section discussed above, Equation (5) can be solved as before to determine τ s and η uniquely. The same physical interpretation of the procedure holds in this case, since there are no longitudinal stress gradients and the surfaces across which the shear stress is zero are cylindrical surfaces with generators parallel to the x-axis.
Equations (3b) and (4c) give

Since both η and p* have now been determined, the z-equilibrium equation (3c) must be satisfied automatically in order to have a complete solution. Intuitively, one would expect that in general this would not be the case, and that a solution would not exist for an arbitrary distribution of velocity even with the above restrictions. This is easily established by example.
General three-dimensional distribution of velocity. It is clear from the above discussion that for complex distributions of velocity, solutions for η and p* will exist only for certain compatible ones. Conditions on the velocity field which suffice to guarantee the existence of a solution to Equations (3) and (4) are not easily expressible in the general case. In addition, there is a question of uniqueness. This could be answered affirmatively for the simpler distributions of velocity, but in the general case it appears more difficult.
In spite of these unanswered mathematical questions, it is possible to proceed in a meaningful way. Instead of seeking a precise solution to Equations (3) and (4), one seeks the best solution consistent with a more specific parameterized model of the flow law corresponding to Equation (1). This sort of approach also more realistically takes into account the uncertainty which must exist in any practical measurements of the distribution of velocity. Since the velocity can be measured at only a finite number of points and each velocity measurement entails some error, it is clear that some indeterminacy is introduced. This would be so even if the actual velocity distribution were to define a unique solution for η and p* from Equations (3) and (4). Thus, it makes sense to reduce the number of unknowns from an infinite number (η and p* at each point) to a small number of free parameters in a model hopefully capable of approximating the real distributions.
Suppose the distributions of η and p* are represented parametrically as follows:


For example an appropriate form for η might be

where 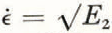 This is equivalent to a power-type flow law
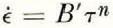 with α = 1−1/n and
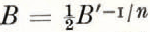 and where
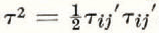 . This model for η involves two parameters (e.g. l
1 = α and l
2 = B) and also the implicit assumption of rheological homogeneity. If the rheological properties were homogeneous, one might expect that an adequate parameterization in terms of E
2 and E
3 probably involves only a few parameters. On the other hand, in a complex flow field the dependence of η on x, y and z may be very complicated and require a large number of parameters for adequate representation say as a polynomial in x, y and z. This makes it advantageous to include E
2 and E
3 in Equation (13a); x, y and z appear explicitly to make it possible to represent inhomogeneity in the material. For example, in Equation (14), B and α may depend on x, y and z as a result of non-isothermal conditions, spatial variations in texture, or other effects.
Since the distribution of strain-rate and thus E 2 and E 3 are presumed to be known from measurements, once the form of Equation (13a) has been chosen, any particular assignment of numerical values to l 1 … l m establishes a distribution of η. Similarly the distribution of p* is established when the form of Equation (13b) is chosen and values of l m+1 … l n are assigned. Thus it is possible to test whether Equations (3) and (4) are satisfied. In general, with specific choices of l 1 … l n in Equations (13), Equations (3) will not be satisfied at a given point in the interior of the body. There will be residuals r x , r y and r z to Equations (3a), (3b) and (3c). Fictitious forces —r would be needed in order to achieve equilibrium with the specific choice of parameters. Similarly Equations (4) will not be satisfied at a given point on the surface. There will be residuals s x , s y and s z . Fictitious surface tractions —s would be needed. For example, to test a flow law of form of Equation (14) with α and B independent of position, the residuals to Equations (3) can be written

where µ i = 2ė ij ∂E 2/∂ xj , and κ i = ∇2 u i . Similarly the residuals to Equations (4) can be expressed in terms of α, B and the additional free parameters associated with the pressure.
A measure of the point-wise dis-equilibrium associated with a particular choice of parameters is

From this point of view the best choice of parameters is that which minimizes F 2 and thus minimizes the residual forces in the mean-square sense. The conditions

give n equations for the n parameters l 1, …, l n .
In the application of this technique to field data, it is advantageous to consider Equation (16a) in a discrete form, so that the equilibrium equations can be considered at selected points where the strain-rates and their gradients are best determined by the measurements. Thus,

is minimized. The sums are over N distinct points in the interior and M distinct points on the surface. In this discrete form, the minimization of F′2 is identical to the usual least-squares problem. Equations (3) and (4) give 3(N + M) conditional equations to determine the n unknown parameters. When more than n of the conditional equations are independent, the n conditions ∂F′2/∂l k = 0 give n independent normal equations which determine the parameters l 1, …, l n .
If η and p* are linear functions of the l k , then the conditional and normal equations are linear and define a unique solution. If on the other hand they are non-linear functions, the conditional and normal equations are also non-linear, which complicates the solution. The non-linear normal equations can be solved by successive approximation which substitutes a sequence of linear problems for the non-linear one. One considers incremental changes from given values of the l k . Then

can be expressed in a form linearized with respect to the δl k by a Taylor expansion truncated at first order. The δl k are chosen to minimize F′2 and an improved solution l k + δl k is obtained. The process is repeated to calculate new increments and a further improved solution until convergence to the desired accuracy is achieved. When the conditional and normal equations are non-linear, one is not assured of a unique solution for the l k . It is advisable to test this by solving for the l k using several starting trial solutions to see if the converged result is always the same. In addition F′2 should be calculated in each successive step in order to make sure that the solution corresponds to a minimum and not some other stationary point.
The root-mean-residual force is a measure of the fit of the model to the observational data. When measurement errors are taken into account, it provides a basis for a decision concerning the applicability of a specific model and comparison of different possible models.
Stress and viscosity in Athabasca Glacier
It is possible to apply some of the methods described in the previous section to measurements of the distribution of velocity measured over one year (1966–67) in a transverse section of Athabasca Glacier (Reference RaymondRaymond, 1971[b]). The arrangement of the surface markers and bore holes by which velocity was measured is shown in Figure 2. The holes were in three adjacent transverse sections denoted by C, A and B. The spacing of the holes is about 150 m or one half the center-line depth. The (x, y, z) coordinate system is shown in Figure 2. The x-axis has azimuth N37° E and plunge 3.9°. Longitudinal surface slopes at the different holes are listed in Table I. These values represent averages over a length about equal to the center-line depth (300 m).


Figure 3 shows examples of the component of tilt in the x−y plane as measured after one year in the initially vertical holes. Negative tilt corresponds to tilting in the down-glacier direction. With this sign convention the rate of tilting has the same sign as ∂u/∂y which is the main contribution to the tilting rate. The scatter in the data is compatible with possible experimental errors associated with the boring and measurement procedures (Raymond, unpublished). Therefore, the scatter is probably experimental noise and does not represent real features of the flow field. The tilt data were smoothed (shown as solid curves in Figure 3) by a method described by Reference RaymondRaymond (1971[b]). The smooth depth profile of tilting in the x−y plane is shown for each bore hole in Figure 4. Successful measurements were made over essentially the complete glacier depth in all holes except holes 1C and 4A, in which cases the hole could not be completely recovered after one year or could not be initially penetrated to the bottom.


The progressive increase in tilting magnitude accompanied by a monotonic increase in curvature convex to the depth axis which would be expected in a zone of non-zero longitudinal strain-rate (Reference NyeNye, 1957) is seen only in hole 3A. The other tilt profiles show definite deviations from this “ideal” shape. In some holes, positive rate of tilting exists at the surface (e.g. 1B, 2B, 3B), the rate of tilting does not change with depth for a significant distance below the surface (e.g. 1B, 3B), and locally the tilt profiles can be concave toward the depth axis (e.g. 1A, 2A). The nearly depth-independent rate of tilting in the lowermost 40 m of hole 2A is particularly striking. At the other extreme holes 3B and 5A show extremely high depth gradients in tilting rate near the bottom. These features also exist in the profiles of ∂u/∂y which are essentially the same as the tilting-rate profiles except for small corrections arising from contributions to the tilting rate from gradients of velocity other than ∂u/∂y. Positive tilting at the surface, corresponding to u increasing with depth, has been observed and explained in terms of a non-zero rotation rate by Paterson and Reference Savage and PatersonSavage (1963). The other features and also the distinctly different profiles for the different holes imply that either the state of stress in the glacier is quite complicated or the ice is to some extent rheologically inhomogeneous. For example, the bottom of hole 2A is located in a zone of relatively high basal velocity (Reference RaymondRaymond, 1971[b], p. 71). This suggests that the anomalous trend of tilting near the bottom of this hole represents a locally relaxed shear stress caused by a narrow zone in which resistance to sliding is abnormally low.
The method by which the displacement of surface markers and the bore-hole tilt measurements were treated to determine the depth distribution of u, v and w, and the x, y and z gradients of u and w and the accuracy of these quantities is discussed in detail by Reference RaymondRaymond (1971 [a]). The y gradient of v was determined from incompressibitity (∂v/∂y = −∂u/∂x−∂w/∂z). The x and z gradients of v were taken to be independent of y, which is compatible with the depth distributions of v calculated in adjacent bore holes. The values for ∂v/∂x and ∂v/∂z at each bore hole were chosen so that  and
 were both zero at the surface, which is a necessary condition for the ice behavior to be compatible with Equation (1). Figure 5 shows an example of the depth distribution of the components of strain-rate in the x, y, z coordinate system as given by the computed velocity gradients, In addition, the effective strain-rate
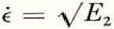 is also shown. The distribution of u, v, w, and ∂u/∂x over the area of sections A and B is given by Reference RaymondRaymond (1971 [b], p. 69–70).

The following analysis is directed toward examining whether the ice rheology can be described adequately by a single power law, Equation (14), which applies to the complete volume covered by the measurements. This is a common assumption made in the theoretical analysis of the flow of temperate glaciers (e.g. Reference NyeNye, 1957). One might expect it to apply to Athabasca Glacier, which is very close to the melting point and nearly isothermal except in the 20 m just below the surface in the ablation zone (Reference PatersonPaterson, 1971). On the other hand, this assumption could possibly break down as a result of spatial variations in the ice structure.
In the analysis, ice density is assumed to be independent of position and equal to 0.90 Mg m−3. Since this portion of Athabasca Glacier is well into the ablation area, the ice density should be relatively homogeneous in contrast with what would be expected in the accumulation area.
Calculation of stress assuming x-independent strain-rate field. Since the slope of the glacier surface in the x direction varies from place to place (Figure 2, Table I), it is impossible to chose a cartesian coordinate system such that ∂y s/∂x = 0. In addition, ∂u/∂x is not constant throughout the volume, and ∂v/∂x and ∂w/∂x, although small, are not zero where the measurements were made. Thus the method of analysis developed in Equations (5) through (12) does not precisely apply. Nevertheless it is still worth while to solve for the stress as if these difficulties were absent; at least this should yield a more reliable determination of stress than the standard assumption made in past analyses of bore-hole data that

In Equation (17), f is the “shape factor” equal to A/PH where A is the cross-sectional area of the section, P is the length of the ice-rock boundary, and H is the center-line depth. The value of f for these sections of the Athabasca Glacier is 0.58.
The distribution of u determined in sections A and B is shown in Figure 6. Curves constructed normal to the contours of constant u are also shown. A first approximation to the solution can be seen by noting that the velocity contours are approximately semicircular and the characteristics are radial at least in Section A. Thus, t and n can be chosen to correspond to r and θ of circular-cylindrical coordinates:

In this case h t = 1 and h n = 1/r and the solution to Equation (8) is easily shown to be τ = ρg x r/2, which is a result previously established by Reference NyeNye (1952) for flow in semicircular channels with constant basal velocity. Further,

This is similar to the distribution of τ xy assumed in the standard analysis except the factor is 16% smaller.

In the event that the surface does not lie on the y = 0 plane or does not parallel the x-axis, Equation (18a) can be generalized. This can be expressed by taking ( x , ȳ, z ) coordinates such that z is parallel to z, but x parallels the surface. Then,

With this distribution of stress, viscosity can be calculated from

where δ x is the difference in plunge of the x and x axes. In Equation (18b) τ x ȳ → 0 as ȳ → ȳ S. Since the lateral slope of the surface is small at all of the bore-hole sites, the difference between this and the natural boundary condition, Equation (4a), is negligible and no significant error is introduced by employing the simpler transformation of Equations (19).
In accordance with the analysis of Reference Shreve and SharpShreve and Sharp (1970, p. 83) log [η/(bar a)] as given by Equation (19) has been plotted against  along the length of each bore hole. This has been done with stress estimated at each bore hole using the slope at 1A near the center line (δ
x
= 0.0), the slope averaged over the width of the array (δ
x
= −0.5°), and the local surface slope at each bore hole (δ
x
from −1.1° to +0.1°). If Equation (18b) with the chosen value δ
x
is an adequate representation of stress, and if the ice is rheologically homogeneous and Equation (1) holds with η independent of E
3, then the curves for all of the bore holes should coincide and would define the dependence of η on
 . If the power-law dependence Equation (14) applies, the curves should be straight lines with slope equal to −α.
Figure 7 shows the results for each bore hole with δ
x
= 0.0. Shallow depths correspond to the upper left parts of curves (large η, small  ). Points corresponding to depths of 100 m and 200 m are marked with solid and open circles respectively. The curves for the other choices of δ
x
are similar to those shown in Figure 7. A plot based on the laterally-averaged surface slope (δ
x
= −0.5°) corresponds to a shear-stress magnitude lower by a factor of 0.87 which results in an apparently lower viscosity by approximately the same factor and an equal downward shift of all of the curves by 0.06. In a plot based on the local surface slopes some of the curves are shifted downward by as much as 0.14 (e.g. 3A and 5A, δ
x
= −1.1°) while others are essentially unshifted (e.g. 1A). Thus, in this case there is considerably greater disagreement between the curves for the deeper parts of the different bore holes than exists in Figure 7. This suggests that the stress deep in the glacier is best computed from a single surface slope rather than local slopes. Since Equation (18b) more closely approximates the boundary condition Equation (4c) when δ
x
corresponds to the local surface slopes, this alternative may give a better representation of stress near the surface. Also near the surface the difference between ė
x
ȳ
and ė
x
y
becomes significant; ė
xy
does not go to zero at the surface when the local surface does not parallel the x-axis. For negative δ
x
, as exists at holes 1B, 3A, 3B, 4A and 5A, ė
xy
reaches zero below the surface and is positive at the surface, because of the compressive longitudinal strain-rate. This contributes to the strong upturn of the near-surface parts of the curves in Figure 7. The upturn is distinctly reduced for the curves computed from local slopes, but not completely eliminated except in the case of 3A. Holes 1B, 2B and 3B still go off scale (log [η/(bar a)] > 1.80]) at respective depths of 90 m, 32 m and 75 m.

Although there are complex features in Figure 7, the approximately linear curves shown by the deeper range of each bore hole and the linear trend defined by the combined data from all of the holes are suggestive of a power law.
For comparison, power laws derived by some previous laboratory and field experiments are shown in Figure 7. The trend defined by the present observation as analysed by Equations (18) and (19) agrees quite well with the results of Reference Savage and PatersonPaterson and Savage (1963, p. 4541), but it is displaced perceptably toward lower viscosity. This difference would be entirely absent if the standard shape factor of 0.58 rather than 0.50 has been used in Equation (16b). Based on Equations (18b) and (19) with δ x = 0, the conclusion of Reference Savage and PatersonPaterson and Savage (1963), p. 4542) that the viscosity in the Athabasca Glacier is greater than would be expected from Glen’s flow law measured at −0.02° C is confirmed, although the disparity is not so large as they supposed. Power-law parameters deduced from fitting a straight line by eye to the general trend are α = 0.77 (n = 4.3) and B = 0.98 bar a1−α . If it is assumed that the proper surface slope for the estimation of stress is the laterally averaged slope (3.4°), then the disparity between the present data and Glen’s law is further reduced. The flow parameters given by this surface slope are the same except that B is reduced by a factor of 0.87.
Flow-law parameters can also be calculated for the different bore holes considered separately for those cases which yield a nearly linear curve over a significant depth range. If this depth range is arbitrarily taken to be 50 m this includes all holes except 1C, 2B and 4A. The spread in ƞ given by the separate curves at  is about ±5%. At lower
 the spread in the curves increases, which corresponds to a difference in slope (i.e. α or n) for the various linear segments. Holes 1A, 1B, 2A, 3A, 3B and 5A give respective slopes corresponding to α(n) equal to 0.82 (5.6), 0.67 (3.0), 0.56 (2.3), 0.86 (7.1), 0.98 (50), 0.69 (3.2). Assuming that Equation (18b) is valid, it is possible to roughly estimate a standard error for α or n as determined in a single bore hole. This depends on the length of the depth range over which the curve in Figure 7 is linear (Table I) and the standard errors in ė
xy
and ∂ė
xy
/∂y which are 0.003 a−1 and 0.0002 a−1m−1 (Raymond, unpublished). Such an estimate is not entirely straight forward because the errors in ė
xy
and
 at a given depth are not independent, and the errors in either of these two quantities at different depths are not independent, because of the smoothing operation which was applied to the data. Taking these factors into account the uncertainty in n is about 25% when the depth range which shows a linear curve is near 50 m (e.g. hole 1A) or about 15% when the depth range is near 100 m (e.g. holes 3A and 3B). Although the errors associated with the measurement in strain-rate are quite large, they cannot account for the different slopes of the curves. However, this estimate of errors does not take into account possible failure of Equation (18b).
The steep upturned portions of the curves in Figure 7 correspond to depths down to  to
 of the maximum depth and climb to very high values of viscosity close to the surface. In terms of an expected power-law behavior this represents an apparent anomaly. It arises because near the surface
 is controlled mainly by
 and
 and tends to be relatively independent of depth (e.g. Fig. 5), but on the other hand ƞ as given by Equation (19) is proportional to (y − y
s)/ė
xy
, which increases markedly toward the surface. The latter effect arises because ė
xy
remains nearly zero for a considerable depth below the surface (e.g. Fig. 5). This is an expression of a nearly depth-independent rate of tilting observed near the surface in most of the holes and especially those in section B (Fig. 4).
It is possible that this is caused by the large relative error in ė xy near the surface where ė xy approaches zero. The error could be systematic as a result of the representation of the data by smoothing curves. Because of the overall concave nature of the tilt profiles and edge effects associated with the absence of data above the surface, any smoothing procedure would tend to bias the near-surface part of the profiles to be concave also, and thus to be more depth-independent than in reality. This has been tested by plotting the annual tilting for each bore hole (e.g. dashed curves in Figure 3) calculated from the distribution of ∂u/∂y which would be expected if the power law deduced from the deeper depth range of the hole applied to the complete depth range. For this calculation it was assumed that all of the other velocity gradients were the same as determined from the measurements. In the case of hole 1B (Fig. 3) the trend of the measured tilting is quite different than expected on this basis. This is also definitely the case for 3B and seems to be so for 2B. On the other hand the dashed curve for 3A is reasonably compatible with the measured tilting (Fig. 3). This conclusion is also reached with respect to the other holes in section A. Thus, in section B the effect does not represent a bias introduced by the smoothing operation. The steep near-surface portion of these curves in Figure 7 is a real feature which needs explanation. On the other hand the data for holes in section A are ambiguous on this point. If such an effect really does exist in these holes, it is certainly much weaker than in the holes of section B. The one hole in section C shows no evidence of such an effect.
Since Figure 7 shows considerably greater viscosity in section B than in section A at equivalent depth near the surface, a contribution to the longitudinal stress gradient ė xx ∂ƞ/∂x would exist. In fact, this contribution would be substantially larger than ρg x , which suggests that the distribution of ƞ given by Equation (19) is not realistic near the surface. One is again led to suspect the validity of Equation (18b). A distribution of |τ xv | increasing more slowly below the surface than given by Equation (18b) would reduce or eliminate the anomaly.
The obvious next step is to calculate stress by the analysis based on Equations (5) to (12) but using the correct shapes of the contours of constant u rather than approximating them by semi-circles. Figures 8a and 8b show the solutions for τ s derived graphically from Equation (11) based on the surface slope at hole 1A. As before a solution based on the laterally averaged surface slope is obtained by multiplying by 0.87.
The accuracy of the solution, assuming that the conditions for the validity of Equation (11) actually exist, is difficult to assess. Even if the pattern of velocity shown in Figure 6 were precise, certain errors arise in the solution of Equation (11). The trajectories of characteristics are somewhat ambiguous because of the finite spacing of the contours. In both sections there is no direct control on the shape of contours and thus the path of characteristics near the center line because this region is between bore holes. Further the center line cannot be precisely located. A maximum error of about ±0.05 bar arises from these sources. The error in τ s which arises from the uncertainty in the measurement of velocity across the surface and with depth in the bore holes (0.20 m a−1 at surface, 0.46 m a−1 at bottom) and the additional uncertainty associated with drawing the contours between the bore holes is very difficult to quantify.
Equation (11) was also solved by including the contribution ρg
y
∂y
s/∂
x
to the body force of Equation (3a) in the subsequent Equations (5), (10) and (11). This amounts to having a laterally varying body force which depends on the local surface slope. Such a variable body force is easily incorporated into the solution. If the surface slope varies linearly between the center line of flow and a point of interest one is led to the interesting conclusion that the proper surface slope for the calculation of stress at that point is the slope which exists at about  of the way between it and the center line. This is a consequence of the nearly triangular shape of the regions over which body force is integrated. If the curves of Figure 7 are adjusted according to this concept rather than the local slope, the adjustments are significantly smaller (except in the case of hole 5A) and there is considerably less disagreement between the curves for different bore holes. This to some extent explains why the results from different bore holes are more consistent when they are analysed using the same surface slope. However, there is an additional consideration. On a straight glacier a lateral variation of longitudinal surface slope must also be accompanied by a longitudinal variation, since on the average the longitudinal slope is about the same near the margins as at the center. Therefore, laterally varying longitudinal stress gradients probably exist, and these may compensate any effects arising from lateral surface slope variation as derived from Equation (11). This may be a more fundamental reason for the comparatively good agreement between the curves as plotted in Figure 7. It suggests further that the solution for τ
s based on a single slope as shown in Figures 8a and 8b may be more valid than one based on a laterally varying body force.
In Figures 8a and 8b the contours of constant τ s deviate significantly from the semi-circular shapes they would have if the velocity contours were precisely semicircular as assumed in the derivation of Equation (18a). Furthermore, Figure 8c shows that the distribution is considerably different than calculated by Reference NyeNye (1965, p. 680). A parabolic channel with half-width twice the depth (width ratio 2) is a good approximation to the Athabasca Glacier cross-section. Nye’s calculations were based on the assumptions of a homogeneous power-law rheology (n = 3), rectilinear flow, and sliding velocity independent of position. This latter assumption is certainly not applicable in Athabasca Glacier as is visible in Figure 6. As a consequence, considerable differences between Nye’s theoretically derived distributions of velocity and stress are to be expected. Some aspects of this have been discussed previously (Reference RaymondRaymond, 1971 [b]).

The distributions of τ xy versus depth at the center line and τ xz versus z across the surface as derived from Figures 8a and 8b are shown in Figures 9 and 10. The overall depth dependence of τ xy is compatible with a shape factor of 0.50; however, near the surface |τ xy | increases with depth more slowly in accordance with a factor of about 0.3 to 0.4. Correspondingly the variation of |τ xz | across the surface near the center corresponds to a factor of about 0.6 to 0.7. In terms of the small-scale variation of stress near the center line at the surface and an overall view of the complete section, shear-stress magnitude computed from Equation (11) increases less rapidly with depth at the center line and increases more rapidly with lateral position along the surface than computed by Reference NyeNye (1965) as shown in Figures 9 and 10. (For this comparison, stress has been calculated from Nye’s non-dimensional stress using a surface slope of 3.9° and a depth of 300 m.)


Figures 9 and 10 also show the corresponding distributions of |τ xy | and |τ xz | computed directly from the observed strain-rate and a homogeneous power law with α = 0.72, B = 1.03 bar a1−α . (These parameters are given by the least-squares analysis discussed in the next section and are in good agreement with Glen’s law.) From Figure 9 it is apparent that |τ xy | so calculated increases below the surface even more slowly than given by Equation (11). This shows that the near-surface anomaly discussed with respect to Figure 7, is somewhat reduced but not completely accounted for by the stress distribution given by Equation (11). The comparison shown in Figure 10 indicates that a similar anomaly would be associated with calculation of viscosity across the surface by ƞ = τ xz /2ė xz when τ xz is given by Equation (11). It is noteworthy that for stress given by the homogeneous power law, ∂τ xy /∂y and ∂τ xz /∂z sum to considerably less than the acting body force in the x direction (about 0.7 ρg x in section A and 0.4 to 0.5 ρg x in section B). This indicates that a substantial longitudinal stress gradient would be required for mechanical equilibrium, if the homogeneous power law behavior were applicable.
For the purpose of estimating flow-law parameters, ƞ can be calculated from

Figure 11 shows log [ƞ/(bar a)] plotted against 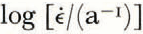 . The curves for the various bore holes are similar to those shown in Figure 7. However, except for 1A and 5A the curves are displaced downward relative to their positions in Figure 7. Because of this the general trend defined by the curves of Figure 11 gives somewhat lower viscosity in comparison to Figure 7. If the laterally averaged surface slope is used in the analysis, so that all of the curves are displaced downward by an additional distance 0.06, the trend is no longer distinguishable from Glen’s flow law (n = 4.2, T = −0.02° C) except there is some suggestion that it is not so steep, which corresponds to lower n. If the analysis is based on a laterally varying body force computed from the local surface slope, one arrives at a similar conclusion, the individual curves still scatter about the line representing Glen’s law. However, 5A is displaced downward to a greater extent than other holes, which results in a steeper trend corresponding to n somewhat higher than in the Glen flow law.

The slopes of the approximately linear segments for the individual curves in Figure 11 have a similar range (α equal 0.51 to 0.97) as exists in Figure 7. A surprising difference is that in the deeper ranges the curves for the different bore holes shown in Figure 11 do not agree with one another as well as in the simpler less rigorous analysis of Figure 7. By redrawing the contours of constant velocity within the error bounds of velocity measured at the bore holes and reasonable interpolation between holes, it is possible to achieve local changes in stress of up to 0.2 bar. This suggests the different curves could be brought into closer agreement by choosing a different pattern of contours which is compatible with the measurements. Because of the great amount of computation involved, only a few trials were attempted and no such pattern was found. Nevertheless this remains a distinct possibility particularly near the bottom where bedrock features could cause significant local variations in flow. In any case, the details of the contour shapes are not so well established that any definite conclusions can be drawn concerning the disagreement between the individual curves.
On the other hand, the general trend established by all of the curves cannot be significantly changed simply because gross equilibrium requires that a local change in τ s is accompanied by a compensating change in τ s elsewhere. The general pattern of velocity in the glacier is sufficiently well established so that the general downward displacement of the curves in Figure 11 in comparison to those in Figure 7 is probably a real effect.
The curves do not show steep upturned portions for near-surface data as strongly as exists in Figure 7. This effect has been eliminated almost entirely for holes 5A and 4A and greatly reduced in the section B holes, but there is still a residual effect for those bore holes near the center. This is reasonable since small absolute errors in either the measured strain-rate components or the computed stress manifest themselves as large relative errors in ƞ as computed by Equation (20) only near the surface at the center line where ė s and τ s go to zero. Since the viscosity at the surface given by Equation (20) is essentially τ xz /2ė xz , the residual upturn of the curves and its systematic dependence on the bore hole position relative to the center line represents the anomaly anticipated in Figure 10. The largest relative error in ė xz at the surface for any of the holes is about 30%. Perhaps the upturn could be explained on this basis, but the systematic nature of the effect suggests that it does not represent an error in the measurement of strain-rate. Also the error in the solution for stress from Equation (11) caused by uncertainty in the position of the center line, the contour shapes, and the characteristic trajectories cannot account for this effect, because any adjustment in these factors only leads to a local redistribution of stress. It is reasonable to suppose that some of the remaining conflict between the apparent rheology inferred from the measurements and the homogeneous power law behavior which one might hope for, can still be attributed to errors in estimating stress which arise because of the three-dimensional character of the flow field.
Before proceding, a few comments are in order concerning the possibility of solving the y-equilibrium equation for p* as in Equation (12) and also testing whether the z-equilibrium Equation (3c) is also thereby satisfied. Clearly the distribution of given by Equation (3a) through solution of Equation (11) is subject to considerable uncertainty. Also, because of the indirect manner in which v is determined at depth and the complex distribution of w (Reference RaymondRaymond, 1971 [a]), ∇2 v and ∇2 w are very imprecisely known. For these reasons, such a test would not be very indicative even if the flow were such that the analysis applied rigorously.
Minimization of residual forces. In order to establish the conditional and normal equations for choosing the best values of B and α and testing the applicability of a homogeneous power law in terms of residual forces, it is necessary to evaluate the coefficients μ i and κ i in Equation (15), As already mentioned, κ y = ∇2 v and K z = ∇2 w are very poorly determined by the measurements. For this reason Equations (3b) and (3c) have not been included in the analysis. Equations (4a) and (4b) are automatically satisfied because of the way ∂v/∂x and ∂v/∂z were chosen and thus contribute no information to the analysis. This leaves only the x-equilibrium equation and Equation (4c).
Without Equation (3b) there is no basis for determining p* at depth. However, p* and ∂p*/∂x can be determined at the surface from Equation (4c). If B and α have values which correspond to Glen’s law, then Equation (4c) shows that ∂p*/∂x at the surface is less than 10% of ρg x (= 0.592 × 10⁻² bar/m); ∂p*/∂x is positive except at 5A and 1C. The small values of ∂p*/∂x are a consequence of the very low longitudinal gradients of the surface strain-rate components (less than 0.2 × 10⁻⁴ a−1 m−1 in the area of the bore-hole array). The small differences between ∂p*/∂x computed at the different bore holes are not much larger than could be expected from measurement errors. For these reasons a model for p* more complicated than a linear variation in x does not seem justifiable so that ∂p*/∂x enters as a space-independent body force. For convenience ∂p*/∂x has been taken to be 0, thus eliminating Equation (4c) and the ∂p*/∂x contribution to Equation (3a) from the analysis. This simplification does not affect the value of α (or n) given by the analysis. Because of the generally positive value of ∂p*/∂x, the resulting value of B will be too large by about 5 to 10%, which can easily be taken into account subsequently. (Since ė zz is small at the surface (Reference RaymondRaymond, 1971 [b], p. 64), p* = 2ƞė yy ≈ −2ƞė xx = −T xx ′, it also is possible to state that the total longitudinal stress gradient at the surface, neglecting the contribution from the gradient in overburden which exists when the surface and the x-axis are not parallel, is less than 20% of ρg x . This is of the same order as the longitudinal variation of surface slope, as would be expected from the analysis by Reference BuddBudd (1971, equation (59)).
In order to form a discrete set of conditional equations,

and κ x = ∇2 u were calculated at 5 m depth intervals at each of the bore holes. The x and z gradients of E 2 at a given depth were calculated using simple differences in the computed value of E 2 at the bore-hole locations at that depth. These gradients could be estimated over the full depth range of all of the bore holes except ∂E 2/∂x at 4A and 5A, where there were no longitudinal pairs of holes. At 4A and 5A ∂E 2/∂x was taken to be 0.
∂ 2 u/∂x 2 and ∂ 2 u/∂z 2 were computed at each depth from a polynomial interpolating function fit to the values of u measured at that depth in each of the bore holes. (See Reference RaymondRaymond, 1971 [a] for a complete discussion of the interpolating procedure.) All of these quantities are subject to uncertainty because of possible interpolating errors. This is especially so for ∂ 2 u/∂x 2 which is controlled by direct measurement only at the surface, where there was an extensive surface strain grid, and in the uppermost 200 m of hole 1A, which had adjacent bore holes both up- and down-glacier (Fig. 2). Below 200 m ∂2 u/∂x 2 was extrapolated, and the difference between ∂ 2 u/∂x 2 at the surface and at depth was taken to be independent of x and z. Interpolation errors in ∂ 2 u/∂z 2 may be particularly significant at holes 3B, 2B and 5A and at hole 2A below 100 m, because these locations were on the lateral margins of the array (Fig. 2). Calculation of ∂E 2/∂y and ∂ 2 u/∂y 2 was by simple differences between values spaced at 5 m depth intervals.
At this point it is important to recognize that the data are not adequate to take the longitudinal stress gradients into account completely. The contributions from ∂p*/∂x and ∂ 2 u/∂x 2 are uncertain over the deeper portions of all bore holes. Only the contribution from ė xx ∂ƞ/∂x is reasonably determinable over the complete depth ranges.
The residuals to the x-equilibrium equation can be minimized in the least-squares sense over any set of points chosen from the points spaced at 5 m intervals along the bore holes where μ x and κ x were calculated.
When the residuals at only the points on a single bore hole are minimized, the analyses for the different bore holes give a range of parameters as was the case in the earlier analyses. Excluding holes 1C and 4A, in which  does not vary significantly over their respective depths, these analyses give α from 0.53 to 1.07 and B from 0.50 to 2.2 bar a−1α
. The root-mean- square (r.m.s.) residual force for these analyses is typically between 0.3 and 0.4 in units of ρg
x
. If these analyses are restricted to the depth ranges for which the curves of Figure 7 are linear, the analyses give α from 0.61 to 0.83 and B from 0.50 to 1.87 bar a1−α
. In these cases the r.m.s. residual force ranges from 0.07 to 0.33 ρg
x
. The large spread in B is mainly a consequence of extrapolating to
 with different slopes α. However, the spread in the graphical representations as visualized in a plot such as Figures 7 or 11 is greater than shown by the curves in either Figures 7 or 11. When the analyses are restricted to the lower portions of the bore holes the spread in α is less than is measured from the slopes of curves in either Figures 7 or 11.
When the analysis is done for the complete depth range of all of the holes taken together, the result is α = 0.72 (n = 3.6) and B = 1.03 bar a1−α
. The relationship between ƞ and  corresponding to these parameters is plotted in Figure 11. It agrees well with the trend defined by the various curves based on stress as calculated from Equation (11). It gives viscosities which are only slightly higher than expected from Glen’s law (n = 4.2). The r.m.s. residual force in units of ρg
x
is 0.40. The standard errors given by the least-squares analysis are 0.02 for α and 0.06 bar a1−α
for B. However, these cannot be interpreted as standard error for α and B because the least-squares analysis was carried out using flow quantities derived from the smoothed tilt profiles. The actual standard errors may be larger. In view of the large spread in the parameters deduced from the analysis of single bore holes, the deviation of this flow law from Glen’s law is probably not significant. Further if B is reduced by 10% (log [ƞ/(bar a)] by about 0.05) in accordance with the values of ∂p*/∂x measured at the surface, the deviation from Glen’s flow law becomes entirely negligible.
The r.m.s. residual force of 0.40 ρg x would seem to indicate that a power law applied homogeneously to the whole ice volume is a poor representation. However, residual forces as large as 15 to 20% of ρg x could occur as a result of errors in the measurement of velocity at the bore-hole sites and their direct effect on the calculated strain-rate components and their gradients. The less definable error in the strain-rates and their gradients caused by possible incorrect interpolation between the bore holes could add significantly to the residuals. Further, the omission of ∂p*/∂x in the analysis and the likelihood that this quantity exhibits some variation in the volume of the bore-hole array may contribute to the residuals. Consequently the large residuals do not provide definite evidence that the least-squares-derived flow law is not a good one.
One interesting feature of the distribution of residual forces is that all of the bore holes show positive residual forces near the surface. The values at the surface range from 0.23 to 0.74 ρg x with hole 1C showing the smallest residual and the residual of section A averaging somewhat less than in section B. This is a manifestation of the near-surface anomalies discussed with respect to Figures 7 to 11. The more complete three-dimensional analysis has failed to eliminate this anomaly. The neglected contribution to equilibrium of ∂p*/∂x is quantitatively too small to account for the effect. However, some features of the distribution of longitudinal strain-rate would tend to produce the systematic differences which exist between the different sections. Figure 12 shows the distribution of ∂u/∂x on the surface along a line passing through 1C, 1A and 1B. Although the fluctuations in ∂u/∂x are of the same order of magnitude as the measurement errors, ∂u/∂x seems to be relatively tensile down-glacier at 1C, exhibit no gradient at 1A, and be relatively compressive down-glacier at 1B. Thus, the sense of ∂p*/∂x (and also ∂τ xx ′/∂x) seems to be in the proper direction to produce the observed effects. In view of the large residual forces which exist at all depths it seems reasonable to attribute the near-surface effects to longitudinal stress gradients even though they do not seem to give a quantitative explanation. Possible alternative rheological explanation must be somewhat hypothetical. Because of the discernible differences between the three sections, such explanations would seem to require some longitudinal inhomogeneity in the ice.

Summary and conclusions. The distribution of stress in Athabasca Glacier differs substantially from stress at the center line computed by a standard shape factor or the distribution computed by Reference NyeNye (1965). The major cause of these differences is a basal velocity which varies laterally across the section in contrast to zero basal velocity assumed by Nye. There is also evidence that non-zero longitudinal stress gradients exist and contribute to this difference.
The techniques of this paper for estimating rheological parameters take account of these differences to varying degrees. Imprecision and lack of resolution in the determination of the velocity field cause some uncertainty in the results. When the flow field is analyzed under the assumption of x-independence, a significant question causing additional uncertainty is the proper choice of surface slope when this slope varies laterally and longitudinally. This question can be avoided using a complete three-dimensional analysis, but this has not been entirely possible in this case, because of insufficient control on the longitudinal variation of velocity. The techniques give effective viscosity which is smaller than would be obtained by estimating shear stress using a standard shape factor or the theoretical distribution of Nye. Taking account of the above sources of errors, the overall ice behavior is not significantly different from the flow law of Reference GlenGlen (1955) based on Andradean analysis of his experimental creep curves.
Glen’s experimental data analysed for Andradean creep extend down to uniaxial stress of about 1.5 bar which corresponds to an effective stress τ of 0.9 bar and an effective strain-rate  of 0.06 a−1 or
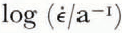 of −1.2. Thus, the comparisons shown in Figures 7 and 10 correspond to the lower stress range of Glen’s experiments and an extrapolation to even lower stress. The deformation in Athabasca Glacier support the validity of such an extrapolation down to about 0.5 bar. However, the lower limit of stress for which such an extrapolated curve remains valid cannot be determined because of the anomalous near-surface behavior of the deformations. Irrespective of this question, the measurements in Athabasca Glacier demonstrate the importance of correcting creep experiments at low stress to account for transient effects. The measurements are clearly incompatible with the relationship between minimum creep and stress reported by Glen (Figures 7 and 10). This is in agreement with conclusions recently reached by Reference ThomasThomas (1971) from measurements of deformation on ice shelves and comparison with experiments reported by Reference Tabor and WalkerTabor and Walker (1970).
Unless there is a fortuitous cancellation of opposing factors the agreement between Glen’s flow law and the deformations in the Athabasca Glacier implies that there is no major effect of a special ice structure. However, variations in ice structure may be the source of some of the apparent variation in ice behavior seen in Figures 7 and 11 and implied by the large residuals to the x-equation of equilibrium evaluated with a homogeneous power law. This possibility has been cited in the past to explain differences between various observations (e.g. Reference NyeNye, 1953, p. 497; Reference Kamb and ShreveKamb and Shreve, 1966; Reference Shreve and SharpShreve and Sharp, 1970, p. 84). Unfortunately, the accuracy and density of velocity measurements in Athabasca Glacier are still not sufficient to determine the detailed features of the stress distribution and to draw any definite conclusions as to the reality of the apparent discrepancies. It is hoped that the techniques described in this paper have the potential for a quantitative approach to these questions.
Acknowledgements
It is a pleasure to acknowledge many helpful discussions with Professor Barclay Kamb. I also wish to thank the Canadian Government for permission to work in Jasper National Park and W. Ruddy and Chester Kongsrude of Snowmobile Tours, Ltd., for logistical support. This work was supported by the National Science Foundation.



