





1. Introduction
An important class of non-equilibrium flows commonly encountered in engineering applications is wall-bounded turbulent flows subjected to abrupt perturbations, such as changes in surface roughness, the presence of surface-mounted obstacles or steps, suddenly imposed pressure gradients and/or surface curvature and flow divergence. Such flows often exhibit complex behaviours that are not well understood, and are typically not captured well by Reynolds-averaged Navier–Stokes (RANS) methods. For example, where the disturbance is localised near the wall, such as in an abrupt change in roughness, the response is characterised by the formation of an internal layer that grows at a rate that depends on the local time scale of the turbulence, and so it grows fast initially, and ever more slowly as it expands into the outer region (Antonia & Luxton Reference Antonia and Luxton1971, Reference Antonia and Luxton1972; Smits & Wood Reference Smits and Wood1985). Other kinds of disturbances are predominantly observed in the outer region. For example, the imposition of concave curvature can cause the turbulence to collapse in the outer layer to levels that are below the equilibrium state, before a very slow relaxation to reach the equilibrium level far downstream (Smits, Young & Bradshaw Reference Smits, Young and Bradshaw1979): a kind of second-order response. In the case of obstacles placed on the surface or steps in elevation, the flow first separates and then reattaches, a process that has long represented a major challenge for turbulence modelling and prediction (Good & Joubert Reference Good and Joubert1968; Bradshaw & Wong Reference Bradshaw and Wong1972; Eaton & Johnston Reference Eaton and Johnston1981; Westphal, Johnston & Eaton Reference Westphal, Johnston and Eaton1984; Castro & Haque Reference Castro and Haque1987; Adams & Johnston Reference Adams and Johnston1988; Le, Moin & Kim Reference Le, Moin and Kim1997; Tomas, Pourquie & Jonker Reference Tomas, Pourquie and Jonker2015; Mohammed-Taifour & Weiss Reference Mohammed-Taifour and Weiss2016; van der Kindere & Ganapathisubramani Reference van der Kindere and Ganapathisubramani2018).
Here, we are interested in the response of turbulent pipe flow to a square bar roughness element of varying height. The square bar initially causes the flow near the wall to separate with the formation of a strong shear layer, followed by reattachment to the wall. The phenomena of separation and reattachment in a wall-bounded flow have been extensively studied in the past, with typical geometries including backward-facing steps and surface-mounted obstacles. An important characteristic of such flows is that the turbulence development in the separated shear layer scales with the reattachment length (Westphal et al. Reference Westphal, Johnston and Eaton1984; Durst, Founti & Wang Reference Durst, Founti and Wang1989). In this respect, numerous studies have been conducted to understand the effects of various parameters on the reattachment length (see Kuehn Reference Kuehn1980; Armaly et al. Reference Armaly, Durst, Pereira and Schönung1983; Adams & Johnston Reference Adams and Johnston1988; Ötügen Reference Ötügen1991, among others). There are also a large number of studies focusing on other features in the separation and reattachment regions, including form drag (Good & Joubert Reference Good and Joubert1968), turbulence length scales (Bradshaw & Wong Reference Bradshaw and Wong1972; Castro Reference Castro1979), unsteady flapping motion in the recirculation bubble (Mohammed-Taifour & Weiss Reference Mohammed-Taifour and Weiss2016) and vortex dynamics (Kostas, Soria & Chong Reference Kostas, Soria and Chong2002).
In contrast, the flow relaxation downstream of the reattachment point has received relatively less attention. One striking feature of the relaxing flow is the sustained collapse of turbulent stresses below their fully-developed values in the outer region, as identified by Smits et al. (Reference Smits, Young and Bradshaw1979) and Castro & Epik (Reference Castro and Epik1998). The implications are of both fundamental and practical importance in that the recovery process is non-monotonic and very slow. In fact, in almost all previous measurements and simulations the flow at the farthest downstream station was not even close to being fully recovered. For example, the studies of strongly perturbed flows by Antonia & Luxton (Reference Antonia and Luxton1972), Efros & Krogstad (Reference Efros and Krogstad2011), Hanson & Ganapathisubramani (Reference Hanson and Ganapathisubramani2016), Ismail, Zaki & Durbin (Reference Ismail, Zaki and Durbin2018) and Li et al. (Reference Li, de Silva, Rouhi, Baidya, Chung, Marusic and Hutchins2019) were all conducted for a downstream distance of less than 15 boundary-layer thicknesses or channel half heights. One exception is the experimental study by Van Buren et al. (Reference Van Buren, Floryan, Ding, Hellström and Smits2020) who reported that the full recovery of turbulent pipe flow downstream of a step change in surface roughness (rough-to-smooth step) took a distance of at least 120 $R$.
To help advance our understanding of the relaxation process, especially in the far field, we investigate the response of turbulent pipe flow to the presence of a square bar roughness element with the farthest distance  $\sim {O}(1000h)$;
 $h$ is the bar height. Our goal is to identify characteristic length scales, scaling laws and their representation in a RANS framework over the entire relaxation process. In our experiment, the square bar is fitted to the surface of the pipe as a circular ring, and the perturbation strength is varied by choosing three bar sizes:
 $h/R = 0.04$, 0.1 and 0.2. The upstream flow condition is maintained to ensure fully developed pipe flow, which would seem to be an ideal place to study the response of turbulent flows to sudden perturbations because the upstream and far-downstream conditions are identical and well known, and the bulk-flow Reynolds number is fixed. It should be noted that, although the pipe-flow response in some respects is similar to that found in corresponding boundary-layer flows, there are important differences owing to the confined geometry of a pipe (Chung et al. Reference Chung, Marusic, Monty, Vallikivi and Smits2015). In the present study we will search for similarities between the flow responses in pipe and boundary-layer flows while also remarking on the attributes of the response that are unique to pipe flow.
2. Experimental methods
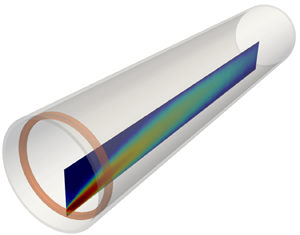
Figure 1 shows the experimental set-up and the test section geometry. The experiment was conducted in the recirculating water-pipe facility at Princeton University. The pipe has an inner diameter of  $D = 2R = 38.1$ mm and a development length of approximately 200
 $D$ to ensure fully-developed flow upstream of the test section. The bulk velocity was
 $U_b = 4.1$ m s
 $^{-1}$, corresponding to a bulk Reynolds number
 $Re_D = 2U_b R/\nu = 165\ 000$, where
 $\nu$ is the kinematic viscosity of water at 22
 $^{\circ }$C. Using the friction-factor correlation proposed by McKeon et al. (Reference McKeon, Swanson, Zagarola, Donnelly and Smits2004), the friction velocity in the upstream fully-developed flow at this Reynolds number is
 $u_{\tau 0} = 0.186$ m s
 $^{-1}$, and the friction Reynolds number is
 $Re_{\tau 0} = u_{\tau 0} R/\nu = 3760$.
Experimental set-up and test section geometry.

The square bar roughness element was held by friction on the pipe surface, and the perturbation strength was varied by choosing three bar heights:  $h/R = 0.04$, 0.1 and 0.2 (see figure 1). The medium and large bars (nylon) were machined with slightly oversized outer diameters and carefully sanded down until they fitted in the glass pipe snugly. The small bar was made by laser cutting a nylon sheet and applying some sanding on the outer diameter. The three bar heights, in terms of viscous units, were
 $h u_{\tau 0}/\nu = 150$, 376 and 752, respectively, bracketing the entire overlap region. The drag on each bar may be estimated using the results on the drag of a fence immersed in a turbulent boundary layer (Good & Joubert Reference Good and Joubert1968; Castro & Fackrell Reference Castro and Fackrell1978). In terms of minor loss coefficients, the drag of the square bar is equivalent to an extra pipe length of 5
 $R$, 12
 $R$ and 23
 $R$ for
 $h/R = 0.04$, 0.1 and 0.2, respectively, at this Reynolds number.
We examined the relaxation of the flow using particle image velocimetry (PIV) in the axial-radial plane. The data were acquired at multiple downstream stations with the farthest one at  $x = 120R$ (the origin for
 $x$ is located at the downstream edge of each bar). The full dataset comprises continuous panels for
 $0< x/R<20$ and discrete panels further downstream (see figure 2). At each station 10 000 image pairs were recorded with a LaVision Imager sCMOS PIV camera at a magnification of 0.34 (52 pixel mm
 $^{-1}$). A water-filled box was sealed around the pipe to reduce distortion owing to the refractive index mismatch. A 1 mm thick laser sheet was orientated at 45
 $^{\circ }$ with respect to the pipe (see figure 1), and surface reflections were minimised using a polarising filter.
Streamwise locations where PIV data were taken in terms of  $h$ and
 $R$.

The PIV images were processed in DaVis 8.3.0 with an iterative symmetric image deformation algorithm. The final interrogation spot was  $32 \times 32$ pixels with 50 % overlap, corresponding to a spatial resolution of 0.6 mm with 0.3 mm vector spacing. Using the method described in Adrian & Westerweel (Reference Adrian and Westerweel2011) (§ 9.4.5), the root-mean-square (r.m.s.) displacement error ranged between 0.05 and 0.15 pixel over
 $0< y/R<1$ (decreasing with
 $y$, where
 $y$ is measured from the wall). This error translates to an uncertainty level of less than 4 % of the local turbulence intensity. The statistical uncertainty is therefore dictated by turbulent fluctuations; the standard deviation of the mean streamwise velocity estimate is approximately 0.2 %, and that of the Reynolds shear stress is around 2.5 %. Comprehensive details of the uncertainty analysis are given in the appendix of Van Buren et al. (Reference Van Buren, Floryan, Ding, Hellström and Smits2020), in which the data were acquired in the same pipe facility with the same PIV system and processing methods as in the present work.
3. Overview of the response
We begin by examining the flow reattachment and the pressure recovery, and provide an overview of the development of mean flow and Reynolds stresses. The notation and definitions used here are summarised in table 1.
Notation and definitions.

3.1. Flow separation and reattachment
The mean streamlines in the region close to the separation bubble are shown in figure 3, together with the corresponding shear-stress distributions. For all three bars, the flow is seen to separate at the leading edge of the bar, and the mean dividing streamline rises a little above the location where  $y=h$ before bending down toward the point of reattachment. To estimate the mean reattachment length,
 $x_R$, we determine the location where
 $U = 0$ at the data point closest to the wall (
 $y_1/R \approx 0.016$). The velocity distribution at this height is shown in figure 3
 $(d)$, and we find
 $x_R = 4.5h$,
 $8.6h$ and
 $9.3h$ for
 $h/R = 0.04$, 0.1 and 0.2, respectively.
Mean streamlines near the separation bubble and flow reattachment distance. (a)– $(\textit {c})$
 $h/R = 0.04$, 0.1, 0.2;
 $(d)$ mean streamwise velocity at the first data point away from the pipe wall (
 $y_1/R \approx 0.016$). The reattachment length
 $x_R = 4.5h$, 8.6
 $h$ and 9.3
 $h$ for the three bar sizes.

How do we explain these differences in  $x_R$? By dimensional analysis
 $x_R/h$ will depend only on
 $h/R$ and
 $h u_{\tau 0}/\nu$. At a fixed Reynolds number, as is the case here, there is only one independent parameter: we can choose either
 $h/R$ or
 $h u_{\tau 0}/\nu$. In either case, the smaller the bar the more it is immersed in the intense turbulence present in the near-wall region. Chapman, Kuehn & Larson (Reference Chapman, Kuehn and Larson1958) argued that the size of the separation bubble is determined by a balance between the pressure-driven reverse flow and the entrainment by the separated shear layer. When the turbulence in the separated shear layer is more intense, the separation bubble will shorten to account for enhanced mass entrainment. See also Westphal et al. (Reference Westphal, Johnston and Eaton1984) and Adams & Johnston (Reference Adams and Johnston1988). Hence the considerably shorter
 $x_R$ of the small bar compared to the others is likely a result of more highly turbulent fluid in the near-wall layer being lifted up and carried over the bar, helping to intensify the turbulent mixing in the shear layer.
Although no direct comparison can be made between the present results on  $x_R$ with previous studies, we can contrast our measurements to those in pipe or boundary-layer flows over small-aspect-ratio surface-mounted obstacles. Durst et al. (Reference Durst, Founti and Wang1989) measured a turbulent pipe flow downstream of a wall-mounted ring (length-to-height ratio 2 : 1; blockage ratio
 $h/R = 0.5$) and reported that
 $6.8 < x_R/h < 8.2$ over the same Reynolds number range as in the present case (
 $5000< Re_h < 20\ 000$ based on
 $h$ and the centreline velocity). van der Kindere & Ganapathisubramani (Reference van der Kindere and Ganapathisubramani2018) found
 $x_R/h \approx 11$ behind a square block immersed in a moderately thin boundary layer (
 $h/\delta = 0.77$) with
 $Re_h = 20\ 000$, which agrees with the trend of increasing
 $x_R$ when the upstream turbulence is less intense, as observed in our measurement.
3.2. Pressure recovery
The pressure gradient  $P_{,x}$ is given by the Reynolds-averaged momentum equation in the axial direction. In a cylindrical coordinate system with
 $r = (R-y$), we have
 \begin{equation} UU_{,x}+VU_{,y} ={-}\rho^{{-}1}P_{,x}+\nu\nabla^{2}U-\overline{u^{2}}_{,x}-(R-y)^{{-}1} [(R-y)\overline{uv}]_{,y}, \end{equation}
where an overbar indicates an ensemble/time average and derivatives are denoted by commas in subscript (e.g.  $P_{,x} = \partial P/\partial x$). Integrating over the pipe cross-section gives the bulk mean pressure gradient
 $(P_{,x})_b$, which is shown in figure 4 as a function of
 $x/h$. It is evident that the recovery of the bulk mean pressure gradient scales with
 $h$, and that it takes approximately 50
 $h$ to recover regardless of the bar size (within experimental uncertainty, our data indicates that the deviation from equilibrium at
 $x/h = 45$ is 13 % of that at
 $x/h =20$, and it decreases to 7 % at
 $x/h = 50$; over
 $50< x/h<100$, the average value is about 6 %). For
 $x>50h$, therefore, the bulk pressure gradient plays little role in the recovery of the velocity field, and so it must occur through an interaction between the mean velocity and fluctuations in velocity and pressure, which will be further discussed in § 5.
Recovery of the bulk mean pressure gradient as a function of  $x/h$.
 $-(P_{,x})_b$ is normalised by its equilibrium value,
 $2\rho u_{\tau 0}^{2}/R$.

3.3. Relaxation of mean velocity and Reynolds stress
The distributions of  $U$ and
 $-\overline {uv}$ at locations up to
 $x/R = 120$ are shown in figures 5–10 for each of the three bars. In these plots,
 $U$ is normalised by the bulk velocity
 $U_b$ and
 $-\overline {uv}$ is normalised by
 $u_{\tau 0}^{2}$. Dimensional analysis indicates that at fixed Reynolds number
 $U = f_1(x, y, h, R, u_{\tau 0})$ so that
 $U/u_{\tau 0} = f_2 (x/R, y/R, h/R)$. The same functional dependence applies to the non-dimensional Reynolds stresses. This choice of parameters is not unique. For instance, velocities can be normalised by either
 $U_b$ or
 $u_{\tau 0}$ (they are directly related at a fixed Reynolds number),
 $y$ and
 $h$ can be normalised by either
 $\nu /u_{\tau 0}$ or
 $R$, and both
 $x/h$ and
 $x/x_R$ will be seen to be useful in revealing the scaling laws (by our earlier analysis
 $x_R/h=f(h/R)$).
Evolution of  $U$ for
 $h/R = 0.04$. The vertical dash-dot line in (a) indicates where
 $y=h\ (h u_{\tau 0}/\nu = 150)$.

Evolution of  $-\overline {uv}$ for
 $h/R = 0.04$. The vertical dash-dot line in (a) indicates where
 $y=h$ (
 $h u_{\tau 0}/\nu = 150$).

Evolution of  $U$ for
 $h/R = 0.1$. The vertical dash-dot line in (a) indicates where
 $y=h\ (h u_{\tau 0}/\nu = 376)$.

Evolution of  $-\overline {uv}$ for
 $h/R = 0.1$. The vertical dash-dot line in (a) indicates where
 $y=h\ (h u_{\tau 0}/\nu = 376)$.

Evolution of  $U$ for
 $h/R = 0.2$. The vertical dash-dot line in (a) indicates where
 $y=h\ (h u_{\tau 0}/\nu = 752)$.

Evolution of  $-\overline {uv}$ for
 $h/R = 0.2$. The vertical dash-dot line in (a) indicates where
 $y=h\ (h u_{\tau 0}/\nu = 752)$.

Parts (a) of figures 5–10 show the results for the region that includes the separated shear-layer development and the flow just downstream of reattachment ( $x/h \le 10$). For all three bars, the maximum mean shear and the peak shear stress in the separated shear layer both occur at
 $y/h \approx 1.3$, while the overall velocity difference across the layer and its width increase with
 $h/R$. The obstruction owing to the bar accelerates the mean flow outside the shear layer by continuity but the shear stress is nearly unaffected, implying a form of rapid distortion response in this outer region.
In parts (b) of figures 5–10, we see the results for the region where the turbulence is redistributed and begins to decay ( $x/h \ge 10$). The mean flow relaxes by ‘pivoting’, where the flow accelerates near the wall and slows down away from the wall. The pivot point, that is, the wall-normal location where
 $U_{,x} = 0$, moves away from the wall as the flow develops downstream. After the initial development, the region of high shear stress expands in size as its peak level slowly decays. For the small bar, the disturbance amplitude is small enough so that the recovery of
 $-\overline {uv}$ is confined to a region defined by
 $y/R < 0.3$. For the medium and large bars, however, this redistribution process continues until the profile of
 $-\overline {uv}$ reaches a more or less symmetric shape over the region
 $0< y/R<1$. The shear stress then decays towards the equilibrium state without further redistribution in the radial direction.
The results in the region far downstream are shown in parts (c) of figures 5–10. For the medium and large bars, the recovery of  $U$ is clearly non-monotonic and very slow. To begin, the near-wall layer distribution overshoots and the outer layer undershoots the equilibrium profile before gradually approaching the equilibrium state. For the small bar, this oscillatory behaviour is not apparent, but it will become clear in figure 19 that the overshoot also occurs for the small bar but with a much reduced amplitude. Interestingly, a similar overshoot/undershoot response was seen in the case of a thin laminar boundary layer separating and reattaching downstream of a backward-facing step (Bradshaw & Wong Reference Bradshaw and Wong1972).
The recovery of  $-\overline {uv}$ is also long-lasting and oscillatory, which is most clearly observed for the medium and large bars. The distribution of
 $-\overline {uv}$ first crosses the equilibrium profile at 20
 $R$–30
 $R$, and stays below the equilibrium level for a distance of about 100
 $R$ before bouncing back. For the flow perturbed by the small bar, the recovery in
 $U$ and
 $-\overline {uv}$ seems to be complete by about
 $x = 500h$. For the larger bars, the flow is close to the equilibrium state for
 $x > 600h$, and the remaining discrepancies are small so that the flow is likely to be full recovered by
 $1000h$.
Two features deserve further attention. We first consider the pivoting of  $U$. The mean momentum equation (3.1) indicates that changes in the mean velocity are dictated by the pressure and Reynolds stresses (viscous forces are negligible away from the wall). For one representative case (
 $x/h = 20$,
 $h/R = 0.1$, corresponding to the flow condition given in figure 7b), the contributions of each term in the mean momentum equation are shown in figure 11. For
 $y/R> 0.6$, the adverse pressure gradient is the dominant force that retards the flow. For
 $y/R < 0.2$, the flow accelerates (
 $UU_{,x}>0$), and the shear stress plays a central role in facilitating the momentum flux from upper layers of fast fluid. In the vicinity of
 $UU_{,x} = 0$,
 $UU_{,x}$ approximately coincides with
 $-r^{-1}(r\overline {uv})_{,y}$, suggesting that the pivot point (
 $U_{,x} = 0$) corresponds to a local equilibrium in momentum exchange, i.e.
 $(r\overline {uv})_{,y} = 0$, which is close to the peak location of
 $-\overline {uv}$. As the flow evolves downstream, the pivot point moves with the peak of
 $-\overline {uv}$ away from the wall, as is observed in figures 5–10.
Mean momentum budget ((3.1)) at  $x/h = 20$ (
 $h/R = 0.1$). All terms are normalised by
 $2u_{\tau 0}^{2}/R$.

Next, we consider the cessation of redistribution when the peak of  $-\overline {uv}$ reaches
 $y/R \approx 0.5$. The origin lies in the wall-normal turbulent convection term,
 $\overline {uv^{2}}_{,y}$, in the transport equation for
 $\tau = -\overline {uv}$, which, in a cylindrical coordinate system with axisymmetry, is given by
 \begin{align} U\tau_{,x}+V\tau_{,y} &= \left\{\overline{v^{2}}U_{,y}+\overline{u^{2}}V_{,x}+\frac{\tau V}{R-y}\right\} +\left\{\overline{u^{2}v}_{,x}+\overline{uv^{2}}_{,y}+\frac{\overline{u(w^{2}-v^{2})}}{R-y}\right\} \nonumber\\ &\quad -\overline{p(u_{,y}+v_{,x})/\rho}+\nu\nabla^{2}\tau-\epsilon_{12}, \end{align}
where a comma in subscript denotes a derivative (e.g.  $\overline {uv^{2}}_{,y} = \partial \overline {uv^{2}}/\partial y$). On the right-hand side, production terms (
 $\overline {v^{2}}U_{,y}+\dots$) and turbulent convection terms (
 $\overline {u^{2}v}_{,x}+\dots$) are grouped with curly braces, and the remaining three terms are, in order, pressure strain, viscous diffusion and dissipation. Here,
 $\overline {uv^{2}}_{,y}$ can be interpreted as the net flux of
 $-\overline {uv}$ in the wall-normal direction, and it is primarily responsible for the redistribution of
 $-\overline {uv}$. Figure 12 shows this turbulent convection term in the medium bar case at four streamwise locations leading up to the point where the convection stops. Each profile is normalised by its own absolute maximum to reveal the radial distribution. We see that
 $\overline {uv^{2}}_{,y}$ is a sink close to the wall and a source away from the wall, redistributing
 $-\overline {uv}$ towards the pipe centre. When
 $-\overline {uv}$ becomes more or less symmetric over
 $0< y/R<1$,
 $\overline {uv^{2}}_{,y}$ also begins to exhibit a symmetric shape (corresponding to the profile labeled
 $x/{x_c} = 1$ in figure 12). Further downstream
 $\overline {uv^{2}}_{,y}$ diffuses
 $-\overline {uv}$ but it does not move the peak of
 $-\overline {uv}$ in the radial direction. A similar result is seen for the large bar, whereas for the small bar our data suggest that the magnitude of excess
 $-\overline {uv}$ is so small that the redistribution process ceases before the
 $-\overline {uv}$ profile becomes symmetric.


The behaviour of  $\overline {uv^{2}}_{,y}$ observed here generally agrees with conventional gradient–diffusion models that relate the triple correlation to the gradient of Reynolds stress (see, e.g. Daly & Harlow (Reference Daly and Harlow1970)). Such modelling approaches assume that
 $\overline {uv^{2}}_{,y}$ behaves like the curvature of
 $-\overline {uv}$, which is consistent with our data; the profile of
 $-\overline {uv}$ before the cessation is convex (negative curvature) close to the wall and concave (positive curvature) away from the wall.
For all three bar sizes, the normal stresses broadly follow the development of the shear stress, with some significant differences. The profiles of  $\overline {u^{2}}$ and
 $\overline {v^{2}}$ for the medium bar are shown in figures 13 and 14 as a representative case. Three distinct features stand out. First, entering the second stage (
 $x/h>10$),
 ${\rm \Delta} \overline {u^{2}}$ and
 ${\rm \Delta} \overline {v^{2}}$ evolve nearly in proportion to
 ${\rm \Delta} \tau$. The ratio of their peak values is
 $3.5\,:\,1.4\,:\,1$ for the small bar and
 $2.8\,:\,1.6\,:\,1$ for the larger bars. Second, the wall damping makes the near-wall variations of
 $\overline {v^{2}}$ and
 $-\overline {uv}$ much less pronounced compared with that of
 $\overline {u^{2}}$ (see figures 13a and 13b). Third, the convection of
 $\overline {u^{2}}$ and
 $\overline {v^{2}}$ continues all the way to the centreline, in contrast to the convection of
 $-\overline {uv}$. Again, we can gain insight from the turbulent convection terms, which are
 $-\overline {u^{2}v}_{,y}$ and
 $-\overline {v^{3}}_{,y}$ for
 $\overline {u^{2}}$ and
 $\overline {v^{2}}$, respectively. Both of these convection terms are even functions of
 $y-R$, and they are positive near the centreline and negative away from it, so that they tend to redistribute
 $\overline {u^{2}}$ and
 $\overline {v^{2}}$ to the pipe centreline. Subsequently,
 $\overline {u^{2}}$ and
 $\overline {v^{2}}$ near the centreline decay and undergo an oscillatory recovery, much like
 $-\overline {uv}$.
Evolution of  $\overline {u^{2}}$ for
 $h/R = 0.1$. The vertical dash-dot line in (a) indicates where
 $y=h\ (h u_{\tau 0}/\nu = 376)$.

4. Three stages in the flow response
Our observations identified three stages for the flow response: (I) shear layer development, (II) turbulence redistribution and decay and (III) oscillatory and long-lasting recovery. We now consider how these regions may scale. Based on our observations, we seek the scaling for the maximum excess shear stress in a given profile,  ${\rm \Delta} \tau ^{*}$, and its wall-normal location denoted by
 $y^{*}$.
4.1. Stage I: shear layer development
Stage I encompasses the region where the separation bubble and flow reattachment occur, and it occurs for  $x<10h$ or
 $x< x_R$, which will be further explained in what follows.
Figure 15(a) shows  $y^{*}/h$ as a function of
 $x/h$, where the scaling with
 $h$ is revealed, in that the disturbance is confined near the wall until
 $x/h = 10$ for all three bars. There are some considerable differences in
 $y^{*}$ for
 $x/h<6$ among the three bars which may be a result of the limited resolution of the data in this region (the vector spacing in the PIV data corresponds to 0.4
 $h$, 0.16
 $h$ and 0.08
 $h$ for the three bars, respectively). A recent RANS study in a related flow by Goswami & Hemmati (Reference Goswami and Hemmati2020), for example, found an excellent collapse of
 $y^{*}$ when scaled by
 $h$, which may constitute some indirect evidence for an expected collapse in our case as well.
Evolution of  $\overline {v^{2}}$ for
 $h/R = 0.1$. The vertical dash-dot line in (a) indicates where
 $y=h\ (h u_{\tau 0}/\nu = 376)$.

Development of (a) the wall-normal location of maximum shear stress,  $y^{*}$ and (b) the maximum shear stress in a given profile,
 ${\rm \Delta} \tau ^{*}$. Quantities
 $y^{*}$ and
 ${\rm \Delta} \tau ^{*}$ are plotted against their respective near-field scaling,
 $x/h$ and
 $x/x_R$.

Figure 15(b) shows the development of  ${\rm \Delta} \tau ^{*}$. For
 $x/x_R>0.1$ the data collapse well in terms of
 ${\rm \Delta} \tau ^{*}/(h/R)$ and
 $x/x_R$. The growth of
 ${\rm \Delta} \tau ^{*}$ follows
 $(x/x_R)^{0.25}$, reaching a maximum value at approximately 0.8
 $x_R$ followed by a short plateau until
 $x = x_R$. While the 0.25 power-law growth and the proportionality to
 $h/R$ seem to be peculiar to the present flow,
 $x_R$ is clearly the correct scale for the development of a separated shear layer in wall-bounded turbulence (Eaton & Johnston Reference Eaton and Johnston1981; Castro & Haque Reference Castro and Haque1987; Durst et al. Reference Durst, Founti and Wang1989).
As proposed by Yakhot, Bailey & Smits (Reference Yakhot, Bailey and Smits2010), it can also be revealing to examine the bulk turbulence, where  ${\rm \Delta} \tau _b$ and
 ${\rm \Delta} \overline {u^{2}}_b$ are the area-averaged values of the shear stress and streamwise turbulence intensity, respectively (see also table 1). Given that both
 $y^{*}$ and
 ${\rm \Delta} \tau ^{*}$ scale as
 $h/R$,
 ${\rm \Delta} \tau _b$ and, by extension,
 ${\rm \Delta} \overline {u^{2}}_b$ are expected to scale as
 $(h/R)^{2}$. In figure 16, we see that these two bulk parameters scale as expected, and that they both reach their maximum values at
 $x \approx x_R$. They also develop at a similar rate, where
 ${\rm \Delta} \tau _b\sim (x/x_R)^{0.75}$ and
 ${\rm \Delta} \overline {u^{2}}_b \sim (x/x_R)^{0.7}$, which is entirely consistent with the similarity observed between their profiles.
Development of (a) the bulk shear stress,  ${\rm \Delta} \tau _b$ and (b) the bulk streamwise turbulence intensity,
 ${\rm \Delta} (\overline {u^{2}})_b$. Both are plotted against the near-field scaling,
 $x/x_R$.

It becomes clear by the previous discussion that stage I is bounded by either  $10h$ or
 $x_R$, depending on whether the flow is characterised by
 $y^{*}$ or
 ${\rm \Delta} \tau ^{*}$. This holds true even for the small bar where
 $x_R$ is noticeably smaller than 10
 $h$, that is, turbulence in the shear layer stops amplifying well before it starts to spread outwards.
4.2. Stage II: turbulence redistribution and decay
Stage II is dominated by the redistribution of turbulence, and it exists for  $x_R$ (or
 $10h$)
 $< x<{x_c}$. Here
 $x_c$ is the convection length scale defined in (4.2). We see from figures 15(a) and 15(b) that in the early part of stage II the stage I scaling for
 $y^{*}$ and
 ${\rm \Delta} \tau ^{*}$ continues to collapse the data. For all bars, we find initially that
 \begin{equation} {y^{*}}/{h} = 0.28( {x}/{h} )^{0.65}. \end{equation}
Then for the medium and large bars, the value of  $y^{*}/h$ levels out at a fixed point where
 $y^{*}/R \approx 0.55$ (the trend for the small bar is unclear because we have insufficient data). This is the point where the redistribution or convection ceases, and we can use the intersection of (4.1) with this point to define the convection length
 $x_c$. That is, we have
 \begin{equation} {x_c}/h = 2.83(h/R)^{{-}1.54}, \end{equation}
or equivalently
 \begin{equation} {x_c}/R = 2.83(h/R)^{{-}0.54}. \end{equation}
Rewriting (4.1) in terms of  $x/{x_c}$ yields
 \begin{equation} y^{*}/R = 0.55(x/{x_c})^{0.65}, \end{equation}
which can be considered as the far-field scaling for the disturbance shape (as characterised by  $y^{*}$) up until
 $x = {x_c}$. It represents a transition from scaling with
 $h$ and
 $x_R$ in the near field to
 $R$ and
 ${x_c}$ in the far field.
As for  ${\rm \Delta} \tau ^{*}$, we see from figure 15(b) that for
 $x>x_R$ it scales as
 $(h/R)(x/x_R)^{-1}$ up to a point that corresponds to
 $x=x_c$. This is shown more explicitly in figure 17(a) where the data of figure 15(b) have been rescaled in terms of
 $x_c$. The normalisation of
 ${\rm \Delta} \tau ^{*}$ in this figure is a convenient scaling that helps to collapse the data and illustrate the important role of
 ${x_c}$ in scaling the streamwise variation, and it is not meant to provide further insight on the behaviour of the amplitude. The
 $-1$ power-law decay is somewhat similar to that found by Castro (Reference Castro1979) in the boundary-layer relaxation downstream of a two-dimensional block, although in that case the decay rate also depended on
 $h/\delta$.
Development of  ${\rm \Delta} \tau ^{*}$ and
 ${\rm \Delta} \tau _b$ in terms of the far-field scaling,
 $x/{x_c}$.

We conclude that for the  $x$-dependence of
 $y^{*}$ and
 ${\rm \Delta} \tau ^{*}$,
 $h$ and
 $x_R$ are the appropriate near-field scales and
 $x_c$ is the correct far-field scale. Equations (4.2) and (4.3) also indicate that both
 ${x_c}/h$ and
 ${x_c}/R$ scale inversely with
 $h/R$, that is, the redistribution process for a larger bar takes a shorter distance. From the small to the large bar,
 ${x_c}/h$ is approximately 400, 100 and 33, and
 ${x_c}/R$ is approximately 16, 10 and 6.7.
As may be expected,  ${x_c}$ also scales the bulk turbulence, as observed for
 ${\rm \Delta} \tau _b$ in figure 17(b). As in figure 17(a) the non-dimensionalisation of the amplitude used here is done only for convenience. The collapse for the medium and large bars is impressive, and we believe that the departures seen for the small bar are attributable to the small amplitude of
 ${\rm \Delta} \tau$. For
 $\overline {u^{2}}$ and
 $\overline {v^{2}}$ (not shown here), the power-law decay and the extent of power-law behaviour are found to be almost identical to those of
 ${\rm \Delta} \tau$, consistent with our observation that
 $\overline {u^{2}}$ and
 $\overline {v^{2}}$ develop in proportion to
 $-\overline {uv}$ away from the wall. We also examined the wall-normal distribution of
 ${\rm \Delta} \tau$ at three representative
 $x/{x_c}$ values (figure 18), showing that the scaling collapses the profiles in addition to the location and magnitude of their peak values.
Comparison of  ${\rm \Delta} \tau$ profiles in terms of the far-field scaling,
 $x/{x_c}$. Red lines are for the medium bar and green lines for the large bar.

4.3. Stage III: oscillatory and long-lasting recovery
Stage III describes the recovery process for  $x>{x_c}$. We characterise this final stage in terms of the mean velocity gradient
 $U_{,y}$ near
 $y/R = 0.5$ and the bulk Reynolds shear stress
 $\tau _b$. The first term was chosen because the mean gradient is a sensitive measure of mean flow recovery and it plays an obvious role in the transport equations. The second term is a representative measure of the bulk-flow response, and it nicely illustrates the far-field stress recovery.
The development of  $U_{,y}$ with
 $x/h$ is given in figure 19(a). The data again demonstrate the slow recovery downstream of each bar. As found earlier with respect to
 $U$ and
 $-\overline {uv}$, the equilibrium state is only recovered by
 $500 < x/h < 1000$. We also see the characteristic damped second-order response, where
 $U_{,y}$ initially falls below its equilibrium value followed by an overshoot with a reduced amplitude. In addition, depending on the perturbation strength as characterised by
 $h/R$, the deficit in
 $U_{,y}$ can be significant: for the medium bar it is about 50 % of the equilibrium value, and for the large bar it is about 80 %.
Development of  $U_{,y}$ at
 $y/R = 0.5$ in the far field. (a)
 $U_{,y}$ as a function of
 $x/h$; (b)
 ${\rm \Delta} U_{,y}$ as a function of
 $x/{x_c}$.

The development of  $U_{,y}$ with
 $x/x_c$ is given in figure 19(b). The convection scale collapses the data in terms of the locations of the first and second zero crossings, which are located at approximately
 $x/{x_c}=1.3$ and 13, respectively. The maximum deficit in
 $U_{,y}$ (i.e.
 ${\rm \Delta} U_{,yx} = 0$) also occurs at the same value of
 $x/{x_c}$ (
 $\approx 2.5$) for all three bar sizes. Although
 ${x_c}$ was derived based on the redistribution of turbulence in stage II, the observation that it also scales the recovery in stage III makes it the true far-field length scale. In particular, we see that for
 $x/{x_c}>1.3$ the oscillation half wavelength is constant (
 $\approx 12 {x_c}$) and that the oscillation amplitude scales as
 $h/R$.
The recovery of the bulk shear stress  $\tau _b$ is presented in figure 20 against
 $x/h$ and
 $x/{x_c}$. The maximum deficit in
 $\tau _b$ is as much as 30 % of the fully-developed value, as seen for the large bar. As seen for
 ${\rm \Delta} U_{,y}$, the convection scale
 ${x_c}$ collapses
 ${\rm \Delta} \tau _b$ in the far field, where
 ${\rm \Delta} \tau _b$ crosses zero at approximately
 $x/{x_c} = 2.5$ and 15, so that the oscillation half wavelength for
 ${\rm \Delta} \tau _b$ is approximately the same as that of
 $U_{,y}$. We also find that
 ${\rm \Delta} \tau _b$ in this region is proportional to
 $h/R$, although the results for the small bar may be subject to significant measurement error associated with the small values of
 ${\rm \Delta} \tau$ in stage III.
Development of  $\tau _b$ in the far field. (a)
 $\tau _b$ as a function of
 $x/h$; (b)
 ${\rm \Delta} \tau _b$ as a function of
 $x/{x_c}$.

Choosing  $x_c$ for the far-field scaling highlights the important role of turbulent diffusion. In stage II, turbulence redistribution up until
 $x = x_c$ is driven by turbulent diffusion; in stage III the redistribution term is small and the decay and the subsequent oscillatory recovery become the principal characteristics of the flow. Using
 $x_c$ does not imply new flow physics. By dimensional analysis, the flow development depends on four dimensionless parameters:
 $h/R$,
 $Re_\tau$,
 $x/h$ and
 $y/R$. The choice for non-dimensionalisation is not unique, and we have chosen what best reveals the flow dynamics in each stage –
 $x/h$ and
 $x/x_R$ for stage I (and early part of stage II) and
 $x/x_c$ for the far-field dynamics. Note that
 $x_c$ is related to
 $h/R$ by by (4.2) or (4.3).
Regarding the anomalous behaviour seen for the small bar, we are inclined to attribute it to limitations in measurement accuracy. The scaling in stages I and II works well for all bar sizes, and only in the final stage do we begin to see different trends for the small bar (the differences are still not large). In Stage III the disturbance amplitude is so small for the small bar that even a small bias error may appear to be significant, so it is probable that the true trend is obscured by errors in our measurements. It is certainly possible, of course, that different mechanisms emerge as the perturbation becomes weaker. Further study of flows subject to such weak perturbations would require diagnostic tools having an enhanced dynamic range/accuracy.
5. Recovery scaling in terms of the governing equations
Smits et al. (Reference Smits, Young and Bradshaw1979) demonstrated that the far-field development of  ${\rm \Delta} U_{,y}$ was approximately governed by a second-order ordinary differential equation (ODE), and thus the recovery resembled a damped harmonic oscillation. Van Buren et al. (Reference Van Buren, Floryan, Ding, Hellström and Smits2020) further developed this concept and successfully modelled the recovery of turbulent pipe flow following a step change in wall roughness. It will now be argued that the far-field recovery of wall-bounded flows downstream of a strong perturbation display a common behaviour that is mostly independent of the strength and form of the initial perturbation.
We start by examining the governing equations. The derivation generally follows that given by Van Buren et al. (Reference Van Buren, Floryan, Ding, Hellström and Smits2020), where further details are available, but with some important simplifications.
Far downstream of the perturbation (approximately  $x>{x_c}$) and in the outer layer of the flow,
 ${\rm \Delta} U_{,y}$ evolves according to
 \begin{equation} {\rm \Delta} U_{,yx} = \frac{1}{U_0} {\rm \Delta}\tau_{,yy}, \end{equation}
which is obtained by differentiating the mean momentum equation (3.1) with respect to  $y$ and neglecting small terms. From the shear-stress transport equation (3.2), the evolution of
 ${\rm \Delta} \tau$ for
 $x>{x_c}$ is predominantly governed by the interaction between the production,
 $\overline {v^{2}}U_{,y}$, and the pressure strain,
 $-\overline {p(u_{,y}+v_{,x})/\rho }$. We adopt the basic LRR-IP model (where ‘LRR’ represents Launder, Reece & Rodi Reference Launder, Reece and Rodi1975, and ‘IP’ represents isotropisation of production) for the pressure strain, which combines Rotta's linear return-to-isotropy model for the slow term (the first term on the right-hand side in the equation below) with a model for the fast term that is in proportion to the production (Launder, Reece & Rodi Reference Launder, Reece and Rodi1975; Pope Reference Pope2001). That is
 \begin{equation} -\overline{p(u_{,y}+v_{,x})/\rho} ={-}C_R\frac{\epsilon}{k}\tau-C_2\overline{v^{2}}U_{,y}, \end{equation}
where  $C_R$ and
 $C_2$ are model constants. Using (5.2) and by linearisation and subtraction of the equilibrium equation, we arrive at a simple model for the evolution of
 ${\rm \Delta} \tau$:
 \begin{equation} {\rm \Delta}\tau_{,x} = \frac{1-C_2}{U_0}(U_{,y0}{\rm \Delta}\overline{v^{2}}+\overline{v^{2}}_0{\rm \Delta} U_{,y})-C_R\frac{\epsilon}{U_0 k}{\rm \Delta}\tau, \end{equation}
in which  $\epsilon$ and
 $k$ are the isotropic dissipation rate and the turbulent kinetic energy, respectively, and subscript ‘0’ denotes equilibrium values. As in Smits et al. (Reference Smits, Young and Bradshaw1979) and Van Buren et al. (Reference Van Buren, Floryan, Ding, Hellström and Smits2020), we make the approximation
 ${\rm \Delta} \overline {v^{2}} = A_2{\rm \Delta} \tau$ (
 $A_2$ is a constant), which is at least partially justified by our data. In (5.3)
 $k/\epsilon$ corresponds to a time scale associated with the decay of the energy-containing motions, so it is expected to scale with
 ${x_c}/U_0$. If we assume a simple proportionality so that
 $U_0 k/\epsilon = A_1{x_c}$, then
 \begin{equation} {\rm \Delta}\tau_{,x} = \left[A_2(1-C_2)\frac{U_{,y0}}{U_0}-\frac{C_R}{A_1{x_c}}\right]{\rm \Delta}\tau + (1-C_2)\frac{\overline{v^{2}}_0}{U_0}{\rm \Delta} U_{,y}. \end{equation}
Equations (5.1) and (5.4) together show that the oscillatory behaviour is a result of the recovery being asynchronous between the mean velocity and the Reynolds stress. It was observed that when  ${\rm \Delta} U_{,y}$ decreases to zero at
 $x/{x_c} \approx 1.3$,
 $\tau$ is far from the equilibrium state for the medium and large bars (figures 19 and 20). At this point the curvature of
 ${\rm \Delta} \tau$ is negative (figures 8 and 10) and thus continues lowering
 $U_{,y}$ to below its fully-developed value ((5.1)). Likewise, when
 ${\rm \Delta} \tau$ reaches zero, it continues reducing because
 ${\rm \Delta} \tau _{,x} \sim {\rm \Delta} U_{,y}<0$ ((5.4)). Then, further downstream where
 ${\rm \Delta} \tau$ is negative and exhibits positive curvature,
 ${\rm \Delta} U_{,y}$ bounces back. Smits et al. (Reference Smits, Young and Bradshaw1979) noted that ‘
 ${\rm \Delta} \tau$ varies in quadrature with
 ${\rm \Delta} U_{,y}$’, and it is a characteristic of recovering wall-bounded flows that is evident in the governing equations.
Equation (5.1) also shows that the maximum negative value of  ${\rm \Delta} U_{,y}$ corresponds to
 ${\rm \Delta} U_{,yx} \sim {\rm \Delta} \tau _{,yy} = 0$. Given the shape of
 ${\rm \Delta} \tau$ as observed in figures 8 and 10,
 ${\rm \Delta} \tau _{,yy} = 0$ indicates that
 ${\rm \Delta} \tau = 0$. Thus, we see from (5.4) that the maximum negative value of
 ${\rm \Delta} U_{,y}$ is proportional to
 ${\rm \Delta} \tau _{,x}$ at the point where
 ${\rm \Delta} \tau$ crosses zero, and therefore it increases with
 $h/R$. Similar arguments can be made for the maximum negative value of
 ${\rm \Delta} \tau$, and these trends are in accordance with our experimental data.
We can now combine (5.1) and (5.4) to obtain an equation for  ${\rm \Delta} U_{,y}$. We will assume that the disturbance
 ${\rm \Delta} \tau$ is shape-preserving, and that it can be separated in the streamwise and wall-normal directions so that
 ${\rm \Delta} \tau = u^{2}_{\tau 0}f(\tilde {y})g(\tilde {x})$, with
 $\tilde {y} = y/R$ and
 $\tilde {x} = x/{x_c}$. We then obtain a second-order ODE in
 $\tilde {x}$ for the parameter
 ${\rm \Delta} \tilde {U}_{,y}=(h/R)^{-1}{\rm \Delta} U_{,y}$, such that
 \begin{equation} \frac{\partial^{2} {\rm \Delta} \tilde{U}_{,y}}{\partial\tilde{x}^{2}}+b\frac{\partial {\rm \Delta} \tilde{U}_{,y}}{\partial\tilde{x}}+c{\rm \Delta} \tilde{U}_{,y} = 0, \end{equation}
with
 \begin{equation} b = \frac{C_R}{A_1}-A_2(1-C_2)\frac{U_{,y0}}{U_0}{x_c}, \end{equation}
and
 \begin{equation} c ={-}(1-C_2)\frac{{x_c}^{2}}{R^{2}} \frac{f''}{f} \frac{\overline{v^{2}}_0}{U_0^{2}}. \end{equation}
Equation (5.5) is essentially the same as the one presented in Van Buren et al. (Reference Van Buren, Floryan, Ding, Hellström and Smits2020), except that the coefficients  $b$ and
 $c$ are different in that different models were chosen for the fast pressure strain term and
 $\epsilon /k$. (The equations are presented in Cartesian form for the purpose of simplicity. Using a cylindrical coordinate system as in a pipe,
 $f''$ is replaced by
 $f''-f'/(1-\tilde {y})-f/(1-\tilde {y})^{2}$. This choice does not affect the discussion of scaling.) Furthermore, taking a derivative of (5.5) with respect to
 $\tilde {x}$ and combining it with (5.1) gives a second-order ODE for the streamwise variation of
 $\tilde {g} = (h/R)^{-1}g$ (i.e. the normalised disturbance amplitude for
 $\tau$):
 \begin{equation} \tilde{g}''+b\tilde{g}'+c\tilde{g} = 0. \end{equation}
We see that (5.5) and (5.8) are identical in form, implying identical wavelength and damping rate for  ${\rm \Delta} U_{,y}$ and
 ${\rm \Delta} \tau$. The former is consistent with our data that showed the half wavelength to be approximately
 $12{x_c}$ for both
 ${\rm \Delta} U_{,y}$ and
 ${\rm \Delta} \tau$. However, the linear model fails to predict the similarity in terms of
 $x/{x_c}$. That is, when scaled by
 $h/R$, both
 ${\rm \Delta} U_{,y}$ and
 ${\rm \Delta} \tau$ from our experimental data exhibit similarity as a function of
 $x/{x_c}$. On the other hand,
 $b$ and
 $c$ in the equations depend on
 $h/R$, implying that the wavelength (in terms of
 ${x_c}$) also depends on
 $h/R$.
Despite the inconsistency, it is still of interest to examine the model in terms of the recovery distance (oscillation wavelength). We adopt  $C_R = 1.8$ and
 $C_2 = 0.6$ in the LRR-IP model (Pope Reference Pope2001),
 $A_2 = 1.5$ according to our data and
 $A_1 = 1$. Here,
 $f = 1-0.25(1-\tilde {y})^{2}$ is a parabola following Van Buren et al. (Reference Van Buren, Floryan, Ding, Hellström and Smits2020). Then the half wavelength predicted by (5.5) at
 $\tilde {y} = 0.5$ is
 $4.1{x_c}$ for the medium bar and
 $7.8{x_c}$ for the large bar, which are considerably smaller than the experimental value of
 $\approx 12{x_c}$. Figure 21 compares the solution of (5.5) with
 $h/R = 0.2$ to the experimental data. The first zero-crossing and the maximum deficit in the data were used to determine the constants in the solution. The agreement is somewhat encouraging for the large bar, but not for the smaller bars. Further improvement of the model may require the use of nonlinear models for the pressure strain and involve nonlinear ODEs for
 ${\rm \Delta} U_{,y}$ and
 ${\rm \Delta} \tau$, but this would undoubtedly obscure the simple ideas put forward here.


6. Conclusions
The response of turbulent pipe flow to a square bar roughness element was characterised by three distinct stages: shear layer development, turbulence redistribution and decay, and oscillatory and long-lasting recovery. In terms of the wall-normal extension of each stage, the disturbance is initially confined close to the wall on a scale of  $h$, followed by diffusion to the outer region until the disturbance occupies the entire pipe. Far-field relaxation then occurs as a bulk behaviour.
In stage I and the early part of stage II,  $h$ and
 $x_R$ were found to be the near-field streamwise scales governing the flow development. The disturbance shape of
 $-\overline {uv}$ evolved as a function of
 $h$, and the onset of turbulence redistribution occurred at
 $10h$. The turbulence intensity and Reynolds shear stress featured a power-law growth until
 $x \approx x_R$, followed by a power-law decay for
 $x>x_R$. In addition, the peak Reynolds shear stress and the bulk turbulence were shown to scale as
 $h/R$ and
 $(h/R)^{2}$, respectively.
During the second stage, the turbulence development transitioned from the near-field scales  $h$ and
 $x_R$ to the far-field scale
 ${x_c}$. We derived
 ${x_c}$ based on the distance over which the convection or redistribution of
 $-\overline {uv}$ is important. This convection scale was found to be remarkably useful in characterising the flow development: the disturbance shape, the extent of power-law decay and the development of normal stresses were all found to collapse when viewed in terms of
 ${x_c}$.
The final stage of recovery is oscillatory and long-lasting ( ${O}(100R$)) as compared with the extent of the first two stages (10
 $R$–20
 $R$). Here,
 ${\rm \Delta} U_{,y}$ and
 ${\rm \Delta} \tau _b$ recovered asynchronously, which appears to be the mechanism responsible for the oscillatory recovery. Their zero-crossings as well as oscillation half-wavelengths (
 $\approx 12{x_c}$) collapsed when viewed in terms of
 $x/{x_c}$, suggesting
 ${x_c}$ to be the true far-field streamwise scale. The oscillation half-wavelength decreased with increasing
 $h/R$ (
 ${x_c} \sim (h/R)^{-0.54}$), but the oscillation amplitude scaled as
 $h/R$ for both
 ${\rm \Delta} U_{,y}$ and
 ${\rm \Delta} \tau _b$.
It is somewhat surprising that  ${x_c}$ continues to be the scale for the far-field recovery of the flow, as was seen in stage III. This result is not an obvious implication of the governing equations, at least within the framework of linearised RANS models. What is even more striking is that no simple scaling was found for the decay of turbulence downstream of
 $x={x_c}$, although
 ${\rm \Delta} \tau _b$ changes sign at a fixed value of
 $x/{x_c}$ for all three bars. In this regard, the linear far-field recovery model that we derived from the transport of
 $U$ and
 $-\overline {uv}$ proved insufficient. It was shown to successfully predict the damped oscillation, the same wavelength for
 ${\rm \Delta} U_{,y}$ and
 ${\rm \Delta} \tau$ and the increasing magnitude of
 ${\rm \Delta} U_{,y}$ and
 ${\rm \Delta} \tau$ as
 $h/R$ increases. However, the model fails to identify the important role in the recovery played by redistribution as reflected in the collapse of the data with
 ${x_c}$ in stages II and III.
Funding
The authors gratefully acknowledge support under ONR grant N00014-17-1-2309 (programme manager P. Chang).
Declaration of interests
The authors report no conflict of interest.



