1. Introduction
Flowing granular mixtures tend to segregate by size, density, or other physical properties. Understanding granular segregation is essential for industrial sectors where granular materials are mixed and demixed (Ottino & Khakhar Reference Ottino and Khakhar2000; Ottino & Lueptow Reference Ottino and Lueptow2008). Segregation also plays an important role in natural processes such as geophysical mass flows (Iverson Reference Iverson1997; Johnson et al. Reference Johnson, Kokelaar, Iverson, Logan, LaHusen and Gray2012) and bedload transport (Frey & Church Reference Frey and Church2009; Ferdowsi et al. Reference Ferdowsi, Ortiz, Houssais and Jerolmack2017). Recent decades have seen rapid development in both physical interpretation and theoretical modelling of particle segregation, particularly in dense granular flows (Gray Reference Gray2018; Umbanhowar, Lueptow & Ottino Reference Umbanhowar, Lueptow and Ottino2019). However, fundamental aspects of granular segregation at the particle level remain unclear.
Granular materials display a rich variety of segregation behaviours. In gravity-driven flows, small particles tend to percolate downward under gravity through interstices between large particles, displacing large particles upward. By contrast, systematic evidence of reverse segregation (i.e. large particles sink) has been reported depending on the size and density ratios of particle species, as well as the species concentration (Thomas Reference Thomas2000; Félix & Thomas Reference Félix and Thomas2004). In the absence of gravity (e.g. lateral segregation in vertical silo flows), large particles tend to migrate toward high shear rate regions (Fan & Hill Reference Fan and Hill2011; Itoh & Hatano Reference Itoh and Hatano2019), but the tendency reverses when the flow becomes dilute (Fan & Hill Reference Fan and Hill2011). Although different mechanisms including geometric effects (Savage & Lun Reference Savage and Lun1988), mass effects (Félix & Thomas Reference Félix and Thomas2004) and shear gradient dependence (Fan & Hill Reference Fan and Hill2011) have been proposed, a unified picture remains elusive. As a result, current theoretical predictions rely on ad hoc assumptions or phenomenological closures (Gray & Thornton Reference Gray and Thornton2005; Marks, Rognon & Einav Reference Marks, Rognon and Einav2012; Fan et al. Reference Fan, Schlick, Umbanhowar, Ottino and Lueptow2014; Hill & Tan Reference Hill and Tan2014; Larcher & Jenkins Reference Larcher and Jenkins2015; Schlick et al. Reference Schlick, Fan, Isner, Umbanhowar, Ottino and Lueptow2015; Tunuguntla, Weinhart & Thornton Reference Tunuguntla, Weinhart and Thornton2016; Chassagne et al. Reference Chassagne, Maurin, Chauchat, Gray and Frey2020).
The single intruder particle limit provides an avenue to investigate the physics of granular segregation. Previous studies using this approach focused on segregation kinematics (Tripathi & Khakhar Reference Tripathi and Khakhar2011, Reference Tripathi and Khakhar2013; van der Vaart et al. Reference van der Vaart, Gajjar, Epely-Chauvin, Andreini, Gray and Ancey2015; Jing, Kwok & Leung Reference Jing, Kwok and Leung2017; Trewhela, Gray & Ancey Reference Trewhela, Gray and Ancey2021) and forces (Tripathi & Khakhar Reference Tripathi and Khakhar2011; Guillard, Forterre & Pouliquen Reference Guillard, Forterre and Pouliquen2016; Staron Reference Staron2018; van der Vaart et al. Reference van der Vaart, van Schrojenstein Lantman, Weinhart, Luding, Ancey and Thornton2018; Kumar, Khakhar & Tripathi Reference Kumar, Khakhar and Tripathi2019; Jing et al. Reference Jing, Ottino, Lueptow and Umbanhowar2020; Kiani Oshtorjani, Meng & Müller Reference Kiani Oshtorjani, Meng and Müller2021; van Schrojenstein Lantman et al. Reference van Schrojenstein Lantman, van der Vaart, Luding and Thornton2021). Guillard et al. (Reference Guillard, Forterre and Pouliquen2016) were the first to propose and use a virtual spring-based ‘force meter’ in numerical simulations, which allows measurement of the segregation force on single intruder particles in sheared granular beds. In this approach, an intruder particle is tethered to a virtual spring that acts only in the segregation ( $z$) direction (perpendicular to the shear flow in the
 $x$-direction). The spring applies a restoring force on the intruder that opposes segregation. This restoring force can be used to determine the segregation force
 $F_{seg}$, which, by definition, is nothing more than the net contact force in the
 $z$-direction on the intruder due to particle–particle interactions. It is therefore convenient, and unambiguous, to view segregation as a result of the imbalance between
 $F_{seg}$ and other forces such as the gravitational force (if present). The central goal of this work is to characterize
 $F_{seg}$ as a function of local flow conditions for various particle properties and system flow parameters, and validate this description across a wide range of different flow geometries.
Guillard et al. (Reference Guillard, Forterre and Pouliquen2016) showed that, in two-dimensional (2-D) confined flows,  $F_{seg}$ can be expressed as two additive terms that scale with the local pressure gradient (
 $\partial p/\partial z$) and the local shear-stress gradient (
 $\partial \tau /\partial z$),
 \begin{equation} \left. F_{seg} \right| _{confined\ flow} ={-}\mathcal{A}(\mu,R)\frac{\partial p}{\partial z}V_i + \mathcal{B}(\mu,R)\frac{\partial \tau}{\partial z}V_i, \end{equation}
where  $\mathcal {A}(\mu ,R)$ and
 $\mathcal {B}(\mu ,R)$ are dimensionless functions,
 $\mu =\tau /p$ is the local effective friction,
 $R$ is the intruder-to-bed particle size ratio and
 $V_i$ is the intruder volume. Note that Guillard et al.'s original expression was applied to 2-D disks and given in terms of the intruder ‘area’ instead of volume. Note also that here ‘pressure’ and ‘normal stress’ are interchangeable (
 $p=\sigma _{zz}$) because small differences in normal stress components (
 $\sigma _{xx}$,
 $\sigma _{yy}$,
 $\sigma _{zz}$) are neglected, and
 $-\partial {p}/\partial {z}=\phi \rho g_z$ indicates (positive) hydrostatic pressure gradients, where
 $\phi$ is the bulk packing fraction,
 $\rho$ is the material density of bed particles and
 $g_z$ is the
 $z$-component of the gravitational acceleration.
Expression (1.1) describes gravity- and shear-driven segregation in confined, wall-driven flows and has inspired follow-up studies including van der Vaart et al. (Reference van der Vaart, van Schrojenstein Lantman, Weinhart, Luding, Ancey and Thornton2018) and Jing et al. (Reference Jing, Ottino, Lueptow and Umbanhowar2020) for different flow geometries. However, several important questions remain unexplored. First, although the two terms in (1.1) appear to separate normal- and shear-stress gradient contributions, the dependence of both prefactors  $\mathcal {A}$ and
 $\mathcal {B}$ on
 $\mu$ indicates that the two effects remain coupled, since
 $\mu$ depends on both
 $p$ and
 $\tau$, and, hence, their gradients. The influence of shear-stress profiles seems to be unclear in other geometries as well. For example, in three-dimensional (3-D) inclined chute flows, van der Vaart et al. (Reference van der Vaart, van Schrojenstein Lantman, Weinhart, Luding, Ancey and Thornton2018) showed that the total segregation force is insensitive to shear-stress gradients (which vary with the chute inclination), a finding we confirmed using a controlled-velocity approach that allows shear-stress profiles to be specified (Jing et al. Reference Jing, Ottino, Lueptow and Umbanhowar2020). Second, while it is generally accepted that the pressure gradient-induced segregation force is related to ‘granular buoyancy’ (Guillard et al. Reference Guillard, Forterre and Pouliquen2016; van der Vaart et al. Reference van der Vaart, van Schrojenstein Lantman, Weinhart, Luding, Ancey and Thornton2018; Jing et al. Reference Jing, Ottino, Lueptow and Umbanhowar2020), the physical origin of the shear-stress gradient contribution remains unexplained (Guillard et al. Reference Guillard, Forterre and Pouliquen2016). Third, as noted by Guillard et al. (Reference Guillard, Forterre and Pouliquen2016), the scaling law described by (1.1) is based on 2-D confined flows and does not predict the sinking of very large intruders observed in free-surface-flow experiments (Félix & Thomas Reference Félix and Thomas2004), which raises the question of how (1.1) applies to 3-D unconfined flow configurations.
We recently developed a scaling law for  $F_{seg}$ that predicts whether an intruder rises or sinks in free-surface flows (Jing et al. Reference Jing, Ottino, Lueptow and Umbanhowar2020), matching extensive experimental results across the broad size–density parameter space explored by Félix & Thomas (Reference Félix and Thomas2004) and agreeing with inclined chute flow simulation results, including those of van der Vaart et al. (Reference van der Vaart, van Schrojenstein Lantman, Weinhart, Luding, Ancey and Thornton2018). The scaling law has a simple, buoyancy-like form,
 \begin{equation} \left. F_{seg} \right| _{free\ surface\ flow} \approx \left. F_{seg} \right| _{\text{`}linear\text{'}\ flow} ={-}f(R)\frac{\partial{p}}{\partial{z}}V_i, \end{equation}
where  $f(R)$ is dimensionless and the flow velocity is ‘linear’ (elaborated below). In contrast to
 $\mathcal {A}(\mu ,R)$ and
 $\mathcal {B}(\mu ,R)$ expressions in (1.1),
 $f(R)$ is insensitive to local flow properties (e.g.
 $\mu$). This finding indicates that
 $F_{seg}$ depends only on pressure gradients, but not shear-stress gradients such as the second term of (1.1), in free-surface flows that have an approximately linear velocity profile. Indeed, the buoyancy-like scaling of (1.2) on its own captures the chute flow results of van der Vaart et al. (Reference van der Vaart, van Schrojenstein Lantman, Weinhart, Luding, Ancey and Thornton2018), although they further decompose
 $F_{seg}$ into separate lift- and buoyancy-like components.
The scaling law (1.2) is based on controlled-velocity flows where a stabilizing algorithm enforces a linear velocity profile (i.e. constant shear rate); gravity is also included to introduce inhomogeneous pressure and shear-stress profiles (Jing et al. Reference Jing, Ottino, Lueptow and Umbanhowar2020). This linear-velocity flow represents an elementary flow where the segregation force can be easily connected with local flow properties, such as the shear rate, pressure and stress gradients. A linear velocity profile is an accurate approximation for free-surface flows at least over the extent of the profile in the vicinity of an intruder particle. However, for wall-driven flows where the velocity profile can be highly nonlinear, the local shear rate can vary significantly over a distance comparable to the intruder size (Fan & Hill Reference Fan and Hill2011; Guillard et al. Reference Guillard, Forterre and Pouliquen2016). In these cases, higher-order effects may occur and the linear velocity assumption is not always appropriate.
To extend the applicability of the scaling (1.2) to more general situations where the velocity profile may be nonlinear, we propose in this paper that an additional contribution to the segregation force is associated with the local curvature of the velocity profile (i.e. the shear rate gradient  $\partial \dot \gamma /\partial z$, where
 $\dot \gamma =\partial {u}/\partial {z}$ and
 $u$ is the flow velocity in the streamwise
 $x$-direction). A unified form for
 $F_{seg}$ is proposed,
 \begin{equation} \left. F_{seg} \right|_{unified} ={-}f^{g}(R)\frac{\partial{p}}{\partial{z}}V_i + f^{k}(R)\frac{p}{\dot{\gamma}}\frac{\partial \dot{\gamma}}{\partial z}V_i, \end{equation}
where the first term is identical to (1.2) and is gravity induced (hence  $f^{g}(R)$; note that we only consider pressure gradients induced by gravity, although rotation or other body forces can also induce pressure gradients), while the second term represents a kinematics contribution (hence
 $f^{k}(R)$) that is related to the curvature of the velocity profile. Functional forms of
 $f^{g}(R)$ and
 $f^{k}(R)$ are established below as expressions (3.4) and (3.5), respectively. It is important to note that, as demonstrated below, both
 $f^{g}(R)$ and
 $f^{k}(R)$ are independent of
 $\mu$ and the kinematics contribution is universal for all flow geometries that we consider, including confined and free-surface flows, for a wide range of flow conditions from quasistatic to inertial. Interestingly, the kinematics description (1.3) and the stress description (1.1) are approximately equivalent if (and only if) the flow obeys a local rheology (Forterre & Pouliquen Reference Forterre and Pouliquen2008), i.e. shear stresses depend only on local shear rates, leading to the
 $\mu$ dependence in (1.1), see the Appendix (A). However, this equivalence might break down in flow regions that exhibit a non-local rheology (Kamrin Reference Kamrin2019). Lastly, the specific form of the second term in (1.3) is inferred from a dimensional argument, and the relevance of all parameters (
 $p$,
 $\dot \gamma$,
 $\partial \dot \gamma /\partial z$ and
 $V_i$) is verified in this paper based on a comprehensive parametric study. In particular, while
 $f^{g}(R)$ is studied and established in our recent work (Jing et al. Reference Jing, Ottino, Lueptow and Umbanhowar2020),
 $f^{k}(R)$ is developed in this paper by extending the controlled-velocity flow from constant shear rate (Jing et al. Reference Jing, Ottino, Lueptow and Umbanhowar2020) to constant shear rate gradient (i.e. controlled curvature of the velocity profile), and varying the curvature extensively.
In § 2 we introduce the simulation scheme that allows flow kinematics to be arbitrarily controlled, as well as other flow geometries that we use for validation. Then, the approach to measuring  $F_{seg}$ and model details are presented. In § 3 we first focus on
 $R=2$ and characterize the kinematics contribution to
 $F_{seg}$ in the absence of gravity, after which we introduce gravity and show that the two terms in (1.3) are indeed additive. The proposed scaling law is then compared with results from other geometries, highlighting the universality of gravity- and kinematics-induced segregation forces. Finally, results for varying
 $R$ are presented to establish the
 $R$ dependence in scaling law (1.3). Conclusions are drawn in § 4.
2. Methods
2.1. Flow configurations
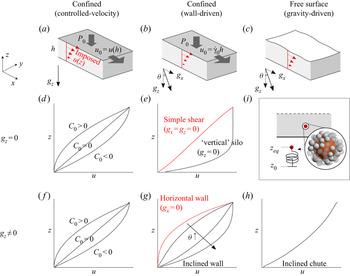
We use the open-source discrete element method (DEM) code LIGGGHTS (Kloss et al. Reference Kloss, Goniva, Hager, Amberger and Pirker2012) to simulate several different dense granular flows, which can be classified broadly into ‘confined’ and ‘free-surface’ flows (figure 1). For confined flows, we vary the velocity profile with two different approaches: first, by directly controlling the velocity field (referred to as ‘controlled-velocity’ flows, see below); second, by varying the direction of gravity in ‘wall-driven’ flows. In each flow, a single intruder particle is placed in the middle of the flow depth to measure the segregation force  $F_{seg}$ (see figure 1i and § 2.2). The focus is on how
 $F_{seg}$ depends on the local curvature of the velocity profile.
(a–h) Flow configurations and associated velocity profiles (see text for details). (i) Intruder particle (red) in the flow and tethered to a virtual vertical spring for segregation force measurement.

As shown in figure 1, periodic boundaries are imposed in the streamwise ( $x$) and spanwise (
 $y$) directions and the domain is sufficiently wide in both directions that, in steady state, gradients of the flow occur only in the normal (
 $z$) direction; that is, we only consider segregation in the
 $z$-direction. For controlled-velocity flows, gravity is always normal to the bottom wall, while for other flows, gravity may be tilted in the
 $xz$-plane to an angle of
 $\theta$ with respect to the
 $z$-axis. The gravity vector is denoted as
 $(g_x,0,g_z)=(g\sin \theta ,0,-g\cos \theta )$, where
 $g$ is the magnitude of the gravitational acceleration. To aid interpretation of the segregation direction, we use ‘up’ and ‘down’ (or similar terms) to refer to the positive and negative directions of the
 $z$-axis consistent with that in figure 1, even when gravity is turned off or is parallel to the flow (i.e.
 $g_z=0$). The same convention applies to ‘top’ and ‘bottom’ walls. Bottom walls are always immobile, while top walls (absent in free-surface flows) are reactive in the
 $z$-direction to maintain an overburden pressure
 $P_0$ and translate with velocity
 $u_0$. All walls are roughened by randomly distributed stationary particles to reduce slippage (Jing et al. Reference Jing, Kwok, Leung and Sobral2016).
In the following, each flow type is described with an emphasis on the curvature of its velocity profile and how the curvature is systematically varied.
2.1.1. Confined, controlled-velocity flows
Controlled-velocity flow, in which the flow velocity profile is specified, has been used previously to study granular rheology. While linear velocity profiles are usually imposed in the absence of gravity to achieve homogeneous shear (Lerner, Düring & Wyart Reference Lerner, Düring and Wyart2012; Clark et al. Reference Clark, Thompson, Shattuck, Ouellette and O'Hern2018), it is also possible to impose arbitrary velocity profiles without gravity (Saitoh & Tighe Reference Saitoh and Tighe2019) or to add gravity for linear velocity profile flows (Fry et al. Reference Fry, Umbanhowar, Ottino and Lueptow2018; Duan et al. Reference Duan, Umbanhowar, Ottino and Lueptow2020). Controlling the velocity profile allows us to vary shear rate gradients (i.e. curvatures of the velocity profile) independently of gravity, thereby isolating the gravity- and kinematics-related contributions to the segregation force.
To impose a particular streamwise velocity profile  $u(z)$, a stabilizing force (in the
 $x$-direction) is applied to each particle at each DEM time step (Fry et al. Reference Fry, Umbanhowar, Ottino and Lueptow2018), including the intruder particle, and the top wall is translated at a matching speed
 $u(h)$, where
 $h$ is the flow thickness. The stabilizing force applied to a particle is
 $A(u(z_p)-u_p)$, where
 $z_p$ and
 $u_p$ are the instantaneous particle position and velocity, respectively, and
 $A$ is a constant. We use
 $A=0.1\ \textrm {N}\ \textrm {s}\ \textrm {m}^{-1}$ in the controlled-velocity flows below, but increasing or decreasing
 $A$ by an order of magnitude does not change the results significantly. Indeed, as detailed below, controlled-velocity flows follow the same granular rheology (in terms of the effective friction) as homogeneous shear flow, indicating that particle–particle collisions dominate the particle rheology even when stabilizing forces are imposed. Note that applying the velocity control reduces velocity fluctuations (or, granular temperature) in the streamwise direction, but this does not affect the
 $z$-component of the granular temperature or the segregation behaviour.
To generate a constant shear rate gradient flow, we specify  $u(z)$ as
 \begin{equation} u(z) = \left(\dot\gamma_0-\frac{C_0h}{2}\right)z+\frac{C_0}{2}z^{2}, \end{equation}
where  $\dot \gamma _0$ and
 $C_0$ are, respectively, a characteristic shear rate and the controlled curvature (i.e. shear rate gradient). For this profile, we have
 \begin{equation} \dot\gamma(z) = \dot\gamma_0-\frac{C_0h}{2}+C_0z \end{equation}
and
 \begin{equation} \frac{\partial\dot\gamma}{\partial z} = C_0. \end{equation}
The specific form of (2.1) is chosen for several reasons. First, the local shear rate in the middle of the flow (where the intruder is placed) is  $\dot \gamma (h/2)=\dot \gamma _0$, independent of
 $C_0$. Second, the shear rate gradient in the simulation is homogeneous (except within a few bed particle diameters of the upper and lower boundaries, see flow profiles in § 3.1) based on (2.3); by varying
 $C_0$ from negative to positive, the concavity and local curvatures of the velocity profile around the intruder are systematically varied and precisely controlled (figure 1d,f). Third, the velocity at the upper boundary,
 $z=h$, is
 $u_0=\dot \gamma _0h$, which is consistent with the top wall velocity in wall-driven flows (figure 1b). Furthermore, we constrain gravity so that it is always in the
 $z$-direction – that is,
 $g_x=0$. Other forms of
 $u(z)$, such as power-law and exponential functions, could be used in place of (2.1), but these do not have the advantage of a constant
 $\partial \dot \gamma /\partial {z}$ throughout the flow domain. Nevertheless, we have verified that these alternative velocity profiles produce segregation forces that are consistent with the scaling (1.3).
Apart from systematically varying the shear rate gradient  $C_0$, we also vary
 $P_0$,
 $\dot {\gamma }_0$ and
 $g_z$ to explore their effects on the segregation force on a single intruder particle. A key advantage of the controlled-velocity geometry is that the imposed velocity profile is unaffected by gravity; the flow adjusts its shear-stress profiles in response to changed gravitational fields while maintaining the same flow kinematics. As shown schematically in figure 1(d,f), identical velocity profiles are achieved for the
 $g_z=0$ and
 $g_z\ne 0$ cases while keeping other system parameters constant.
2.1.2. Wall-driven flows
In wall-driven flows, overburden pressure  $P_0$ and velocity
 $u_0=\dot \gamma _0h$ are imposed at the top wall to drive the flow without directly controlling the velocity profile (note that in wall-driven flows we use
 $\dot \gamma _0$ to characterize the top wall velocity, consistent with the notation for controlled-velocity flows). The concavity of the velocity profile of wall-driven flows is altered by varying the direction of gravity (figure 1e,g). With no gravity (
 $g_x=g_z=0$), the flow is simple shear with a nearly linear velocity profile (figure 1e), and segregation does not occur because both the pressure gradient and shear rate gradient are zero.
When gravity is parallel to the flow direction ( $\theta =90^{\circ }$,
 $g_x\ne 0$,
 $g_z=0$), shear-stress gradients develop along the
 $z$-direction and the velocity profile is concave up (negative
 $\partial \dot \gamma /\partial {z}$), as shown in figure 1(e). Shear is localized near the bottom wall, above which is a plug-flow zone. This flow is similar to half of a ‘vertical’ silo flow (GDR MiDi 2004), albeit horizontally placed in our coordinate system. Segregation in the
 $z$-direction is driven only by shear as there is no pressure gradient (
 $g_z=0$).
When gravity is perpendicular to the flow ( $\theta =0$,
 $g_x=0$,
 $g_z\ne 0$), a flowing layer develops near the top wall with concave-down (positive
 $\partial \dot \gamma /\partial {z}$) velocity profiles (figure 1g). Shear stress is homogeneous in this geometry, because the only external forcing in the
 $x$-direction is applied from the top wall (Guillard et al. Reference Guillard, Forterre and Pouliquen2016). However, both the pressure gradient due to gravity and the nonlinear velocity profile (or, the shear rate gradient) are expected to contribute to segregation.
As  $\theta$ increases from
 $0$ toward
 $90^{\circ }$ (
 $\theta >0$,
 $g_x\ne 0$,
 $g_z\ne 0$; ‘inclined wall-driven’ flows in figure 1g), the velocity profile changes from concave down to concave up, and the kinematics- and gravity-related segregation mechanisms can either compete or cooperate.
2.1.3. Free-surface, gravity-driven flows
Common free-surface flows include chute flow, heap flow and surface flow in rotating tumblers. Here we study relatively thick flows (approximately  $40$ particles deep) down an inclined streamwise and spanwise periodic chute that exhibit Bagnold-like, concave-up velocity profiles (figure 1h). Thin chute flows (Louge Reference Louge2003; Silbert, Landry & Grest Reference Silbert, Landry and Grest2003; Weinhart et al. Reference Weinhart, Thornton, Luding and Bokhove2012; Kamrin & Henann Reference Kamrin and Henann2015) or shallow flowing layers in heap and rotating-drum flows (GDR MiDi 2004; Kamrin & Koval Reference Kamrin and Koval2012) will be addressed in a separate work as these flows are likely to be strongly affected by bottom or sidewall boundaries.
2.2. Segregation force measurement
We measure the segregation force on a single intruder particle in each flow simulation following the approach of Guillard et al. (Reference Guillard, Forterre and Pouliquen2016). The intruder is tethered to a virtual spring that senses forces only in the  $z$-direction, which allows the intruder to deviate from the initial height
 $z_0$ and fluctuate around an equilibrium position
 $z_{eq}$ (figure 1i). In equilibrium,
 $F_{seg}$, the net contact force on the intruder perpendicular to the flow (in the
 $z$-direction), is balanced by the spring force and the intruder weight, i.e.
 $F_{seg}=k(z_{eq}-z_0)+m_ig_z$, where
 $k$ is the spring stiffness and
 $m_i$ is the intruder mass. Note that
 $F_{seg}$ represents the mean segregation force, even though the random action of contacting particles fluctuates in time. The uncertainty in
 $F_{seg}$ (error bars) is estimated based on temporally correlated fluctuations of the intruder position around
 $z_{eq}$ (Zhang Reference Zhang2006). The measurement of
 $F_{seg}$ is generally insensitive to
 $k$ for 3-D configurations (van der Vaart et al. Reference van der Vaart, van Schrojenstein Lantman, Weinhart, Luding, Ancey and Thornton2018) as the intruder is free to explore the
 $xy$-plane. However, a softer spring has a longer relaxation time and therefore requires longer computation time to obtain statistically significant results, and the measured force may vary if the intruder migrates too near boundaries. Here, we use relatively stiff springs (typically,
 $k=100\ \textrm {N}\ \textrm {m}^{-1}$) to ensure that
 $z_{eq}$ is close to
 $z_0$ such that local flow conditions around the intruder can be a priori controlled (or estimated in flows without directly controlled velocity profiles). Increasing or decreasing
 $k$ by an order of magnitude gives the same results.
2.3. Model parameters and flow conditions
The flow domain in all simulations is  $30d$ long (
 $x$),
 $20d$ to
 $30d$ wide (
 $y$) (adjusted to avoid boundary effects) and
 $40d$ deep (
 $z$), and contains bed particles of diameter
 $d$ and density
 $\rho$. A single intruder particle of size ratio
 $R=d_i/d$ and density ratio
 $R_\rho =\rho _i/\rho$, where
 $d_i$ and
 $\rho _i$ are the intruder diameter and density, is placed in the middle of the flow. In previous work we varied both
 $R$ and
 $R_\rho$ to study forces driving combined size and density segregation (Jing et al. Reference Jing, Ottino, Lueptow and Umbanhowar2020). Here, to simplify the parameter space, we only report results for
 $d=5$ mm (with
 $10\,\%$ size polydispersity),
 $\rho =2500\ \textrm {kg}\ \textrm {m}^{-3}$,
 $R_\rho =1$ and
 ${0.2\leqslant R \leqslant 8}$. However, varying
 $d$,
 $\rho$, or
 $R_\rho$ does not change the scaling of
 $F_{seg}$. Particle interactions are calculated using the Hertz contact model with Young's modulus
 $5\times 10^{7}$ Pa, Poisson's ratio
 $0.4$, restitution coefficient
 $0.8$ and friction coefficient
 $0.5$; varying these parameters has negligible influence on the results, except for friction
 $\lesssim 0.3$ (see supplemental material for Jing et al. (Reference Jing, Ottino, Lueptow and Umbanhowar2020)).
System parameters are varied for each flow geometry (figure 1) to achieve a wide range of local flow conditions (e.g.  $\partial {p}/\partial {z}$,
 $\partial {\dot \gamma }/\partial {z}$,
 $p$,
 $\dot \gamma$) around the intruder, which are then associated with
 $F_{seg}$ according to the proposed relation (1.3). Local flow conditions are estimated for each simulation at
 $z=z_{eq}$ based on spatially and temporally averaged flow fields along the
 $z$-direction. Steady-state flow and stress profiles are estimated based on
 $1d$-thick bins along the flow depth (
 $z$) that span the simulation domain in the
 $xy$-plane. For a given instant at steady state, we first compute averaged velocity and contact stresses (Silbert et al. Reference Silbert, Ertaş, Grest, Halsey, Levine and Plimpton2001) in each bin based on particles centred in that bin, including the intruder particle, and then smooth the depthwise profile spatially using a moving average filter (typically spanning five equally weighted bins). The profiles are then averaged in time, typically using
 $200$ snapshots for steady state conditions. First- or second-order gradients of the velocity and stress profiles (e.g.
 $\dot \gamma$,
 $\partial {\dot \gamma }/\partial {z}$,
 $\partial {p}/\partial {z}$) are calculated using central differences. Although an intruder particle can change local flow structures in its vicinity (van der Vaart et al. Reference van der Vaart, van Schrojenstein Lantman, Weinhart, Luding, Ancey and Thornton2018; Jing et al. Reference Jing, Ottino, Lueptow and Umbanhowar2020), we verify that local disturbances due to the presence of the intruder are smoothed out (see smoothed flow profiles in § 3.1) and details of the averaging method do not affect the results.
The flow at  $z=z_{eq}$ is characterized by the local inertial number
 $I(z_{eq})=\dot \gamma (z_{eq})d\sqrt {\rho /p(z_{eq})}$, which is varied broadly from
 $0.004$ to
 $0.44$ with
 $500\leqslant P_0 \leqslant 2500$ Pa and
 $10\leqslant \dot \gamma _0\leqslant 40\ \textrm {s}^{-1}$ for controlled-velocity and confined flows or
 $22^{\circ }\leqslant \theta \leqslant 28^{\circ }$ for inclined chute flows; varying
 $g$ also influences
 $I(z_{eq})$. For brevity, we mainly report
 $I(z_{eq})$ (simply referred to as
 $I$ below) instead of system parameters when identifying flow characteristics; detailed simulation parameters (both controlled system parameters and measured local parameters) for a total of more than
 $300$ runs with approximately
 $25\,000$ particles per run are provided as supplementary material available at https://doi.org/10.1017/jfm.2021.688.
3. Results and discussion
3.1. Segregation forces for  $R=2$

Focusing first on size ratio  $R=2$ and density ratio
 $R_\rho =1$, we vary local curvatures in controlled-velocity flows following (2.1) in the absence of gravity (
 $g_z=0$) to study the kinematics-dependent part of
 $F_{seg}$, and then add gravity (
 $g_z>0$) to study the gravity-dependent part. Results from other flow geometries are used to validate the scaling.
3.1.1. Kinematics contribution (no gravity)
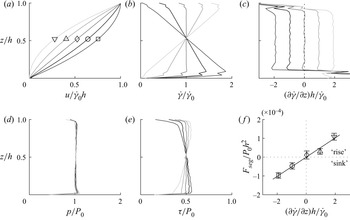
Figure 2 shows data from a representative set of controlled-velocity simulations with varying  $C_0$ but fixed
 $P_0$ and
 $\dot {\gamma }_0$ (thus fixed
 $I$ around the intruder);
 $\dot \gamma _0$,
 $P_0$ and
 $h$ are used for normalization. In figure 2(a), as
 $C_0$ is varied from negative (darker curves) to positive (lighter curves), the velocity profile varies from concave up to concave down, including a linear case with no curvature (
 $C_0=0$). A symbol marks the intruder position
 $z_{eq}$ on each curve, which is always midway between the upper and lower walls to minimize wall effects. Figure 2(b) shows that, although the shear rate profile varies with
 $C_0$, the local shear rate at the position of the intruder (
 $z/h\approx 0.5$) is always
 $\dot {\gamma }_0$ due to the imposed velocity profile (2.1). Figure 2(c) shows that the imposed velocity profile results in a constant local shear rate gradient
 $\partial \dot \gamma /\partial {z}$ across nearly the entire flow domain (except at the upper and lower walls) with dimensionless curvatures
 $C_0h/\dot \gamma _0$ varying from
 $-2$ to
 $2$. Since
 $g_z=0$, pressure is uniform across the flow domain (
 $p(z)/P_0\approx 1$), as shown in figure 2(d). However, the shear stress in figure 2(e) varies somewhat with depth due to the imposed velocity profiles, although its value at the location of the intruder is identical for all cases.
Typical results for controlled-shear-rate-gradient flows ( $g_z=0$,
 $P_0=1000$ Pa,
 $\dot {\gamma _0}=30\ \textrm {s}^{-1}$). (a–e) Profiles of the normalized velocity, shear rate, shear rate gradient, pressure and shear stress, respectively. Darker to lighter colours indicate
 $C_0$ varying from negative to positive (
 $-2\leqslant C_0h/\dot \gamma _0\leqslant 2$). Symbols in panel (a) indicate the steady-state
 $z$-location of the intruder. (f) Measured dimensionless segregation force
 $F_{seg}/P_0h^{2}$ versus dimensionless shear rate gradient
 $(\partial \dot \gamma /\partial {z})h/\dot \gamma _0$. Symbols correspond to those in panel (a), and the solid line indicates a linear fit to the data through the origin. Error bars represent the uncertainty of
 $F_{seg}$ due to its fluctuations in time (see § 2.2).

The key measurement here, the dimensionless force  $F_{seg}/P_0h$ exerted by bed particles on the intruder based on the measured virtual spring force, is plotted in figure 2(f) against the dimensionless local curvature
 $(\partial \dot \gamma /\partial {z})h/\dot \gamma _0$. It is evident that a nonlinear flow velocity profile alone induces a net contact force on the intruder that drives segregation. Since
 $F_{seg}$ is the only (net) force acting on the intruder in the no-gravity situation, negative values of
 $F_{seg}$ correspond to the large intruder ‘sinking’ (in the coordinate system of figure 1) toward high-shear regions, consistent with the trend of shear-driven segregation in dense vertical silo flows (Fan & Hill Reference Fan and Hill2011). Similarly, positive values of
 $F_{seg}$ indicate the large intruder ‘rising’, again, toward high-shear regions (see ‘rise’ and ‘sink’ in figure 2f). The relationship between
 $F_{seg}$ and
 $\partial \dot \gamma /\partial {z}$ is linear and through the origin, indicating no segregation force when there is no shear rate gradient, as would be expected. Note that both negative and positive curvatures are considered here despite the apparent symmetry of the segregation behaviour because the flow system we use is slightly asymmetric; the bottom wall is fixed whereas the top wall moves slightly in the
 $z$-direction in response to the constant
 $P_0$ boundary condition.
To explore the effect of local flow conditions on  $F_{seg}$, we repeat the cases in figure 2 with nine different combinations of
 $P_0$ and
 $\dot {\gamma }_0$ (in total
 $59$ simulations), leading to local inertial numbers
 $I$ varying from
 $0.05$ to
 $0.44$ (see figure 3b inset for
 $\mu (I)$ data). As shown in figure 3(a), the dependence of
 $F_{seg}$ on
 $\partial \dot \gamma /\partial {z}$ varies with
 $I$ when presented in physical units; the slope of the linear correlation tends to decrease as
 $I$ increases (from blue to red symbols). Note that since data have more scatter for small
 $I$ approaching the quasistatic limit (
 $<0.1$), a finer variation of
 $\partial \dot \gamma /\partial {z}$ is used in these cases resulting in more data points for small
 $I$.
Influence of  $P_0$ and
 $\dot \gamma _0$ on
 $F_{seg}$ in controlled-velocity flows (
 $g_z=0$). A range of local inertial numbers,
 $0.05\leqslant I \leqslant 0.44$ (colourbar), is explored with
 $500\ \text {Pa}\leqslant P_0\leqslant 2000\ \text {Pa}$ and
 $10\ \text {s}^{-1}\leqslant \dot \gamma _0 \leqslant 40\ \text {s}^{-1}$; for each (
 $P_0$,
 $\dot \gamma _0$) combination,
 $C_0h/\dot \gamma _0$ is varied from
 $-2$ to
 $2$ to generate negative to positive curvatures
 $\partial \dot \gamma /\partial {z}$. (a) Non-collapse of
 $F_{seg}$ vs
 $\partial \dot \gamma /\partial {z}$. (b) Collapse of
 $F_{seg}$ vs
 $(p/\dot {\gamma })(\partial \dot \gamma /\partial {z})V_i$. The solid line is a linear fit through (
 $0,0$) with slope
 $0.57$. Inset: local
 $\mu (I)$ measurements at
 $z=z_{eq}$. Reference curve
 $\mu (I)=0.36+(0.94-0.36)/(0.8/I+1)$ is obtained using our simple shear data far from boundaries and with no intruder.

To collapse the data, we consider the rescaled curvature from (1.3),  $(p/\dot {\gamma })(\partial \dot \gamma /\partial {z})V_i$, in units of force, which results in excellent collapse for the full range of
 $I$ that we examine, as shown in figure 3(b); that is,
 \begin{equation} F^{k}_{seg} :=\left. F_{seg}\right|_{g_z=0} \propto \frac{p}{\dot{\gamma}}\frac{\partial\dot{\gamma}}{\partial{z}}V_i, \end{equation}
where  $F^{k}_{seg}$ denotes the kinematics-induced part of
 $F_{seg}$. The proportionality constant is
 $0.57$ based on the linear fit in figure 3(b), and the correlation passes through the origin, indicating that no other effects are present.
The force scaling in (3.1) is based on dimensional analysis. Indeed, when  $g_z=0$, natural choices for normalizing
 $F_{seg}^{k}$ and
 $\partial \dot \gamma /\partial {z}$ are
 $pd_i^{2}$ and
 $\dot \gamma /d_i$, respectively, and the resulting scaling,
 $F_{seg}^{k}/pd_i^{2}\propto (\partial \dot \gamma /\partial {z})d_i/\dot \gamma$, or
 $F_{seg}^{k} \propto (p/\dot \gamma )(\partial \dot \gamma /\partial {z})d_i^{3}$, is equivalent to (3.1). However, here we prefer the volume-based expression (3.1) for consistency with the buoyancy-like term in (1.3) and following the previous scaling law (1.1). Moreover, the scaling
 $F_{seg}^{k}/pd_i^{2}\propto (\partial \dot \gamma /\partial {z})d_i/\dot \gamma$ is similar to the normalization in figure 2(f) except that the system length scale
 $h$ is replaced by the intruder diameter
 $d_i$ (giving rise to
 $V_i$) and that local flow conditions are used. To confirm that
 $d_i$ is the relevant length scale, we verified (omitted for brevity) that varying the flow thickness
 $h$ does not change the scaling of
 $F^{k}_{seg}$, but doubling both
 $d$ and
 $d_i$ (with fixed
 $R=2$) leads to a segregation force eight times larger, as the scaling predicts.
The curvature-based scaling (3.1) indicates that the shear rate gradient drives segregation in the absence of gravity. Although it is also possible to express a force scale in other ways (note that no pressure gradient is present so far), such as one related to the gradient of shear stress (Guillard et al. Reference Guillard, Forterre and Pouliquen2016), granular temperature (Fan & Hill Reference Fan and Hill2011) or the effective flow viscosity (van Schrojenstein Lantman Reference van Schrojenstein Lantman2019), we have verified that the current form (3.1) results in the simplest scaling while other choices do not collapse the data as well as the scaling used here. For instance, using  $\partial \tau /\partial {z}$ leads to scaling factors that depend on
 $I$ (or
 $\mu$), similar to those reported in Guillard et al. (Reference Guillard, Forterre and Pouliquen2016), which not only complicates the function but also reduces the generality of the scaling because
 $\mu (I)$ is not necessarily unique across flow geometries or in regions where non-local effects occur (GDR MiDi 2004), see also § 3.1.3. Nevertheless, in the Appendix (A) we demonstrate that if the flow obeys a local rheology (e.g.
 $\mu (I)$), our
 $\partial \dot \gamma /\partial {z}$-based scaling is equivalent to the
 $\partial \tau /\partial {z}$-based scaling proposed by Guillard et al. (Reference Guillard, Forterre and Pouliquen2016).
3.1.2. Adding gravity
With gravity ( $g_z>0$),
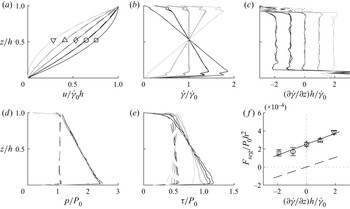
 $F_{seg}$ changes due to the induced pressure gradient. Figure 4 shows the same set of controlled-velocity flows as in figure 2 except with
 $g_z=5\ \textrm {m}\ \textrm {s}^{-2}$. The kinematics profiles (solid curves in figures 4a–c) are nearly identical to their no-gravity counterparts (dashed curves) because velocity profiles are imposed. Stress profiles, on the other hand, change significantly in response to the added gravitational field (while granular rheology remains the same, see below). Both pressure and shear-stress fields in figure 4(d,e) now include a hydrostatic component that is proportional to
 $\phi \rho g_z$. With these changes in the stress fields,
 $F_{seg}$ remains proportional to the rescaled curvature (symbols and solid line in figure 4f), but with a substantial positive offset compared with the no-gravity results (dashed line in figure 4f); the slopes of the two lines are nearly identical, indicating that the gravity-induced contribution to
 $F_{seg}$ does not change the kinematics contribution. Thus, the two terms in (1.3) are additive.


Next we consider a broader range of cases than in figure 4 by varying  $P_0$ and
 $\dot {\gamma }_0$ as well as
 $g_z$ (
 $75$ simulations in total). Figure 5(a) shows that the data for
 $F_{seg}$ at different values of
 $P_0$ and
 $\dot {\gamma }_0$, when plotted against
 $(p/\dot {\gamma })(\partial \dot \gamma /\partial {z})V_i$, collapse onto lines corresponding to each non-zero value of
 $g_z$ (similar to figure 3b for
 $g_z=0$). As
 $g_z$ is increased from
 $0$ (dashed line), the dependence of
 $F_{seg}$ on
 $p/\dot {\gamma }(\partial \dot \gamma /\partial {z})V_i$ remains linear (solid lines) with a slope independent of
 $g_z$ but shifted upward due to the imposed gravity. This further confirms the conclusion from figure 4(f) that the two terms in (1.3) are additive. Furthermore,
 $F_{seg}$ remains insensitive to
 $I$ (indicated by the symbol colours) over the range examined (
 $0.05< I<0.35$, note that varying
 $g_z$ tends to affect the range of
 $I$), and the rheological data of controlled-velocity flows (when gravity is turned on) still follow the
 $\mu (I)$ curve for simple shear (figure 5b inset).
(a) Measured segregation force in controlled-velocity flows with  $g_z=\{5,9.81,15\}\ \textrm {m}\ \textrm {s}^{-2}$. For each
 $g_z$, a range of local inertial numbers (colourbar) and local curvatures (horizontal axis) are explored with
 $500\ \text {Pa}\leqslant P_0\leqslant 1500\ \text {Pa}$,
 $10\ \text {s}^{-1}\leqslant \dot \gamma _0 \leqslant 40\ \text {s}^{-1}$ and
 $-2\leqslant C_0h/\dot \gamma _0\leqslant 2$. Solid lines are linear fits for the same
 $g_z$ (
 $g_z$ increases from bottom to top), while the dashed line represents
 $g_z=0$ results; all lines have the same slope of
 $0.57$. (b) Plot of
 $F_{seg}-F^{k}_{seg}$ versus
 $-(\partial {p}/\partial {z})V_i$. The solid line is a linear fit with slope
 $2.28$ that extends through the origin. Inset: local
 $\mu (I)$ measurements at
 $z=z_{eq}$, compared with simple shear results (curve; see caption of figure 3).

Because the gravity- and kinematics-related terms are additive, it is possible to use (3.1) to characterize the gravity-induced portion of the segregation force by simply subtracting  $F^{k}_{seg}$ from
 $F_{seg}$, which is plotted against
 $-(\partial {p}/\partial {z})V_i$ in figure 5(b). All data collapse onto a line passing through the origin, which indicates a buoyancy-like scaling consistent with the one we proposed (Jing et al. Reference Jing, Ottino, Lueptow and Umbanhowar2020) based only on constant-shear-rate flows (i.e.
 $F^{k}_{seg}=0$). That the fit passes through the origin indicates that
 $F_{seg}$ is completely described by the additive combination of gravitational and kinematic contributions, as indicated by (1.3). Note that the quadratic controlled-velocity profiles (2.1) reduce to linear-velocity profiles for
 $C_0=0$, and using only
 $C_0=0$ data produces the same linear fit as that in figure 5(b) (not shown as they are virtually identical). This again supports the assumption in (1.3) that the gravity- and kinematics-induced segregation forces are additive, and indicates that the gravity-related part can be measured using linear controlled-velocity flows, as in Jing et al. (Reference Jing, Ottino, Lueptow and Umbanhowar2020). Specifically,
 \begin{equation} F^{g}_{seg} := \left. F_{seg} \right|_{\partial\dot{\gamma}/\partial{z}=0} \propto{-}\frac{\partial{p}}{\partial{z}}V_i, \end{equation}
where the proportionality constant is  $2.28$ according to figure 5(b).
3.1.3. Validation in other flow geometries
In the previous two sections we establish scaling laws for the gravity- and kinematics-induced segregation forces that determine the net segregation force (for  $R=2$),
 \begin{equation} F_{seg} = F_{seg}^{g} + F_{seg}^{k} ={-}f^{g}\frac{\partial{p}}{\partial{z}}V_i + f^{k}\frac{p}{\dot{\gamma}}\frac{\partial\dot{\gamma}}{\partial{z}}V_i, \end{equation}
with  $f^{g}=2.28$ and
 $f^{k}=0.57$ based on controlled-velocity results for a wide range of inertial numbers (
 $0.05< I<0.35$). The two terms depend on several local flow properties, including
 $\partial {p}/\partial {z}$,
 $\partial {\dot \gamma }/\partial {z}$,
 $p$ and
 $\dot \gamma$, but the relative magnitude of the two terms can vary significantly for different flow geometries. Hence, we now show that (3.3) remains valid in other geometries, including confined and free surface flows, while keeping
 $R=2$.
Following the naming convention in figure 1, we measure  $F_{seg}$ in vertical silo (confined,
 $g_z=0$), horizontal wall-driven (confined,
 $g_x=0$), inclined wall-driven (confined,
 $g_x\neq 0$,
 $g_z\neq 0$) and inclined chute flows (free-surface), each with broadly varied system parameters covering a wide range of inertial numbers, shear rate gradients (curvatures) and pressure gradients (for
 $g_z\neq 0$) for
 $R=2$. Results from
 $52$ simulations across all flow geometries are reported in figure 6(a), in which the values for
 $F_{seg}$ measured in the simulations are plotted against predictions of (3.3). The agreement between the measured values and the predictions is remarkable, especially given the broad range of flow geometries and flow conditions that are considered. The broad range of flow conditions is further amplified in figure 6(b), where local rheological data for the cases are presented, ranging from quasistatic (
 $I<0.1$) to inertial flow regimes.
(a) Comparison of predicted  $F_{seg}$ (3.3) and measured
 $F_{seg}$ in four flow geometries, each with widely varied system parameters (see § 2.3 for the range of parameters). The line corresponds to a perfect match between predicted and measured values. (b) Measured
 $\mu (I)$ from simulations at
 $z=z_{eq}$ compared with reference curve from simple shear simulations (see caption of figure 3).

Three key points of figure 6 merit elaboration before the results are discussed in greater detail. First, the scaling (3.3) used to predict  $F_{seg}$ has only two independently determined parameters (
 $f^{g}$ and
 $f^{k}$), yet its predictions are accurate across flow geometries with widely varying boundary conditions and forcing. Second, vertical silo results of
 $F_{seg}$ in figure 6(a) are always negative due to the negative curvatures of the velocity profile (figure 1e), whereas horizontal wall-driven results of
 $F_{seg}$ are positive due to the added effect of positive curvatures (figure 1g) and gravity-induced contributions. For inclined wall-driven flows,
 $F_{seg}$ is either positive or negative due to the net effect of the flow velocity curvature (depending on
 $\theta$) and gravity. Inclined chute flow results in figure 6(a) are always positive and span a much narrower range; in fact, as illustrated below,
 $F^{k}_{seg}$ is nearly negligible in free-surface flows compared with
 $F^{g}_{seg}$. Third, rheological data in figure 6(b) for different flow geometries deviate slightly from the simple shear rheology, yet this deviation does not affect the accurate prediction of
 $F_{seg}$ in figure 6(a). Specifically, compared with the reference curve for simple shear, the confined flows without a controlled-velocity profile show systematic deviations that can be attributed to non-local effects near the edge of a localized shear layer (Kamrin & Koval Reference Kamrin and Koval2012). In contrast, inclined chute flows and controlled-velocity flows (see insets in figures 3 and 5) closely follow the
 $\mu (I)$ curve for simple shear. Nevertheless, the prediction made by (3.3) remains accurate despite these variations in rheology; comparable predictions in the stress-based scaling (1.1) are likely more challenging because it is
 $\mu$ dependent (Guillard et al. Reference Guillard, Forterre and Pouliquen2016).
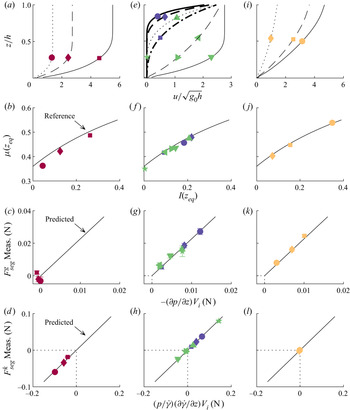
To better illustrate how gravity and flow kinematics contribute to the net segregation force in different flow geometries, we select representative cases for each geometry and present their velocity profiles, rheological data and the two components of  $F_{seg}$ in figure 7. A length scale
 $h$ and a velocity scale
 $\sqrt {g_0h}$ are consistently used for normalization, where
 $g_0=9.81\ \textrm {m}\ \textrm {s}^{-2}$ is fixed even though
 $g$ is case specific.
Representative results from vertical silo flows (a–d), horizontal and inclined wall-driven flows (e–h) and inclined chute flows (i–l); colour schemes match those in figure 6. Curves in panels (b,f,j) are reference  $\mu (I)$ curves based on simple shear results. The predicted lines in panels (c,g,k,d,h,l) have slopes of
 $2.28$ and
 $0.57$, respectively, based on (3.3).

(i) Vertical silo flows. Figure 7(a) shows velocity profiles (curves) and steady-state locations of the intruder (symbols) for three (out of a total of eight) representative vertical silo simulations (with varying  $u_0$ but the same
 $P_0$ and
 $g_x$). In vertical silo flows, shear is localized near the bottom wall with a concave-up velocity profile (negative curvature) connected to a plug-flow zone. The intruder is placed in the shear zone (
 $z_{eq}/h\approx 0.25$). Figure 7(b) shows rheological measurements around the intruder (symbols), which deviate from the simple shear reference curve (solid line) due to non-local effects in localized shear. The small deviation of the rheological data in this flow geometry is robust (e.g. increasing particle stiffness by a factor of 10 does not change the result significantly). Nevertheless, the scaling of
 $F_{seg}$ is unaffected by this variation in rheology.
Figure 7(c,d) show scaling of gravity- and kinematics-components of  $F_{seg}$ in the vertical silo flow simulations. To obtain measured (meas.)
 $F^{g}_{seg}$ and
 $F^{k}_{seg}$ (vertical axes), we subtract
 $0.57(p/\dot {\gamma })(\partial \dot {\gamma }/\partial {z})V_i$ and
 $-2.28(\partial {p}/\partial {z})V_i$ from the total measured
 $F_{seg}$, respectively, using local flow properties. The measured
 $F^{g}_{seg}$ and
 $F^{k}_{seg}$ are then compared with force scales
 $-(\partial {p}/\partial {z})V_i$ and
 $(p/\dot {\gamma })(\partial \dot {\gamma }/\partial {z})V_i$, showing excellent agreement with the predicted solid lines in figure 7(c,d). More specifically, data in figure 7(c) cluster around
 $(0,0)$ because
 $g_z=0$, whereas data in figure 7(d) spread along the negative portion of the predicted line because of differing negative curvatures. Therefore, the net effect of the total
 $F_{seg}$ for vertical silo flows is negative, meaning that an intruder tends to be pushed toward the immobile wall (high shear rate regions), agreeing with previous dense silo flow simulations (Fan & Hill Reference Fan and Hill2011).
(ii) Horizontal wall-driven flows. Thick curves in figure 7(e) are velocity profiles of selected horizontal wall-driven flows (three of  $16$ simulations for this condition) that are concave down (positive curvature) in the shear zone close to the top moving wall. The selected cases differ only in
 $g_z$ but have the same
 $u_0$ and
 $P_0$; the intruder fluctuates either around
 $z_{eq}/h\approx 0.75$ or
 $z_{eq}/h\approx 0.5$ (blue symbols). Figure 7(f) shows that the rheological measurements for wall-driven flows deviate only slightly from the simple shear reference curve. This, again, does not affect the scaling of the two components of
 $F_{seg}$, which follow the predictions in both figure 7(g,h). Results of
 $F^{k}_{seg}$ for these positive-curvature velocity profiles fall along the positive portion of the predicted line in figure 7(g), adding to
 $F^{g}_{seg}$, which is also positive. This indicates that the intruder tends to be pushed upward by the net
 $F_{seg}$ in wall-driven flows; imbalances between
 $F_{seg}$ and the intruder weight (
 $m_ig_z$) determine whether the intruder rises or sinks (Jing et al. Reference Jing, Ottino, Lueptow and Umbanhowar2020).
(iii) Inclined wall-driven flows. Thin curves in figure 7(e) are velocity profiles of inclined wall-driven flows that transition from concave down (dotted) to concave up (dashed and solid) for  $\theta =\{10,30,45\}^{\circ }$. The rheology (figure 7f) and
 $F^{g}_{seg}$ (green symbols in figure 7g) results are similar to normal wall-driven flows (
 $\theta =0$), but
 $F^{k}_{seg}$ (figure 7h) for inclined wall-driven flows varies from negative to positive due to the changed sign of
 $\partial \dot \gamma /\partial {z}$. Results match predictions (figure 7g,h) even when intruders are repositioned at different locations from
 $z_{eq}/h\approx 0.25$ to
 $z_{eq}/h\approx 0.75$, resulting in a wide range of local inertial numbers including a quasistatic case near the bottom of the flow (star symbol on the thin dotted curve in figure 7e).
(iv) Inclined chute flows. Finally, results of selected free-surface, inclined chute flows with  $\theta =\{22,24,28\}^{\circ }$ and corresponding
 $g=\{5,9.81,15\}\ \textrm {m}\ \textrm {s}^{-2}$ are presented in figure 7(i–l), covering a wide range of inertial numbers and pressure gradients. The Bagnold-type velocity profiles are always concave up (figure 7i), and local rheological measurements match the simple shear reference curve (figure 7j). Interestingly, as shown in figure 7(l), the rescaled local curvatures are always nearly zero even though the shear rate varies extensively (characterized by the span of
 $I$ in figure 7j). As such,
 $F^{k}_{seg}$ is negligible compared with
 $F^{g}_{seg}$ (figure 7k). This finding matches our recent results (Jing et al. Reference Jing, Ottino, Lueptow and Umbanhowar2020) showing that segregation forces in inclined chute flows scale primarily with pressure gradients but not shear rate gradients.
3.2. Variation of segregation force with $R$

3.2.1. Scaling based on controlled-velocity results
To this point, the fitting constants  $f^{g}$ and
 $f^{k}$ in scaling law (3.3) are specific to
 $R=2$. However, we previously showed (Jing et al. Reference Jing, Ottino, Lueptow and Umbanhowar2020) in constant-shear-rate flows (
 $F^{k}_{seg}=0$) and free-surface flows (
 $F^{k}_{seg}\approx 0$) that the scaling factor for
 $F^{g}_{seg}$ is a function of
 $R$, see also (1.2). To illustrate this, our data for
 $f^{g}:=F^{g}_{seg}/[-(\partial {p}/\partial {z})V_i]$ (Jing et al. Reference Jing, Ottino, Lueptow and Umbanhowar2020) are reproduced in figure 8(a) for
 $0.05\leqslant I \leqslant 0.24$. With this background, we now explore
 $F^{k}_{seg}$ for
 $0.2\leqslant R \leqslant 7$ using controlled-velocity, constant-curvature flows, where gravity is turned off (
 $F^{g}_{seg}=0$),
 $P_0$ and
 $\dot \gamma _0$ are varied for a wide range of
 $I$ (
 $0.03\leqslant I \leqslant 0.43$), and
 $C_0h/\dot \gamma _0=\pm 2$ is fixed to control the local curvature. In figure 8(b), results for
 $f^{k}:=F^{k}_{seg}/[(p/\dot \gamma )(\partial \dot \gamma /\partial {z})V_i]$ plotted versus
 $R$ collapse onto a master curve, despite widely varying local inertial numbers (indicated by colours). Note that the
 $f^{k}(R)$ data diverges somewhat for
 $R\gtrsim 4$, but with no systematic dependence on
 $I$; this diverging behaviour is discussed in § 3.2.2. In general, the
 $f^{k}(R)$ curve is negative for
 $R<1$, increases toward a peak at
 $R\approx 2$, and declines as
 $R$ is further increased; its shape is similar to its gravity-related counterpart
 $f^{g}(R)$ in figure 8(a).
Prefactors of (a) gravity- and (b) kinematics-related components of  $F_{seg}$ versus
 $R$ for controlled-velocity flows. Data in panel (a) are from Jing et al. (Reference Jing, Ottino, Lueptow and Umbanhowar2020) where constant-shear-rate flows with gravity (
 $C_0=0$,
 $g=9.81\ \textrm {m}\ \textrm {s}^{-2}$) are used, while simulations in panel (b) are constant-curvature, no-gravity flows (
 $C_0h/\dot \gamma _0=\pm 2$,
 $g=0$). In both configurations,
 $\dot \gamma _0$ and
 $P_0$ are varied to generate a range of local inertial numbers (colourbar). The solid curves in panels (a,b) are semiempirical fits described by (3.4) and (3.5), respectively, and the dotted curves indicate unexplored ranges of
 $R$. The dashed curve in panel (b) is a fit based only on data with
 $P_0\geqslant 1000$ Pa (see § 3.2.2). Dash–dotted horizontal lines in panels (a,b) indicate reference values for
 $f^{g}(R)$ and
 $f^{k}(R)$, respectively, when
 $R=1$ (monodisperse flow).

The forms of  $f^{g}(R)$ and
 $f^{k}(R)$ have interesting implications in relation to the underlying physics of gravity- and kinematics-induced segregation. As we previously noted (Jing et al. Reference Jing, Ottino, Lueptow and Umbanhowar2020), the gravity-induced segregation force approaches Archimedes’ buoyancy force in the continuum limit (i.e.
 $f^{g}(\infty )\rightarrow 1$); this force appears to be enhanced by finite-size effects and the discrete nature of particle contacts for
 $1\lesssim R \lesssim 10$ but weakened by kinetics-driven percolation for
 $R\lesssim 1$, giving rise to the peak at
 $R\approx 2$.
The kinematics-induced segregation force might follow a similar geometric argument but with some unique characteristics. A key observation is that  $f^{k}(R)$ changes sign at
 ${R\approx 1}$. Indeed, no net segregation force (perpendicular to shear) is expected for
 $R=1$, which is simply a monodisperse flow. The physical implications of the negative and positive parts of
 $f^{k}(R)$ for
 $R<1$ and
 $R>1$, respectively, are discussed below.
(i) Collision dominant for small intruders. For  $R<1$,
 $f^{k}(R)$ is negative, indicating that a small intruder is pushed from higher shear rate regions toward lower shear rate regions; this is reminiscent of a collisional argument in dilute granular flows whereby particles migrate from higher to lower granular temperatures (Jenkins & Yoon Reference Jenkins and Yoon2002; Trujillo, Alam & Herrmann Reference Trujillo, Alam and Herrmann2003; Fan & Hill Reference Fan and Hill2011). Although the flows described here are dense (
 $I\lesssim 0.5$), contact forces acting on a small intruder are primarily collisional (as opposed to enduring) as a small intruder tends to percolate through voids (Silbert et al. Reference Silbert, Grest, Brewster and Levine2007; Jing et al. Reference Jing, Kwok and Leung2017). As a result, small intruders experience larger contact forces from the ‘hotter’ (higher shear rate and hence higher granular temperature) side and are thereby pushed toward the ‘cooler’ side, corresponding to
 $f^{k}(R)<0$ for
 $R<1$.
(ii) Friction dominant for large intruders. For  $R>1$, intruder particles tend to undergo more enduring frictional contacts rather than collisional contacts (Fan & Hill Reference Fan and Hill2011; Jing et al. Reference Jing, Kwok and Leung2017). Enduring contact forces are expected to be enhanced by a lower shear rate due to the increase in force correlation length, or cluster size (Lois, LemaÎtre & Carlson Reference Lois, LemaÎtre and Carlson2006; Fan & Hill Reference Fan and Hill2011), as well as the increase in contact duration (Silbert et al. Reference Silbert, Grest, Brewster and Levine2007). As a result, large intruders experience larger contact forces from lower shear rate regions and are thereby pushed toward higher shear rate regions, which corresponds to
 $f^{k}(R)>0$ for
 $R>1$. The peak of
 $f^{k}(R)$ at
 $R\approx 2$ indicates that the frictional effect is enhanced due to finite-size effects similar to those for
 $f^{g}(R)$ (Jing et al. Reference Jing, Ottino, Lueptow and Umbanhowar2020).
(iii) Continuum limit as  $R\rightarrow \infty$. The flow of bed particles surrounding an intruder can be viewed as a continuum (a complex fluid) as
 $R\rightarrow \infty$, and it is intriguing to consider whether the segregation force has a parallel in Newtonian fluid flows. However, unlike the Archimedean buoyancy limit for the gravity-induced segregation force, i.e.
 $f^{g}(\infty )\rightarrow 1$ (see figure 8a), the behaviour of
 $f^{k}(R)$ for
 $R\rightarrow \infty$ is less straightforward (figure 8b). The force (perpendicular to shear and toward higher shear rates) induced by the curvature of a flow velocity profile is reminiscent of the ‘shear gradient lift force’,
 $F_{SG}$, for inertial focusing in microfluidics (Martel & Toner Reference Martel and Toner2014), which is also known as the tubular pinch effect (Segré & Silberberg Reference Segré and Silberberg1961; Matas, Morris & Guazzelli Reference Matas, Morris and Guazzelli2004). Despite the complex dependence of
 $F_{SG}$ on the flow Reynolds number
 $Re$ and the particle distance to the channel wall
 $z/D_h$, where
 $D_h$ is the hydraulic diameter of the channel, a scaling law for
 $F_{SG}$ has been derived for small particle Reynolds numbers (Asmolov Reference Asmolov1999) and empirically determined in microfluidic systems (Di Carlo et al. Reference Di Carlo, Edd, Humphry, Stone and Toner2009) as
 $F_{SG}=C_{SG}\rho _fU_m^{2}a^{3}/D_h$, where
 $\rho _f$ is the fluid density,
 $U_m$ is the maximum channel flow velocity,
 $a$ is the particle radius (i.e.
 $a=d_i/2$ here) and the lift coefficient
 $C_{SG}$ is a dimensionless function of
 $Re$,
 $z/D_h$ and
 $a/D_h$. Note that for channel flows of a Newtonian fluid, the velocity profile is typically parabolic (similar to our velocity profile (2.1)) with
 $U_m$ appearing at the centreline and has a constant shear rate gradient
 $\partial {\dot \gamma }/\partial {z} \propto U_m/D_h^{2}$. For a shear rate scale
 $U_m/D_h$ and a (hydrodynamic) pressure scale
 $\rho _fU_m^{2}$, we have
 $F^{k}_{seg}\propto (p/\dot \gamma )(\partial {\dot \gamma }/\partial {z})V_i^{3}\propto \rho _fU_m^{2}a^{3}/D_h$, consistent with the scaling of
 $F_{SG}$. Therefore, it seems plausible to connect our kinematics-induced segregation force (in the large
 $R$ limit) with the shear gradient lift force that is partly responsible for cross-streamline migration of particles in confined fluid flows from lower to higher shear rate regions. Of course, further investigation is warranted to shed more light on this connection as well as to consider other inertial lift forces as a possible continuum limit for
 $F^{k}_{seg}$, such as those induced by wall effects (Martel & Toner Reference Martel and Toner2014; Ekanayake et al. Reference Ekanayake, Berry, Stickland, Dunstan, Muir, Dower and Harvie2020), slip velocity (Asmolov Reference Asmolov1999; Ekanayake et al. Reference Ekanayake, Berry, Stickland, Dunstan, Muir, Dower and Harvie2020) and the Saffman lift effect (Saffman Reference Saffman1965; van der Vaart et al. Reference van der Vaart, van Schrojenstein Lantman, Weinhart, Luding, Ancey and Thornton2018). Nevertheless, based on the understanding and scaling arguments above, we assume that
 $f^{k}(R)$ approaches a positive finite value (denoted as
 $f^{k}_\infty$) as
 $R\rightarrow \infty$ and use this assumption to constrain our empirical fit in the subsequent analysis.
It is convenient to fit the collapsed data in figure 8 to functions, but it is unclear how to derive such functions analytically because they would need to bridge two unrelated physical phenomena: brief intermittent collisions at small  $R$ and enduring multiple contacts at large
 $R$. In our previous work (Jing et al. Reference Jing, Ottino, Lueptow and Umbanhowar2020), we use a double-exponential function to fit the data in figure 8(a) based on the understanding that the two geometric effects explained above (percolation for
 $R\lesssim 1$ and enhanced frictional contacts for
 $R\gtrsim 1$) tend to saturate as
 $R$ increases, and that exponential decays are not uncommon in segregation phenomena (Savage & Lun Reference Savage and Lun1988; Khola & Wassgren Reference Khola and Wassgren2016; Schlick et al. Reference Schlick, Fan, Isner, Umbanhowar, Ottino and Lueptow2015). The semiempirical fit for
 $f^{g}(R)$ is
 \begin{equation} f^{g}(R) = \left[1-c^{g}_1\exp\left({-\frac{R}{R^{g}_1}}\right)\right] \left[1+c^{g}_2\exp\left({-\frac{R}{R^{g}_2}}\right)\right], \end{equation}
where  $R^{g}_1=0.92$,
 $R^{g}_2=2.94$,
 $c^{g}_1=1.43$ and
 $c^{g}_2=3.55$ are fitting parameters (Jing et al. Reference Jing, Ottino, Lueptow and Umbanhowar2020). A detailed explanation for the expression (3.4), along with evidence for an exponential decay of an enhanced contact number density around the intruder as
 $R$ increases, is provided by Jing et al. (Reference Jing, Ottino, Lueptow and Umbanhowar2020). Briefly, the first term accounts for necessary percolation at small
 $R$ and the second term accounts for enhanced enduring contacts acting on the intruder at large
 $R$.
Here we fit the data for  $f^{k}(R)$ in figure 8(b) to a functional form similar to (3.4),
 \begin{equation} f^{k}(R) = f^{k}_\infty \left[\tanh\left(\frac{R-1}{R^{k}_1}\right)\right] \left[1+c^{k}_2\exp\left({-\frac{R}{R^{k}_2}}\right)\right], \end{equation}
where  $f^{k}_\infty =0.19$,
 $R^{k}_1=0.59$,
 $R^{k}_2=5.48$ and
 $c^{k}_2=3.63$ are fitting parameters. Compared with (3.4), a non-unity prefactor
 $f^{k}_\infty$ is used to match the assumption that
 $f^{k}(\infty )\rightarrow {f}^{k}_\infty$, and the first exponential function is replaced by a hyperbolic tangent function (i.e.
 $\tanh [(R-1)/R^{k}_1]$, which passes through zero at
 $R=1$ and approaches
 $1$ and
 $-1$ for
 $R\gtrsim 2$ and
 $R\rightarrow 0$, respectively) to better match the data for
 $0< R\lesssim 2$ in figure 8(b). Although the latter modification is phenomenological, it is interesting to note that the fitted ‘shape factor’
 $R^{k}_1$ for the
 $\tanh$ function in (3.5) is similar to
 $R^{g}_1$ in the first exponential function of (3.4) in that the values are similar in magnitude and less than one. The similarity comes about because both indicate that the geometric effects related to small intruders (percolation and collision dominant for
 $R<1$) decay with a ‘characteristic size ratio’ of order one. Likewise, the second exponential function of (3.4) and (3.5) each decay with a ‘characteristic size ratio’ (
 $R^{g}_2$ and
 $R^{k}_2$, respectively) that has a physically relevant value, considering the observation that the contact number density around an intruder increases sharply with
 $R$ for
 $R\lesssim 3$ and saturates for
 $R\gtrsim 5$, see Jing et al. (Reference Jing, Ottino, Lueptow and Umbanhowar2020).
Despite the physical intuition associated with our semiempirical models (3.4) and (3.5), one might choose other forms to fit the data in figure 8. Ideally, a theoretical approach for determining  $f^{g}(R)$ and
 $f^{k}(R)$ may be possible, perhaps one that extends kinetic theories for segregation (Jenkins & Yoon Reference Jenkins and Yoon2002; Trujillo et al. Reference Trujillo, Alam and Herrmann2003; Duan et al. Reference Duan, Umbanhowar, Ottino and Lueptow2020) into the dense limit.
3.2.2. Validation of $R$-scaling in other flow geometries

Although the unified scaling (1.3) is based on a wide range of flow conditions in figure 1(a–c), the dependence of the semiempirical relations (3.4) and (3.5) on  $R$ shown in figure 8 is exclusively based on controlled-velocity confined flow conditions (figure 1a), where parameters for
 $f^{g}(R)$ and
 $f^{k}(R)$ are calibrated separately by eliminating velocity profile curvatures and gravity, respectively. To validate the
 $R$-scaling for flow geometries where gravity and flow curvatures coexist, we focus on an inclined chute flow and a horizontal wall-driven confined flow, varying
 $R$ in each case and comparing the predicted
 $F_{seg}$ with simulation results (figure 9).
Validation of predicted  $F_{seg}/m_ig$ versus
 $R$ in inclined chute flow (blue circles) (
 $h/d\approx 40$,
 $\theta =24^{\circ }$, and
 $g=9.81\ \textrm {m}\ \textrm {s}^{-2}$) and wall-driven flow (red squares) (
 $h/d\approx 40$,
 $P_0=1500$ Pa,
 $\dot \gamma _0=20\ \textrm {s}^{-1}$ and
 $g=3\ \textrm {m}\ \textrm {s}^{-2}$) with varying
 $R$. Solid curves are predictions based on the scaling law (1.3) and the empirical fitting functions (3.4) and (3.5). Dashed curves are predictions based on a refitted
 $f^{k}(R)$ curve considering only a subset of data with
 $P_0\geqslant 1000$ Pa (see figure 8 and text). Model inputs for predictions are local flow properties at the height of the intruder
 $z_{eq}\approx 0.5h$ taken from corresponding simulations. Areas above and below the dotted horizontal line at
 $F_{seg}/m_ig=1$ indicate where the intruder tends to rise and sink, respectively.

First, consider results for varying  $R$ in an inclined chute flow (
 $\theta =24^{\circ }$,
 $g=9.81\ \textrm {m}\ \textrm {s}^{-2}$) in figure 9, where local flow properties at
 $z=z_{eq}$ are
 $-\partial {p}/\partial {z}=1.3\times 10^{4} \ \textrm {Pa}\ \textrm {m}^{-1}$ and
 $(p/\dot \gamma )(\partial \dot \gamma /\partial {z})=-0.6\times 10^{4} \ \textrm {Pa}\ \textrm {m}^{-1}$. The resulting kinematic term is nearly 10 times smaller than the gravity term, noting that the prefactor
 $f^{k}$ is approximately one-fourth of
 $f^{g}$ (figure 8). Calculating the appropriate prefactors using (3.4) and (3.5) based on
 $R$ and substituting them into (1.3) yields a prediction (blue solid curve in figure 9) that agrees well with simulation results (blue circles). Note that we report
 $F_{seg}/m_ig_z$ in figure 9 to indicate whether an intruder tends to rise or sink; if
 $F_{seg}/m_ig_z>1$, the segregation force is greater than the intruder weight and thereby pushes the intruder upward, whereas if
 $F_{seg}/m_ig_z<1$, the segregation force is insufficient to support the intruder weight and the intruder sinks. For the inclined chute flow, a large intruder with
 $1< R<4$ tends to rise, while a small intruder (
 $R<1$) sinks, agreeing with the tendency of ‘normal’ segregation. However, for
 $R>4$ the intruder tends to sink due to its large weight, known as ‘reverse’ segregation (Félix & Thomas Reference Félix and Thomas2004).
For the second case of a wall-driven flow ( $P_0=1500$ Pa,
 $\dot \gamma _0=20\ \textrm {s}^{-1}$,
 $g=3\ \textrm {m}\ \textrm {s}^{-2}$) with local flow properties
 $-\partial {p}/\partial {z}=0.4\times 10^{4} \ \textrm {Pa}\ \textrm {m}^{-1}$ and
 $(p/\dot \gamma )(\partial \dot \gamma /\partial {z})=3.3\times 10^{4} \ \textrm {Pa}\ \textrm {m}^{-1}$, the kinematics contribution is approximately two times larger than its gravity counterpart, and, importantly, both terms are positive. This leads to a much larger predicted segregation force (red solid curve), which agrees well with simulation results (red squares) for
 $R\lesssim 2$. However, the agreement beyond
 $R>2$ is not as good. Recalling that the
 $f^{k}(R)$ data in figure 8(b) show growing scatter for
 $R\gtrsim 4$, the mismatch may be attributed to additional mechanisms not considered in our scaling, especially for this range of
 $R$. To understand this, we have examined the effects of the inertial number (which considers case-specific
 $\dot \gamma$ and
 $p$), stiffness of the virtual spring that is attached to the intruder, the thickness of the flowing layer, and the domain size (particularly in the spanwise direction), but none of these explain the mismatch. One possible mechanism lies in the overburden pressure: for
 $P_0\geqslant 1000$ Pa,
 $f^{k}(R)$ values in figure 8(b) tend to appear near the lower edge of the scatter, especially for
 $R>2$, regardless of the local shear rate varying from
 $10\ \textrm {s}^{-1}$ to
 $40\ \textrm {s}^{-1}$. This becomes evident when fitting (3.5) to only the data with
 $P_0\geqslant 1000$ Pa, corresponding to the dashed curve in figure 8(b). On the other hand, all wall-driven flows we consider (including those in figure 9) fall into this higher overburden pressure category (which have
 $P_0\geqslant 1500$ Pa) in order to ensure a flowing layer that is
 $10d$ to
 $30d$ thick (wall-driven flows tend to localize near the top wall). Hence, using the fit to (3.5) based on the subset of the
 $f^{k}(R)$ data with
 $P_0\geqslant 1000$ Pa (dashed curve in figure 8b) significantly improves the agreement of the predicted (red dashed) curve with wall-driven data in figure 9. Although we do not have an explanation for this secondary overburden pressure dependence (which is not characterized by the inertial number and is reminiscent of non-local effects in granular flows), it appears to be only significant for very large intruders in shear-dominant cases. It might be plausible to examine if local velocity fluctuations (relative to local pressure) play a role (Kim & Kamrin Reference Kim and Kamrin2020), but this is beyond the scope of this work. Note that the prediction for the inclined chute flow (blue dashed curve in figure 9) is not affected by this treatment, because the kinematics contribution associated with
 $f^{k}(R)$ is negligible in free-surface flows (Jing et al. Reference Jing, Ottino, Lueptow and Umbanhowar2020).
Nevertheless, we stress that even without the overburden pressure-specific treatment, the overall agreement in figure 9 is still promising, especially given that the prediction for two very different flow geometries (wall-driven and free-surface) is based purely on independent velocity-controlled flows, and the discrepancy is not larger than the inherent scatter of the data in figure 8. More interestingly, it is clear from figure 9 that  $F_{seg}/m_ig_z$ in wall-driven flows is well above one for
 $R>1$ due to the strong positive kinematics contribution (as predicted by our scaling law), and, as a result, the reverse segregation regime (
 $F_{seg}/m_ig_z<1$) is difficult to reach by varying
 $R$ alone; indeed, our model predicts that a crossover will occur at
 $R\approx 13$ for this wall-driven flow. The significant difference between the rise–sink transitions indicated by
 $F_{seg}/m_ig_z$ in inclined chute and wall-driven flows may explain why results based on confined flow simulations alone fail to predict the sinking of very large intruders as noted by Guillard et al. (Reference Guillard, Forterre and Pouliquen2016), even though this behaviour is observed in free-surface-flow experiments (Félix & Thomas Reference Félix and Thomas2004).
4. Conclusion
In this paper, we have used extensive DEM simulations to develop a unified description of the gravity- and kinematics-induced segregation forces on an intruder particle in dense granular flows. It is based on a fundamental scaling law (1.3) that has been validated for flows in various confined and free-surface geometries. The scaling law has two additive terms, one related to gravity (buoyancy-like) and the other related to flow kinematics (specifically, the shear rate gradient); semiempirical prefactors for both terms depend only on the particle size ratio but not local flow properties, although the overburden pressure might cause a slight secondary effect for very large intruders. The relative significance of the two contributions vary, and this unified description of segregation forces enhances our understanding of the tendency and physical origin of segregation in different flow geometries. For free-surface flows where the velocity profile typically has small shear rate gradients, the gravity-induced segregation force dominates. In fact, rising and sinking of intruders in free-surface flows can be predicted by comparing the size-corrected buoyancy force alone with the intruder weight, resulting in a phase diagram determined only by the size and density ratios (Jing et al. Reference Jing, Ottino, Lueptow and Umbanhowar2020). For vertical silo flows where segregation is normal to gravity, kinematics-induced segregation forces cause large (small) intruders to migrate toward (away from) the wall, consistent with previous results (Fan & Hill Reference Fan and Hill2011). Both mechanisms are significant in wall-driven flows (where they cooperate) and inclined wall-driven flows (where they either cooperate or compete, depending on the angle of inclination).
The physical origin of the kinematics-induced segregation force is clarified by considering its shear rate gradient-based scaling and the nature of contact forces acting on an intruder: for large intruders ( $R>1$), which experience enduring frictional forces, larger forces are possible for lower shear rates (more persistent), whereas for small intruders (
 $R<1$), which preferentially receive collisional forces, larger forces occur in higher shear rate regions (more impulsive). It is also interesting that for wall-driven flows, which are relevant to annular shear (Golick & Daniels Reference Golick and Daniels2009) and fluid-driven bedload transport (Ferdowsi et al. Reference Ferdowsi, Ortiz, Houssais and Jerolmack2017), both segregation-driving mechanisms (gravity- and kinematics-induced) act in the same direction against gravity and, therefore, sinking of large particles due to weight effects does not occur as readily as in free-surface flows (Félix & Thomas Reference Félix and Thomas2004). From a practical standpoint, our results suggest that it may be possible to design experimental or industrial devices that minimize segregation (or, equivalently, enhance particle mixing) by manipulating the velocity profile (e.g. inclined wall-driven flows with appropriate inclinations), such that the kinematics-induced contribution to the segregation force counteracts gravitational contributions.
The unified description of segregation forces presented here is based on the limit where the intruder concentration approaches zero. However, the question naturally arises as to its applicability at higher intruder concentrations. We have already demonstrated (Jing et al. Reference Jing, Ottino, Lueptow and Umbanhowar2020) that it compares well with free-surface-flow experiments (Félix & Thomas Reference Félix and Thomas2004) for larger concentrations (approximately  $10\,\%$) where intruder particles interact with each other infrequently and gravity-induced segregation forces dominate over kinematics-induced forces. Recent work also indicates that under certain conditions combined size and density segregation can be nearly independent of either the particle size or density ratio at small concentrations, but further increasing the concentration leads to significant changes in the segregation behaviour (Duan et al. Reference Duan, Umbanhowar, Ottino and Lueptow2021). Understanding how segregation forces depend on the particle concentration is of great interest due to the complex concentration dependence of segregation fluxes (Gajjar & Gray Reference Gajjar and Gray2014; Gray & Ancey Reference Gray and Ancey2015; van der Vaart et al. Reference van der Vaart, Gajjar, Epely-Chauvin, Andreini, Gray and Ancey2015; Jing et al. Reference Jing, Kwok and Leung2017; Jones et al. Reference Jones, Isner, Xiao, Ottino, Umbanhowar and Lueptow2018; Duan et al. Reference Duan, Umbanhowar, Ottino and Lueptow2021). Extending the current model toward finite intruder particle concentrations has the potential to further elucidate the underlying physics of granular segregation as well as to enhance continuum modelling of granular segregation (Tripathi et al. Reference Tripathi, Kumar, Nema and Khakhar2021; Rousseau et al. Reference Rousseau, Chassagne, Chauchat, Maurin and Frey2021), which will be addressed in future work.
Finally, the segregation force studied in this paper, as well as in Guillard et al. (Reference Guillard, Forterre and Pouliquen2016), van der Vaart et al. (Reference van der Vaart, van Schrojenstein Lantman, Weinhart, Luding, Ancey and Thornton2018) and Jing et al. (Reference Jing, Ottino, Lueptow and Umbanhowar2020), is measured on intruder particles tethered to a virtual spring, which effectively prevents segregation. That is, the mean relative velocity between the intruder and bed particles is zero in the segregation ( $z$) direction once the intruder reaches an equilibrium
 $z$-position. If the intruder is untethered and the net force is unbalanced, a relative velocity between the intruder and its surrounding bed particles will develop (Tripathi & Khakhar Reference Tripathi and Khakhar2011; Staron Reference Staron2018), leading to a resistive force (often viewed as the drag force) that can be associated with the relative velocity as well as other parameters. Previous studies on the drag force during particle segregation have focused on density-bidisperse but size-monodisperse flows (Tripathi & Khakhar Reference Tripathi and Khakhar2011, Reference Tripathi and Khakhar2013; Duan et al. Reference Duan, Umbanhowar, Ottino and Lueptow2020) due to the lack of a general description of the segregation force. With the segregation force model developed here, it is now possible to study the drag force in more general segregation situations where particles differ in both size and density (Duan et al. Reference Duan, Umbanhowar, Ottino and Lueptow2021; Tripathi et al. Reference Tripathi, Kumar, Nema and Khakhar2021).
Supplementary data
Supplementary material is available at https://doi.org/10.1017/jfm.2021.688.
Acknowledgements
We thank Y. Fan, J. Hecht and Y. Duan for valuable discussions. The research is facilitated in part by the computational resources and staff contributions provided by the Quest high performance computing facility at Northwestern University, which is jointly supported by the Office of the Provost, the Office for Research and Northwestern University Information Technology.
Funding
This material is based upon work supported by the National Science Foundation under grant no. CBET-1929265.
Declaration of interests
The authors report no conflict of interest.
Appendix A. Connection with a previous model
Here we demonstrate how our  $\partial \dot \gamma /\partial {z}$-based scaling (1.3) is connected with the previous scaling (1.1) where
 $\partial \tau /\partial {z}$ is used (Guillard et al. Reference Guillard, Forterre and Pouliquen2016) when a local rheology is assumed. For simplicity, we adopt a linear rheological law,
 \begin{equation} \mu(I)=\mu_s+bI, \end{equation}
where  $\mu _s$ and
 $b$ are constants. The linear form (da Cruz et al. Reference da Cruz, Emam, Prochnow, Roux and Chevoir2005) is a good approximation of our
 $\mu (I)$ data, at least for
 $I<0.3$ (see figure 6).
Expressing  $\partial \tau /\partial {z}$ using (A1) with
 $\tau =\mu p$ and
 $I=\dot \gamma d/\sqrt {p/\rho }$, we have
 \begin{equation} \frac{\partial\tau}{\partial z} = \mu\frac{\partial p}{\partial z}+p\frac{\partial\mu}{\partial z} = \mu\frac{\partial p}{\partial z}+p\frac{\partial}{\partial z}\left(b\frac{\dot\gamma d}{\sqrt{p/\rho}}\right). \end{equation}
Expanding (A2) and eliminating  $b$ by identifying
 $b=(\mu -\mu _s)/I$ yields
 \begin{equation} \frac{\partial\tau}{\partial z} = \frac{1}{2}(\mu+\mu_s)\frac{\partial p}{\partial z} + (\mu-\mu_s)\frac{p}{\dot\gamma}\frac{\partial\dot\gamma}{\partial z}. \end{equation}
Rearranging and substituting (A3) into (1.3), we have
 \begin{equation} F_{seg}={-}\underbrace{\left[ f^{g}(R)+\frac{1}{2}f^{k}(R)\frac{\mu+\mu_s}{\mu-\mu_s} \right]}_{{\sim} \mathcal{A}(\mu,R)} \frac{\partial p}{\partial z}V_i + \underbrace{\frac{f^{k}(R)}{\mu-\mu_s}}_{{\sim} \mathcal{B}(\mu,R)} \frac{\partial \tau}{\partial z}V_i, \end{equation}
where  $f^{g}(R)$ and
 $f^{k}(R)$ are prefactors of our scaling (1.3), while the under-braced terms are rational functions of
 $\mu$ with shapes similar to
 $\mathcal {A}(\mu ,R)$ and
 $\mathcal {B}(\mu ,R)$ in (1.1), which are described by exponential functions in Guillard et al. (Reference Guillard, Forterre and Pouliquen2016).
From this analysis, it is clear that the  $\mu$ dependence in (1.1) emerges as a result of the adopted
 $\mu (I)$ rheology that connects
 $\tau$ and
 $\dot \gamma$ via a unique function. Although our kinematics-based scaling (1.3) can be transformed into the stress-based scaling (1.1) with certain assumptions, we note that our scaling decouples gravity- and shear-induced (or kinematics-induced) segregation forces. Consequently, each of the resulting terms requires fewer fitting parameters (insensitive to
 $\mu$). Moreover, the shear-rate-gradient-based scaling helps reveal important aspects of the underlying physics of kinematics-induced segregation in dense granular flows. Nevertheless, both stress- and shear-rate-based formulations can be useful in certain practical situations, such as experiments where either the stress or kinematics profiles are more conveniently controlled or measured, and numerical implementations where the stress or shear rate profiles may not be readily accessible as part of the solution.