Improving the use of antibiotics to protect patients across the spectrum of healthcare delivery is a national priority.1, 2 Toward this end, the Centers for Medicare and Medicaid Services (CMS) requires nursing homes to have an antibiotic stewardship program as part of a package to improve the care and safety of the nearly 1.5 million residents in US long-term care facilities that participate in the Medicare and Medicaid programs.3–5 Core components of nursing home antibiotic stewardship programs have been described by the Centers for Disease Control and Prevention (CDC); one component recommended by CDC that can be easily assessed by state surveyors evaluating facilities for compliance with the CMS requirements is access to and use of a facility antibiogram in developing empiric antibiotic selections.6, Reference Drinka, Podzorski and Griffin7
Antibiograms, also referred to as cumulative susceptibility reports, provide clinical information about the prevalence of resistant pathogens at an institution.Reference Dellit, Owens and McGowan8–Reference Hindler and Stelling10 The Clinical and Laboratory Standards Institute (CLSI) M39-A2 guidelines define the best practices for creating these reports for acute-care facilities.Reference Hindler and Stelling10 However, most nursing homes send too few clinical samples in a given year to generate an antibiogram consistent with the recommended method (having at test results from at least 30 isolates of a specific bacterial species) of summarizing facility-specific data. Healthcare facilities may combine data over years, if necessary, to achieve this requirement.Reference Furuno, Comer and Johnson11, Reference Moehring, Hazen, Hawkins, Drew, Sexton and Anderson12 However, even when combining 2 or 3 years of data, individual nursing homes may have insufficient data to produce useful results for most bacterial species. Although recent researchers have concluded that regional antibiograms may be a useful approach to overcoming this challenge for small community hospitals,Reference Moehring, Hazen, Hawkins, Drew, Sexton and Anderson12 it has not been evaluated for nursing homes, where the frequency of isolates available for testing in a given year may be extremely low.6, Reference Furuno, Comer and Johnson11
Aggregating data across groups of nursing homes into a single regional antibiogram may be a practical way to overcome this limitation to traditional guidance on creating antibiogramsReference Pakyz9, Reference Hindler and Stelling10; however, no data exist to justify which types of facilities are most appropriate for grouping into combined antibiograms or how to best avoid skewing summary metrics on resistance patterns toward facilities with more tested isolates contributing to the antibiogram. In this study, we aggregated antimicrobial susceptibility data from >200 nursing homes in Georgia to help determine how to best provide the stewardship programs at these nursing homes with an antibiogram for use in creating empiric prescribing policies when they have no other available data. The objectives of this study were (1) to estimate the percent of isolates susceptible to a tested antibiotic after accounting for variation in the relevant facility-level factors predictive of susceptibility and (2) to identify nursing home facility characteristics predictive of susceptibility to an antibiotic.
Methods
Microbiology data
Emory University partnered with Clinical Laboratory Services (CLS, Winder, GA) to access susceptibility testing data regarding isolates recovered from urine cultures submitted by nursing homes in Georgia. CLS is a full-service referral laboratory specializing in processing specimens from nursing homes, including microbiologic testing of clinical specimens. Their client base spans several states in southeastern United States, including most of the nursing homes in Georgia. For our analysis, we collated susceptibility test data from 2016 and 2017 for the 5 most common bacterial species associated with urinary tract infection in nursing home residents: Escherichia coli, Klebsiella pneumoniae, Proteus mirabilis, Pseudomonas aeruginosa, and Enterococcus faecalis. We chose test results for susceptibility to several agents by each of these organisms; we intended to cover agents most commonly used to treat urinary tract infections in nursing home residents. CLS uses MicroScan Walkaway96 Plus (Beckman Coulter Diagnostics, Brea CA), with suppression of select test results consistent with industry standards (eg, second-generation cephalosporin suppressed if gram-negative fermenters test susceptible to cefazolin). We defined fluoroquinolone susceptibility as susceptibility to both ciprofloxacin and levofloxacin. We evaluated 23 antibiotic-pathogen pairs overall: E. coli and K. pneumoniae susceptibility to cefazolin, fluoroquinolones, imipenem, nitrofurantoin, and/or trimethoprim-sulfamethoxazole; P. mirabilis susceptibility to cefazolin, fluoroquinolones, nitrofurantoin, and/or trimethoprim-sulfamethoxazole; P. aeruginosa susceptibility to gentamicin, fluoroquinolones, imipenem, and/or piperacillin-tazobactam; and E. faecalis susceptibility to ampicillin, fluoroquinolones, linezolid, nitrofurantoin, and/or vancomycin.
Nursing homes
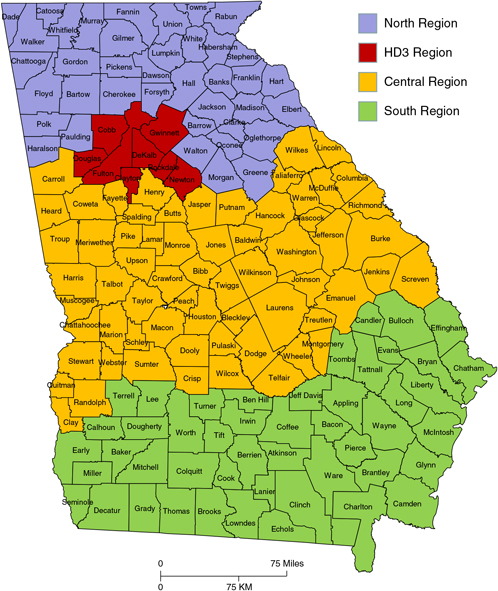
The analytic dataset was limited to results of urine specimens submitted from nursing homes in the state of Georgia designated by the CMS as a skilled nursing facility (SNF). Eligible nursing homes were linked to their appropriate CMS certification number to confirm their SNF status; our dataset included 231 (66%) of the 346 nongovernment SNFs operating in Georgia. Facility characteristics were accessed in the Nursing Home Compare and the SNF Cost Reports for 2016, including the annual facility average length of stay among all residents, average age of residents, and average number of occupied beds.13 Facility location was categorized by established regions utilized by the Georgia Department of Public Health (Fig. 1).14
Geographic groups of health districts in Georgia used for the study.13

Data analysis
Facility characteristics were summarized by public health region. For each bacterial species (ie, isolate), the number of isolates available for testing in a 2017 was determined for each institution and categorized into <10, 10–19, and ≥20 isolates. We considered the latter category as potentially sufficient for a facility-specific percent-susceptible (%S) metric for a single facility. Crude prevalence of susceptibility (number susceptible per number tested, or %S) were calculated for each isolate. In addition, we accessed the 2017 antibiograms for all isolates processed by CLS and provided by CLS as part of their routine reporting (including non–nursing home data and data from outside of Georgia).
We used mixed linear models for each isolate studied to determine the facility or isolate-level characteristics (ie, antibiotic tested, age grouping of patients) that were predictive of testing susceptibility at the facility level. We chose mixed modeling to account for multiple observations (ie, isolates tested) submitted from the same nursing home across 2 years because these isolates tend to be more similar to each other than those observed in different nursing homes. Such modeling allows for nonindependence of every observation and adjustment for the correlation among the observations within the same nursing home. This approach avoids underestimating overall variance and production of P values smaller than is appropriate. Each antibiotic test result and age of the patient was considered for inclusion in the isolate-specific models, and each facility characteristic was considered in the model as an interaction term with each of the antibiotics. If interaction terms were significant, each of the main effects (characteristics) included in the interaction term (eg, antibiotic and average length of stay) were retained in the model. Our analysis was performed using SAS software, specifically using the mixed procedure (SAS Institute, Cary, NC).
These models were then used to produce estimates of the %S for each antibiotic–pathogen combination studied and were displayed next to the crude %S to illustrate the expected %S for any given nursing home in Georgia, adjusting for differences in facility characteristics. In addition, to illustrate the magnitude of the difference in %S based on facility characteristic, the models were used to produce the mean difference in %S between each group of facilities when the category defining these groups was retained in the model. The mean difference in estimated %S was determined only for categories of facilities when the facility characteristic was retained in the model.
The Emory Human Subjects Research Board reviewed the protocol and deemed this human subjects research to be exempt from further approval. This project met the criteria for exemption under 45 CFR 46.101(b)(4).
Results
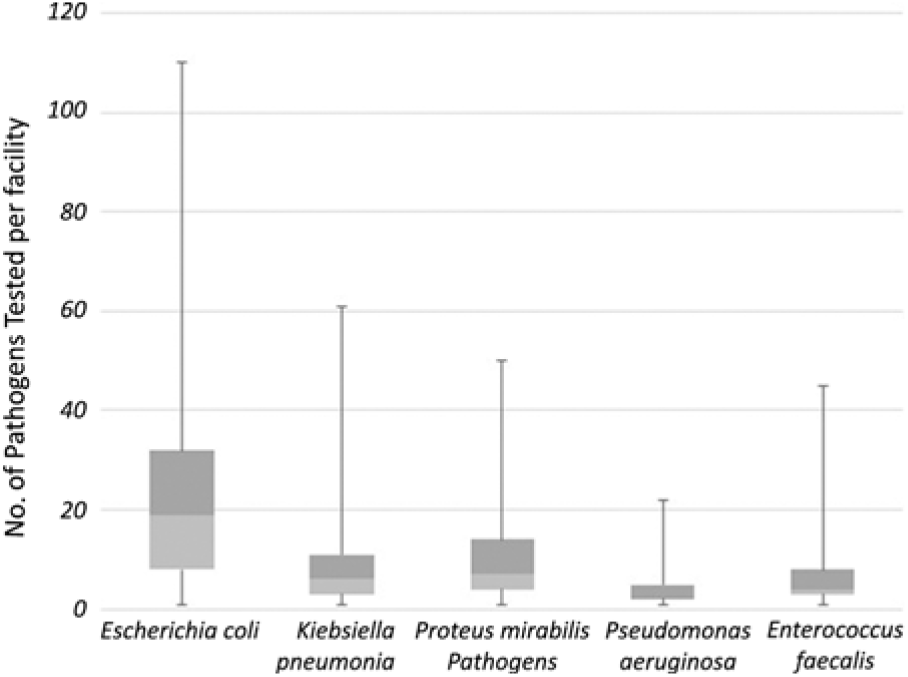
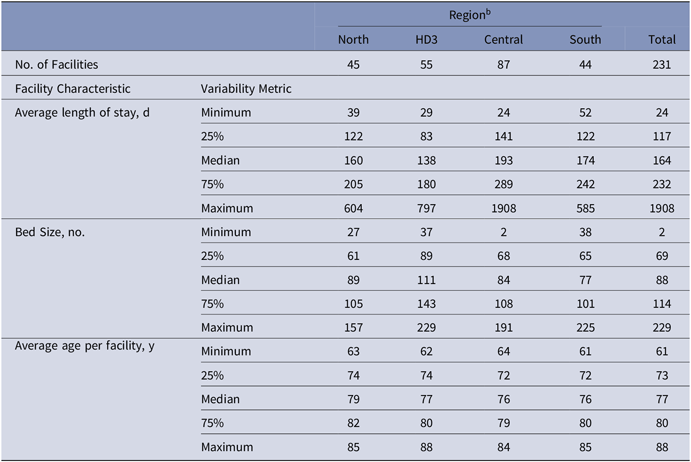
The 231 nursing homes included in this study were evenly divided among the 4 health district regions without major differences in facility characteristics by region; the average resident’s age was a median of 77 (range of medians, 76–78 among regions), the average length of stay was a median of 164 days (range of medians, 138–192 among regions), and nursing homes reported a median of 88 beds (range of medians, 84–111 among regions) (Table 1). The analytic dataset for 2016–2017 contained susceptibility test results for 10,599 E. coli, 4,230 P. mirabilis, 3,518 K. pneumoniae, 2,722 E. faecalis, and 1,191 P. aeruginosa. The number of isolates with test results reported by an individual facility varied greatly by pathogen. The distribution of isolates submitted per facility is greatly skewed toward a very low frequency of pathogens for any single facility (Fig. 2). In a single year, 220 facilities submitted specimens with at least 1 of the pathogens tested. Escherichia coli was the most frequently reported pathogen; only 107 (49%) of the facilities had 20 or more E. coli isolates available that could reasonably contribute to a facility-specific antibiogram for this pathogen. For the other pathogens, the proportion of facilities with at least 20 isolates tested was 11% for K. pneumoniae, 11% for P. mirabilis, 7% for E. faecalis, and 1% for P. aeruginosa.
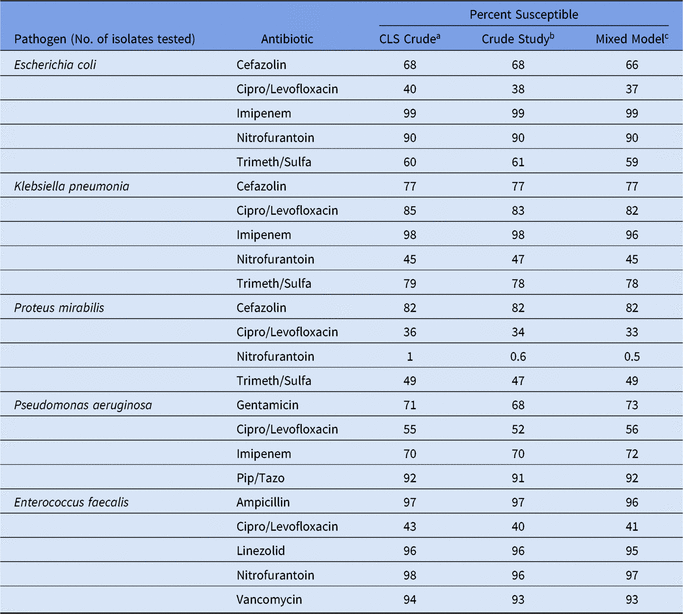
The crude %S for each antibiotic-pathogen pair studied was very similar between study facilities (n = 231), and all facilities served by CLS, which include hospice, inpatient rehabilitation, and facilities outside of Georgia. Thus, the study facilities (ie, skilled nursing facilities in Georgia) are roughly representative of all susceptibility data from all facilities served by CLS (Table 2). Overall, susceptibility among all pathogens was greatest toward nitrofurantoin, cefazolin, and trimethoprim-sulfamethoxazole (ie, a reasonable first line agent for empiric use pending patient-specific test results); pathogen susceptibility was poorest toward fluroquinolones (Table 2).
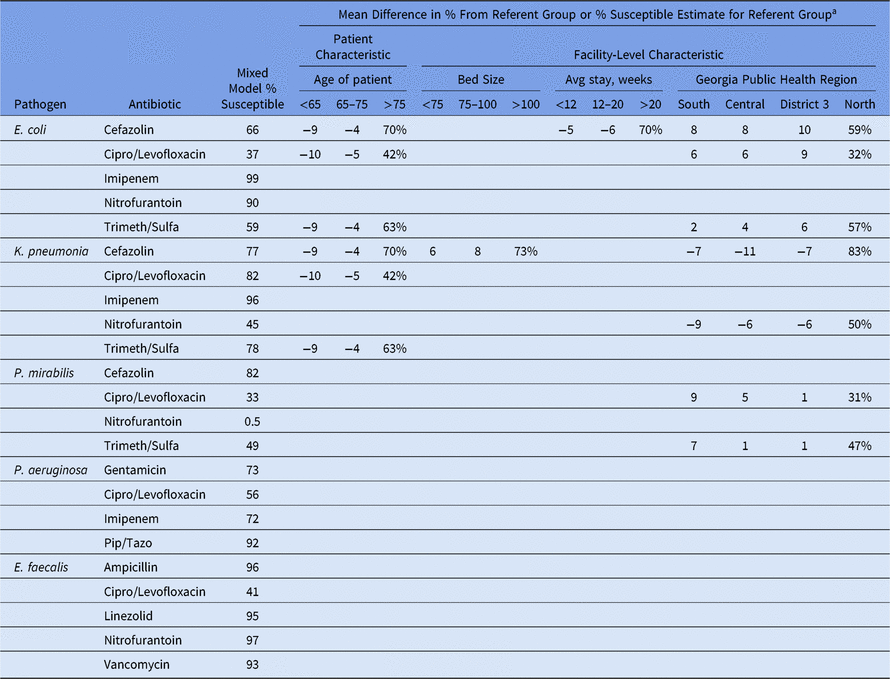
In the mixed models, in addition to the antibiotic tested being critical to predicting susceptibility, patient age was a significant predictor for 6 of the 26 possible antibiotic–pathogen combinations; an estimated %S for patients <65 years old was consistently 8%–10% lower (ie, more likely resistant) than for residents >75 years old with those 9 combinations where the interaction terms remained significant (Table 3).
After accounting for antibiotic tested and age of the patient, the facility characteristics that were significant predictors of susceptibility were as follows: E. coli, region, year, average length of stay; K. pneumoniae, region, bed size; P. mirabilis, region; E. faecalis and P. aeruginosa, no facility parameter remained in the model (see Online Supplemental Table 1 online). No facility characteristic was consistently a predictor of susceptibility between pathogen-specific models, except perhaps geographic location (ie, region). Region remained a significant interaction term for predicting susceptibility of an isolate in 7 of the 23 antibiotic–pathogen combinations (Table 3). The direction of the estimated mean differences differed by pathogen; E. coli and P. mirabilis tended to be less susceptible in the northern region, whereas K. pneumonia tended to be more susceptible in the northern region. The magnitude of the effect of region on the estimated %S for a given nursing home was determined using a forest plot of the mean differences in %S (and 95% confidence intervals) among facilities in each pair of regions when regional differences were statistically significant in our models. Estimates for facilities in the northern region tended to have the largest mean difference in the estimated prevalence, although most often this mean difference remained <10% (Fig. 3).
Box-plot distribution of annual number of pathogens tested per facility among 220 skilled nursing facilities submitting specimens, 2017.

Mean difference (and 95% confidence interval) in percent susceptible for different antibiotic-pathogen pairs, between 231 nursing homes in different regions of Georgia, 2016–2017.

Variation in Values for Facility Characteristics of Nursing Homes by Region, Using 2016 Data Reported by Center for Medicare and Medicaid Services Nursing Home Comparea

Note. HD3, Health District 3.
a Nursing Home Compare: https://www.medicare.gov/nursinghomecompare/search.html.
b Based on Georgia Department of Public Health regional classifications: https://dph.georgia.gov/public-health-districts.
Percent of Isolates Testing Susceptible, by Type of Analysis and Antibiotic–Pathogen Combination, Among 231 Nursing Homes in Georgia, 2016–2017

Note: CLS, Clinical Laboratory Services; CEF, cephalosporin; Cipro/Levo, for crude includes only levofloxacin, for model includes susceptible to both levofloxacin or ciprofloxacin; Trimeth/Sulfa, trimethoprim/sulfamethoxazole; Pip/Tazo, piperacillin-tazobactam.
a Clinical Laboratory Services, crude values refer to test results from pathogens recovered from all urine specimens submitted by all 410 clients regardless of eligibility for the study.
b Study facilities refers to isolates obtained from specimens submitted by 231 nursing homes eligible to be in the study.
c Mixed model adjustment: E. coli age, year, region, length of stay; K. pneumoniae, region, bed size, age; P. mirabilis, region; P. aeruginosa, unadjusted; E. faecalis, age.
Mean Difference in Estimated Percent Susceptible for Categories of Facilities When the Facility Characteristic Was Retained in the Model, Compared to the Baseline Estimates for Percent Susceptibility, for Select Urinary Pathogens, 231 Skilled Nursing Facilities in Georgia, 2016–2017

a Grey cells indicate indicator variable was not a significant interaction term with the antibiotic-pathogen combination.
Discussion
In this study, we evaluated cumulative susceptibility testing data from a large number of nursing homes across the state of Georgia utilizing statistical methods to account for variations in the number of isolates linked to each of the nursing homes. For any single nursing home in Georgia, the estimated %S (ie, the mixed model percent susceptible estimate) may be a valid and precise summary statistic to use in their antibiotic stewardship program. However, these estimates are of only minor (if any) clinical significance compared to the crude susceptibility metrics, the latter being much simpler to obtain on an annual basis. Moreover, the differences between crude and estimated values are of such minor clinical significance that crude aggregation may be a reasonable approach when a facility has insufficient facility-specific data to determine precise susceptibility estimates.
Our modeling efforts identified geographic region as the only facility-level characteristic repeatedly associated with an isolate testing antibiotic resistant. Although regional differences were not universally statistically significant, our results suggest some statistical justification for regional antibiograms, perhaps due to a referral pattern effect because geography is a proxy for referral patterns. Regardless, geography-based antibiograms may be a practical approach to overcoming the challenge of individual nursing homes having insufficient data to produce an annual antibiogram for antibiotic stewardship programs.Reference Furuno, Comer and Johnson11, Reference Moehring, Hazen, Hawkins, Drew, Sexton and Anderson12, 15, Reference Nicolle16 Notably, the magnitude of the differences in the estimated %S for facilities in each region was relatively small, most often <10%. Considering that regional differences were significant in only a small minority of antibiotic-pathogen pairs studied (7 of 23), the justification for producing antibiograms at the regional level in Georgia may be more practical than statistical.
Current professional practice suggests that stewardship programs should not rely on anecdotal susceptibility data (ie, testing data from a single facility at which antibiograms cannot be created with enough precision due to insufficient quantity of isolates).Reference Hindler and Stelling10 Our research suggests that at least for some pathogens, regional aggregation of data is a valid way to estimate the probability that a urine isolate will test susceptible, more so than aggregating data by age, size of facility, or average length of stay. However, aggregating data across facilities is not necessarily better than utilizing a facilities’ own patient data if enough data are available to make a precise estimate of the historical proportion of isolates testing susceptible (ie, 30 isolates).
One very clear finding of this study is the contrast between the existing CLSI guidance regarding aggregating test data to produce antibiograms, originally created to inform hospital-based antibiograms,Reference Hindler and Stelling10 and the reality of how infrequent clinical specimens are sent from any single nursing home. The CLSI guidance directs facilities to only create a point estimates for susceptibility only when 30 or more isolates are available in a year, or combine years to reach 30 isolates. Even using a lower threshold of 20 isolates translated to fewer than 1 in 10 facilities that could produce a summary statistic for any pathogen other than E. coli in a given year. Even combining data over 2–3 years would not allow for sufficient isolates for most nursing homes, and combining data for >5 years would begin to negate the ability to account for changing trends in novel antibiotic resistance.Reference Var, Hadi and Khardori17 These descriptive statistics make a very strong argument that nursing homes should utilize susceptibility data from many nursing homes in their state or region to have a contemporary antibiogram for their antibiotic stewardship programs.
For most of the antibiotic-resistant pathogens studied, bed size or average length of stay were not significant predictors of susceptibility, suggesting that resistance data are similar between nursing homes regardless of the proportion of extended-stay or short-stay residents or number of beds. This finding contrasts with a previous study in which resistance data from 44 skilled nursing facilities were evaluated.Reference Furuno, Comer and Johnson11 Although these researchers found significant differences in %S estimates between larger and smaller facilities, the χ2 test used in that study to compare groups did not account for variations in the testing frequency between facilities or the nonindependent nature of the observations of isolates coming from any single facility. Other researchers have evaluated the attributes of combining resistance data regionally among 20 small community hospitals in the Southeast and have found minimal differences in the %S metrics among facilities, concluding (as we have) that combining data across facilities in a region is prudent.Reference Moehring, Hazen, Hawkins, Drew, Sexton and Anderson12 The simplicity of using geographic location as the main demarcation to generate a combined antibiogram can allow referral laboratories or state-based healthcare-associated infection antibiotic resistance prevention programs to produce simple regional nursing home antibiograms to inform nursing home antibiotic stewardship programs.Reference Nicolle16–Reference Delisle, Quach and Domingo19
This study has several limitations. First, our study was not intended to provide individual providers with prescribing recommendations. Rather, we intended to inform nursing home antibiotic stewardship programs and health departments that, in the absence of any data or when nursing-home specific antibiogram data are insufficient, there is statistical justification for programs to make informed decisions regarding empiric antibiotic prescribing policy using data aggregated across facilities. Any single clinician should substitute clinical judgement for therapy decisions but, ideally, in the context of their facilities stewardship program guidance and policies. Second, we limited our analysis to only 5 pathogens routinely cultured from urine specimens; the conclusions of our analysis may not be representative of unstudied pathogens (eg, K. oxytoca). However, we chose the most frequently isolated pathogens from nursing home residents’ urine specimens, making these data the most relevant for managing urinary tract infections in nursing home residents. Second, we did not include specimens from other clinical sources, such as wound or respiratory specimens; however, we suspect that even fewer statistically significant differences would be identified for less frequently submitted specimens. Finally, our data were limited to Georgia, and our results may not be generalizable to other states.
Our data suggest that few differences exist in %S between nursing homes in large geographic areas across Georgia. Summarizing data for all nursing homes across Georgia appears to be a reasonable approach, although more regional antibiograms may prove attractive to facilities for other practical reasons (eg, attractive to local providers, insight into subtle differences in resistance estimates). Limiting the spread of emerging forms of antibiotic resistance is a public health priority, and a timely and coordinated effort among healthcare facilities and local and state health departments is needed to accomplish this goal.Reference Slayton, Toth and Lee20 State-based programs to prevent healthcare-associated infections and antibiotic resistance charged with advancing antibiotic stewardship in nursing homes should consider the value of assimilating similar regional antibiograms.21
Supplementary material
To view supplementary material for this article, please visit https://doi.org/10.1017/ice.2019.112
Author ORCIDs
Scott Fridkin, 0000-0003-4892-693X
Acknowledgments
The authors thank Monica Farley, MD, for her support of staff working on this project and Samatha Sefton for assistance with data management.
Financial support
S.K.F. received grant support from the Georgia Department of Community Health through the Civil Money Penalty (CMP) Program (grant no. 19032G).
Conflicts of interest
All authors report no conflicts of interest relevant to this article.