1. Introduction
Shock-wave–turbulence interaction (SWTI) is a major challenge in many different applications of aerospace engineering, varying from external flows around supersonic/ hypersonic vehicles to rocket nozzles and scramjet engines. The intrinsic unsteadiness of SWTI problems often imposes severe thermal and mechanical loads, which can affect strongly the structural integrity and efficiency of high-speed vehicles, thus playing a fundamental role in the aeronautical design process. The first attempts to study the mutual interaction between shock waves and laminar or turbulent boundary layers started with the experimental works by Ackeret, Feldmann & Rott (Reference Ackeret, Feldmann and Rott1947) and Liepmann (Reference Liepmann1946). In the following decades, most of the research on SWTI advanced by virtue of experimental data of both compression ramps and impinging shocks (see Dolling (Reference Dolling2001) and references therein for an extensive overview). More recently, the increase of computational power allowed us to tackle the flow physics of the compression ramp via direct numerical simulation (DNS) for reasonably low Reynolds numbers (Adams Reference Adams2000; Wu & Martín Reference Wu and Martín2007, Reference Wu and Martín2008; Wang et al. Reference Wang, Sandham, Hu and Liu2015).
The interaction between a large-scale structure, such as a shock wave, and the small-scale turbulence contained in an incoming boundary layer triggers a wide range of length and time scales characterising the physics of the problem. The capability of accurately representing the intricate dynamics of such scales is a fundamental step in the development of high-fidelity computational fluid dynamics (CFD) simulations of turbulent flows.
The effect of compressibility alone can be particularly challenging in terms of turbulence modelling. It is commonly conjectured that for incompressible flows, in statistical mean, the influence of the smallest scales on the large scales can be represented as a fully-dissipative process, justifying the widespread use of eddy-viscosity models. In practical applications to compressible turbulent flows, the use of fully-dissipative models can be controversial, specifically when the Reynolds-averaging operator adopted in Reynolds-averaged Navier–Stokes (RANS) equations is replaced by the filtering operator of large-eddy simulation (LES). The general assumption of similarity between incompressible and compressible turbulence has led to a series of generalisations of popular turbulence models for the subgrid scale (SGS) tensor (in LES) and Reynolds stresses (in RANS). Nevertheless, with the Navier–Stokes equations in their compressible form, a new set of unclosed SGS terms arises from both the RANS and LES formalisms. Some previous works addressed the importance of such terms in a priori DNS analyses (see, for instance, Vreman, Geurts & Kuerten (Reference Vreman, Geurts and Kuerten1995) and references therein); however, modelling can still be considered significantly underdeveloped for most of those unclosed terms. Furthermore, even for incompressible contributions, such as the kinetic energy SGS dissipation term, their dependency on compressibility and thermodynamics remains, at this date, in great measure unknown.
Since the very beginning of turbulence modelling, the kinetic energy dynamics has always been identified as one of the primary driving forces of turbulent flows. A comprehensive understanding of how kinetic energy is distributed along scales and how turbulent structures interact with one another is of fundamental importance to understand turbulent flow physics. In the context of LES, the phenomenon known as kinetic energy backscatter (also known as inverse energy cascade) has been studied extensively in recent decades (Piomelli et al. Reference Piomelli, Cabot, Moin and Lee1991; Domaradzki, Liu & Brachet Reference Domaradzki, Liu and Brachet1993; Kerr, Domaradzki & Barbier Reference Kerr, Domaradzki and Barbier1996; Piomelli, Yu & Adrian Reference Piomelli, Yu and Adrian1996). Based on explicitly filtered DNS data, it is in fact possible to evaluate directly the kinetic energy transfer contributions associated with the unresolved scales of the flow. The main results presented by Piomelli et al. (Reference Piomelli, Cabot, Moin and Lee1991) highlighted the predominance of a forward energy cascade as the one first conjectured by Richardson (Reference Richardson1922) and later formalised by Kolmogorov (Reference Kolmogorov1941) for three-dimensional turbulence. However, a large amount of the flow field is instead characterised by backscatter events, i.e. an inverse energy cascade, where small scales contribute as a source term for the large-scale kinetic energy. After these first results, the presence of backscatter was observed in many different applications (Cabot, Schilling & Zhou Reference Cabot, Schilling and Zhou2004; O'Brien et al. Reference O'Brien, Urzay, Ihme, Moin and Saghafian2014; Khani & Waite Reference Khani and Waite2016; Livescu & Li Reference Livescu and Li2017; Wang et al. Reference Wang, Wan, Chen and Chen2018a; Moitro, Venkataraman & Poludnenko Reference Moitro, Venkataraman and Poludnenko2019). Both a posteriori and a priori analyses of turbulent flows were soon applied to more complex conditions, such as reactive and compressible flows. In such circumstances, thermodynamics plays a much more relevant role in the total energy balance. Thus the description of total energy transfers in turbulence soon evolved from the canonical formulation involving kinetic energy only to more generalised forms, where the influence of internal energy can no longer be neglected. The interconnection between kinetic and internal energy has been studied in depth subsequently, analysing the role played by pressure-dilatation work as the predominant conversion mechanism between the two forms of energy (Livescu, Jaberi & Madnia Reference Livescu, Jaberi and Madnia2002; Aluie Reference Aluie2013; Lees & Aluie Reference Lees and Aluie2019; Zhao & Aluie Reference Zhao and Aluie2020; Zhao, Liu & Lu Reference Zhao, Liu and Lu2020).
Along these lines, shock waves represent a conventional process of energy redistribution in compressible flows. Shock waves have been shown to have a major impact on turbulence characteristics.
The first theoretical attempts to treat SWTI were formulated in the 1950s (Moore Reference Moore1953; Ribner Reference Ribner1953, Reference Ribner1954; Kerrebrock Reference Kerrebrock1956) and they were all based on the classical decomposition of disturbances introduced by Kovasznay (Reference Kovasznay1953). Only many years later, as a result of increasing computational capabilities, DNS of isotropic- turbulence–normal-shock-wave interaction was within reach for relatively weak shocks (Lee, LELE & Moin Reference Lee, Lele and Moin1991; Lee, Lele & Moin Reference Lee, Lele and Moin1993). It was observed that the interaction was characterised by an abrupt increase in turbulence anisotropy and intensity, triggering strong energy transfers in proximity of the shock wave. A long series of works followed, analysing the different aspects of SWTI, ranging from the effect of the shock strength (Lee, Lele & Moin Reference Lee, Lele and Moin1997) to the variations of the upstream turbulence (Mahesh & Lee Reference Mahesh and Lee1995; Mahesh, Lele & Moin Reference Mahesh, Lele and Moin1997; Jamme et al. Reference Jamme, Cazalbou, Torres and Chassaing2002).
In wall-bounded supersonic flows, the interaction of turbulent boundary layers with shocks and rarefaction waves is one of the most prevalent phenomena governing the overall flow structure. Research on shock- wave–turbulent-boundary-layer interaction (SWTBLI) is commonly based on two main canonical flow configurations: impinging normal/oblique shocks (Green Reference Green1970; Pirozzoli & Grasso Reference Pirozzoli and Grasso2006; Priebe, Wu & Martín Reference Priebe, Wu and Martín2009; Pirozzoli, Bernardini & Grasso Reference Pirozzoli, Bernardini and Grasso2010; Pirozzoli & Bernardini Reference Pirozzoli and Bernardini2011a), and compression/expansion ramps (Settles, Fitzpatrick & Bogdonoff Reference Settles, Fitzpatrick and Bogdonoff1979; Dolling & Murphy Reference Dolling and Murphy1983). An extensive literature has been dedicated to SWTBLI, based mainly on experiments (Settles & Dodson Reference Settles and Dodson1994; Andreopoulos, Agui & Briassulis Reference Andreopoulos, Agui and Briassulis2000; Dolling Reference Dolling2001), providing a solid background for future numerical simulation of such complex phenomena. A generic feature of such flows is that the shock wave, deflected by geometric constraints, causes a sudden a pressure drop, leading the flow to separate in recirculation bubbles. The general dynamics of the separated flow is highly dependent on the many parameters characterising the flow (Mach number, turbulence structure, wall heating, etc.). Due to the delicate physics characterising SWTBLI, the numerical discretisation of such systems requires a large number of precautions to be taken into account. The choice of the continuum equations, the numerical scheme and the modelisation of turbulence are all crucial aspects for the accurate simulation of SWTBLI problems.
For example, many of the SWTI/SWTBLI computations considered small enough Mach numbers to numerically resolve the inner structure of the viscous shock wave. However, for sufficiently strong shocks, like the ones encountered frequently in complex engineering applications, an accurate resolution of the shock profile is often computationally impossible, and an additional regularisation mechanism is needed. The canonical approaches to address such matters in turbulent flows are usually categorised in essentially non-oscillatory (ENO), weighted ENO (WENO) or targeted ENO (TENO) schemes (Qiu & Shu Reference Qiu and Shu2004, Reference Qiu and Shu2005a,Reference Qiu and Shub), shock-fitting techniques (Salas Reference Salas1976; Rawat & Zhong Reference Rawat and Zhong2010; Zahr, Shi & Persson Reference Zahr, Shi and Persson2019; Zahr & Persson Reference Zahr and Persson2020) and artificial viscosities (Von Neumann & Richtmyer Reference Von Neumann and Richtmyer1950; Cook & Cabot Reference Cook and Cabot2004; Persson & Peraire Reference Persson and Peraire2006; Fernandez, Nguyen & Peraire Reference Fernandez, Nguyen and Peraire2018b; Tonicello, Lodato & Vervisch Reference Tonicello, Lodato and Vervisch2020). Each of these needs to be properly designed to regularise shock waves, preserving, at the same time, the delicate properties of turbulence. Each shock-capturing technique is characterised by two main steps: identification and regularisation. In particular, in turbulent flows, the detection of shock waves can be particularly challenging due to the presence of highly unsteady and rapidly varying turbulent structures. An inaccurate identification of flow discontinuities can then easily lead to a significant degradation of small-scale fluctuations (Johnsen et al. Reference Johnsen, Larsson, Bhagatwala, Cabot, Moin, Olson, Rawat, Shankar, Sjögreen and Yee2010; Kawai, Shankar & Lele Reference Kawai, Shankar and Lele2010).
The present work addresses the aforementioned fundamental features of compressible turbulence in a unified setting. The compression/expansion ramp herein considered is, in fact, a particularly interesting set-up characterised by complex compressible turbulence dynamics in a self-contained configuration. A wide range of different turbulent structures, thermodynamic states and compressibility effects can be observed within the same flow field. The level of information embedded in the present DNS database can be particularly insightful for the design of innovative turbulence models of compressible flows within the framework of high-order spectral element methods.
The paper will be organised as follows. In the first part, a thorough validation of the specific test case will be presented; next, the filtered Navier–Stokes equations will be introduced to study the large- scale kinetic energy equation. Based on such equations, averaging and explicit filtering will be applied to the highly resolved DNS data to analyse relevant unclosed quantities, with particular attention to the SGS kinetic energy dissipation term. Its dependency on local levels of compressibility finally will be studied and discussed.
2. Compression/expansion ramp simulation
The canonical compression ramp set-up features all the ingredients of SWTBLI. The arising flow field can be particularly complex, containing many challenging physical phenomena, including shock waves, turbulence, flow separation and unsteady heat transfer. All of these factors have been studied extensively in the literature as each of them requires specific numerical treatments, particularly if they interact strongly with each other. For example, standard shock-capturing techniques need to be tailored carefully whenever applied to compressible turbulent flows, in order to avoid excessive artificial dissipation (Johnsen et al. Reference Johnsen, Larsson, Bhagatwala, Cabot, Moin, Olson, Rawat, Shankar, Sjögreen and Yee2010; Kawai et al. Reference Kawai, Shankar and Lele2010). In a similar way, low-dissipative numerical schemes are often essential to reduce detrimental effects as much as possible by numerical dissipation.
The test case herein considered has been studied extensively in many works, both experimental (Bookey et al. Reference Bookey, Wyckham, Smits and Martín2005; Ringuette et al. Reference Ringuette, Bookey, Wyckham and Smits2009) and numerical (Wu & Martín Reference Wu and Martín2007; Priebe & Martín Reference Priebe and Martín2012; Li et al. Reference Li, Grube, Priebe and Martín2013a,Reference Li, Grube, Priebe and Martínb; Helm & Martín Reference Helm and Martín2016), with particular attention to the unsteady nature of the main shock wave front. The majority of the aforementioned numerical simulations rely on different forms of WENO schemes to handle shock waves (Jiang & Shu Reference Jiang and Shu1996) and recycling/rescaling techniques to reproduce the incoming turbulent boundary layer (Xu & Martín Reference Xu and Martín2004). Another relevant simulation of the same configuration, which will be used as an additional reference, has been presented by Li et al. (Reference Li, Fu, Ma and Liang2010). Starting from this, a series of related studies was proposed in the following years, including a large number of investigations, such as wall temperature/turning angle influence, Reynolds stress anisotropy maps and turbulent kinetic energy balance (Tong et al. Reference Tong, Tang, Yu, Zhu and Li2017a,Reference Tong, Yu, Tang and Lib; Zhu et al. Reference Zhu, Yu, Tong and Li2017). Most of these works are characterised by the same parameters and techniques used by Martín, except for the turbulent boundary layer inlet condition. In the simulation by Li et al. (Reference Li, Fu, Ma and Liang2010), the transition to turbulence has been simulated without any artificial turbulence injection or recycling/rescaling technique. Instead, a blow-and-suction disturbance has been used to trigger the transition sufficiently far away from the compression corner.
To the authors’ knowledge, the interaction between a fully-developed turbulent boundary layer and an oblique shock wave generated by a compression ramp has never been simulated using the high-order spectral element method (Kopriva & Kolias Reference Kopriva and Kolias1996; Sun, Wang & Liu Reference Sun, Wang and Liu2007; Jameson Reference Jameson2010). More details on the spatial discretisation scheme have been reported in Appendix A.
2.1. Simulation setup
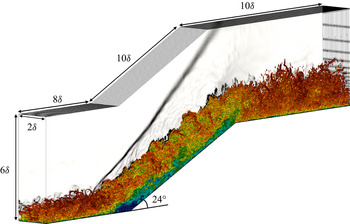
In all the previously cited works, different resolution levels and a large variety of analyses have been performed on the same configuration, providing an extensive framework for validation. The canonical problem consists of a supersonic, fully-turbulent, boundary layer interacting with a  $24^{\circ }$ compression/expansion ramp. The computational domain (see figure 1) has been parametrised using the
 $99$ % thickness of the incoming boundary layer (here denoted as
 $\delta$). The classical geometry of the present configuration is commonly limited to the compression ramp only. The subsequent expansion corner has been added to study the effect of strong expansions on the turbulence.
Q-criterion contours coloured by velocity magnitude ( $Q=1.0 u_{\infty }^{2}/\delta ^{2}$). In the background, numerical Schlieren is displayed to highlight the primary shock wave. Here,
 $\delta$ denotes incoming boundary layer thickness.

As geometrical reference, the origin is located at the corner of the compression ramp and the  $x$-coordinates are measured starting from this point following wall-tangent directions. In agreement with the DNS by Priebe & Martín (Reference Priebe and Martín2012), the reference supersonic boundary layer has been evaluated at
 $x=-8\delta$. Upstream of this location, the generation of the turbulent boundary layer itself takes place. In the work by Priebe & Martín (Reference Priebe and Martín2012), a secondary simulation based on recycling/rescaling has been used in order to prescribe a realistic inlet condition at
 $x=-8\delta$. In the present simulation, instead, an extended domain has been considered, in which the digital filter technique for turbulence generation by Klein, Sadiki & Janicka (Reference Klein, Sadiki and Janicka2003) has been applied at
 $x=-20\delta$. A weakly Riemann-based, non-reflective, far-field boundary condition has been enforced on the upper boundary. Periodic boundary conditions have been prescribed in the spanwise direction. Notice that the spanwise extent of the domain has been chosen to match previous similar studies (Wu & Martín Reference Wu and Martín2007; Li et al. Reference Li, Fu, Ma and Liang2010; Priebe & Martín Reference Priebe and Martín2012; Tong et al. Reference Tong, Tang, Yu, Zhu and Li2017a,Reference Tong, Yu, Tang and Lib).
The main flow properties of the boundary layer are listed in table 1.
Characteristic of the incoming boundary layer.

The Reynolds number is defined as  ${Re}_{\theta }=u_{\infty }\theta /\nu _{\infty }$, where
 $\theta$ represents the momentum thickness,
 $u_{\infty }$ the free stream velocity and
 $\nu _{\infty }$ the kinematic viscosity in the free stream flow. The Kármán number is defined as
 $\delta ^{+}=\delta u_{\tau }/\nu _{w}$, where
 $u_{\tau }$ denotes the friction velocity and
 $\nu _{w}$ the kinematic viscosity at the wall. Finally,
 $\delta ^{*}$ indicates the displacement thickness and
 $H=\delta ^{*}/\theta$ the shape factor. The kinematic viscosity, defined as
 $\nu =\mu (T)/\rho$, varies over the domain due to the direct dependence on density and implicit dependence on the temperature through the dynamic viscosity, here modelled using Sutherland's law:
 \begin{equation} \mu=\mu_{{ref}}\left(\frac{T}{T_{{ref}}}\right)^{3/2} \frac{(T_{{ref}}+\mathcal{S})}{(T+\mathcal{S})}, \end{equation}
with  $\mu _{{ref}}=1.834 \times 10^{-5}\ {\rm kg\ \ m}^{-1}\ {\rm s}^{-1}$,
 $T_{{ref}}=291.15\ {\rm K}$ and
 $\mathcal {S}=120\ {\rm K}$. No-slip isothermal conditions have been applied to the wall faces. Finally, the temperature at the wall has been enforced as
 $T_{w}=307\ {\rm K}$, corresponding to approximately
 $1.14$ the recovery temperature. The free stream density has been set to the nominal value
 $\rho _{\infty }=7.7 \times 10^{-2} \ {\rm kg\ \ m}^{-3}$.
Regarding the turbulent inlet condition, many different approaches have been proposed in the literature of SWTI to prescribe turbulent inflow generation (see Wu (Reference Wu2017) for an extensive summary). Using the Klein et al. (Reference Klein, Sadiki and Janicka2003) digital filter technique, generalised and validated to the present numerical set-up (Pinto & Lodato Reference Pinto and Lodato2019; Lodato, Tonicello & Pinto Reference Lodato, Tonicello and Pinto2021), the mean profiles, to which perturbations are superposed, have been evaluated using closed-form relations involving van Driest transformed velocity as described by Touber (Reference Touber2010). Given the correlation tensor of the fluid velocity and typical length scales of the desired turbulence field, realistic velocity fluctuations are prescribed at the inlet boundaries, far enough from the flow zone of interest. The values of the correlation tensor have been extrapolated from a turbulent boundary layer DNS performed by Pirozzoli & Bernardini (Reference Pirozzoli and Bernardini2011b) at a similar Reynolds number. Finally, density and temperature fluctuations have been imposed using the strong Reynolds analogy (SRA).
Details regarding the 6th-order accurate numerical discretisation are listed in table 2. The number of total degrees of freedom (DoF) has been chosen in order to match the accuracy of the DNS by Priebe & Martín (Reference Priebe and Martín2012). As is common practice for high-order spectral element schemes, the grid spacings in table 2 have been evaluated using the length of the elements along each direction divided by the order of approximation (denoted as  $N$). Wall resolution is enforced by locating the first solution point at
 $y^{+}\approx 0.3$ and the entire first element within the viscous sublayer (
 $y^{+} < 10$). The mesh spacing along the streamwise direction varies between
 ${\rm \Delta} x^{+}=4.75$ and
 ${\rm \Delta} x^{+}=15$, whereas the spanwise mesh spacing is
 ${\rm \Delta} z^{+}=4.2$. Such choices are particularly common in the numerical simulation of low- Reynolds-number turbulent boundary layers. To further validate the resolution of the present computation, the Kolmogorov length scale has been estimated a posteriori as
 $\eta = (\nu ^{3}/\varepsilon )^{1/4}$, with
 $\varepsilon = 2\langle {\nu S_{ij}^{d} ({\partial u_{i}}/{\partial u_{j}})}\rangle$. The ratio between the effective grid spacing
 $\varDelta = ({\rm \Delta} x \times {\rm \Delta} y \times {\rm \Delta} z)^{1/3}$ and the Kolmogorov length scale
 $\eta$ was found to be approximatively equal to unity upstream of the shock, and never larger than
 $6$ downstream of the interaction region. As shown by Pirozzoli, Bernardini & Grasso (Reference Pirozzoli, Bernardini and Grasso2008), the small-scale eddies in wall-bounded turbulence are characterised by a typical length scale of 5–6 times
 $\eta$. It is worthwhile mentioning that the use of the resolved flow to evaluate its own characteristic scales gives only an estimation of the order of magnitude of the Kolmogorov length scale. It is also commonly known that the primary limiting factor of wall-bounded turbulent flows is driven mainly by the accurate prediction of the viscous sublayer (see, for instance, Sayadi, Hamman & Moin Reference Sayadi, Hamman and Moin2013), which is properly resolved by the present computation. Consequently, based on such considerations, the prescribed resolution is expected to be sufficiently accurate to properly resolve all the relevant scales of the turbulent structures for the present configuration.
Numerical discretisation details, where  $N$ denotes order of approximation,
 $N_{x}, N_{y}, N_{z}$ denote the numbers of elements along the streamwise, wall-normal and spanwise directions, respectively, and
 ${\rm \Delta} x^{+}, {\rm \Delta} y^{+}, {\rm \Delta} z^{+}$ denote the wall-normalised grid spacings.

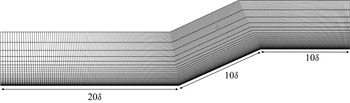
The computational domain (figure 2) has been enlarged with respect to most of the previously cited works based on recycling/rescaling techniques. Indeed, the inlet forcing method for turbulence injection necessitates a certain length to develop the desired boundary layer statistical properties, which can vary considerably depending on the specific turbulence injection techniques. The recovery distance can vary from approximately  $2/3 \delta$ (Adler et al. Reference Adler, Gonzalez, Stack and Gaitonde2018) up to
 $15 \delta$ (Morgan et al. Reference Morgan, Larsson, Kawai and Lele2011, Reference Morgan, Duraisamy, Nguyen, Kawai and Lele2013). In the present work, the reference fully-developed boundary layer is evaluated at
 $x=-8\delta$, which is located
 $12 \delta$ downstream from the inlet boundary. As will be discussed more thoroughly in the following sections of the paper, such a distance has been shown to be sufficiently long to provide good first- and second-order statistics of the turbulent velocity field. Finally, relevant statistics have been gathered every
 $0.025 \delta /u_{\infty }$ s for approximatively
 $1000 \delta /u_{\infty }$ s, which is commonly considered enough time to obtain a reliable temporal convergence for the present configuration (Wu & Martín Reference Wu and Martín2007; Li et al. Reference Li, Fu, Ma and Liang2010; Priebe & Martín Reference Priebe and Martín2012).
Compression/expansion ramp: computational grid. Here,  $\delta$ denotes incoming boundary layer thickness.

2.2. Shock capturing
The compressible Navier–Stokes equations are solved using the spectral difference method for unstructured spatial discretisation (Kopriva & Kolias Reference Kopriva and Kolias1996; Sun et al. Reference Sun, Wang and Liu2007; Jameson Reference Jameson2010; Jameson, Vincent & Castonguay Reference Jameson, Vincent and Castonguay2012). Letting  $\rho$ be the density,
 $u_i$ the velocity components, and
 $E$ the specific total energy (internal plus kinetic), these read
 $$\begin{gather} \frac{\partial{\rho}}{\partial{t}} +\frac{\partial{}}{\partial{x_{j}}}(\rho u_{j}) = 0, \end{gather}$$
 $$\begin{gather}\frac{\partial{}}{\partial{t}}(\rho u_{i}) +\frac{\partial{}}{\partial{x_{j}}}(\rho u_{i} u_{j} +p \delta_{ij}) = \frac{\partial{}}{\partial{x_{j}}}(\sigma_{ij}), \end{gather}$$
 $$\begin{gather}\frac{\partial{}}{\partial{t}}(\rho E) +\frac{\partial{}}{\partial{x_{j}}}[(\rho E + p) u_{j}] = \frac{\partial{}}{\partial{x_{j}}}(\sigma_{ij} u_{i})-\frac{\partial{q_{j}}}{\partial{x_{j}}}, \end{gather}$$
where  $\delta _{ij}$ is the Kronecker delta,
 $\sigma _{ij}$ is the viscous stress tensor, and
 $q_j$ is the heat flux vector. This last is computed via the Fourier law as
 $q_j = -\kappa \,\partial T / \partial x_j$, where
 $\kappa$ is thermal conductivity and
 $T$ is temperature. The above equations are closed using the ideal gas state equation
 \begin{equation} p = \rho R T,\quad\rho E = \frac{p}{\gamma-1} + \frac{1}{2}\rho u_k u_k, \end{equation}
where  $R$ is the gas constant and
 $\gamma = c_p/c_v$ is the specific heat ratio.
Shock waves will often represent an under-resolved feature of the flow field, and artificial terms are necessary for their numerical description. Consequently, the term ‘direct numerical simulation’ is here strictly restricted to the scales of turbulence and not to the whole spectrum of scales characterising the physics of the problem. See the works by Margolin (Margolin Reference Margolin2019; Margolin & Plesko Reference Margolin and Plesko2019) for a deeper discussion on artificial viscosity and SGS modelling.
In this work, the shock-capturing technique is based on the subcell shock- capturing method with modal sensors first proposed by Persson & Peraire (Reference Persson and Peraire2006) within a discontinuous Galerkin framework. The spectral behaviour of the resolved variables is evaluated along each direction in order to detect discontinuities in the flow field. The characteristic-based sensor proposed recently by Lodato (Reference Lodato2019a,Reference Lodatob) has been used. Once shock waves are located efficiently, they can be regularised properly using an artificial viscosity (AV) approach based on the bulk viscosity, similar to the one developed by Fernandez et al. (Reference Fernandez, Nguyen and Peraire2018b) and Fernandez, Nguyen & Peraire (Reference Fernandez, Nguyen and Peraire2018a). The artificial terms, added to the compressible Navier–Stokes equations, are based on an augmentation of physical fluid viscosities and diffusivities. Accordingly, considering a Newtonian fluid under Stokes’ hypothesis, the viscous stress tensor and the heat flux become
 \begin{equation} \sigma_{ij} = 2\mu S^{d}_{ij} + \beta_{{AV}}\,\frac{\partial{u_{k}}}{\partial{x_{k}}}\,\delta_{ij}, \end{equation}
where  $S_{ij}^{d}$ indicates the deviatoric part of the strain-rate tensor
 \begin{equation} S_{ij}^{d}= \frac{1}{2}\left (\frac{\partial{u_{i}}}{\partial{x_{j}}}+\frac{\partial{u_{j}}}{\partial{x_{i}}}\right )-\frac{1}{3}\,\frac{\partial{u_{k}}}{\partial{x_{k}}}\,\delta_{ij}, \end{equation}
and
 \begin{equation} q_{j}={-}(\kappa+\kappa_{{AV}})\frac{\partial{T}}{\partial{x_{j}}}, \quad \kappa_{{AV}}=\frac{\beta_{{AV}}c_{p}}{Pr_{\beta}}, \end{equation}
where  $Pr_{\beta }$ is expressed dynamically as a function of the local Mach number according to the equation
 \begin{equation} Pr_{\beta}=Pr \{ 1+\exp[{-}4(Ma(\boldsymbol{x})-Ma_{{thr}})]\}. \end{equation}
The parameter  $Ma_{{thr}}$ has been set to
 $3$, to avoid the addition of unnecessary thermal dissipation for low-Mach-number regions of the flow. This approach has been reported recently as a good compromise to capture the expected entropy overshot within the shock zone (Tonicello et al. Reference Tonicello, Lodato and Vervisch2020).
It was found necessary to improve this artificial viscosity model in the case of wall-bounded turbulent flows. While eddy-viscosity, by definition, vanishes at wall boundaries, as dictated by the turbulent boundary layer theory, the artificial viscosity has no constraint from this point of view. However, it is common practice to turn off the artificial viscosity at wall faces (Kawai et al. Reference Kawai, Shankar and Lele2010). Accordingly, to avoid the unnecessary activation of the artificial viscosity close to the wall, a modification of the sensor proposed by Ducros et al. (Reference Ducros, Ferrand, Nicoud, Weber, Darracq, Gacherieu and Poinsot1999) has been coupled with the baseline modal shock detection procedure. The elementwise constant shock sensor by Persson & Peraire (Reference Persson and Peraire2006) ( $s_{{modal}}$) has been modified as follows:
 \begin{equation} s_{e}=s_{{modal}} \times \frac{[0.5(\lvert\langle{\partial{u_{k}}/\partial{x_{k}}}\rangle\rvert -\langle{\partial{u_{k}}/\partial{x_{k}}}\rangle)] ^{2}}{\langle{\partial{u_{k}}/\partial{x_{k}}}\rangle^{2}+ \langle{\sqrt{\omega_{k} \omega_{k}}}\rangle^{2}+\epsilon}, \end{equation}
where  $\langle {\cdot }\rangle$ denotes elementwise averaging,
 $\omega _{i}=\varepsilon _{ijk}(\partial u_{k}/\partial x_{j})$ indicates the
 $i$th component of the vorticity vector, and
 $\epsilon$ is a constant of order machine epsilon squared. (To define the vorticity vector, the Levi–Civita symbol has been introduced, denoted as
 $\varepsilon _{ijk}$.) The present modification has been tested already in the same numerical framework for the simulation of transonic aerofoils (Tonicello, Lodato & Vervisch Reference Tonicello, Lodato and Vervisch2022). The proposed correction also prevents the activation of the artificial viscosity in strongly vortical regions characterised by negligible volumetric compressions. It is, in fact, well-known that excessively large values of bulk viscosity can deteriorate considerably the dilatation field in highly compressible regions (Kawai et al. Reference Kawai, Shankar and Lele2010; Tonicello et al. Reference Tonicello, Lodato and Vervisch2020).
In addition to the shock-capturing numerical approach, a positivity-preserving scheme developed by Zhang & Shu (Reference Zhang and Shu2010), adapted to the spectral difference scheme (Lodato, Vervisch & Clavin Reference Lodato, Vervisch and Clavin2016, Reference Lodato, Vervisch and Clavin2017; Lodato Reference Lodato2019a), has been employed to fully secure the stability of the simulation. The impact on the flow physics of both the shock-capturing and the positivity-preserving schemes are discussed thereafter. More detailed presentations of the shock-capturing technique and the positivity-preserving scheme have been included in Appendices B and C, respectively.
3. Simulation validation and physical analysis
In this section, a detailed validation of the the main flow features is presented. Once the reliability of the simulation is established, further analyses on the resolved flow field are discussed in subsequent sections.
3.1. Wall coefficients and mean profiles
In order to validate the proposed DNS, the averaged friction coefficient and wall pressure have been computed and compared with previous simulations and experimental data of the same configuration in figure 3. In many other works, a perfect agreement within the rich literature of compression ramp simulations has proven to be a very difficult task to achieve. This is commonly true not only in the detached region of the flow, which can be very challenging to be accurately predicted, but also in the upstream region where large deviations of the skin friction coefficient are normally reported in the literature. To highlight such a tendency, the DNS by Zhu et al. (Reference Zhu, Yu, Tong and Li2017) along with experimental data by Ringuette et al. (Reference Ringuette, Bookey, Wyckham and Smits2009) have been added to figure 3. The simulation by Zhu et al. (Reference Zhu, Yu, Tong and Li2017) was performed under the same conditions as the experiments by Ringuette et al. (Reference Ringuette, Bookey, Wyckham and Smits2009) and DNS by Wu & Martín (Reference Wu and Martín2007), which were characterised by a slightly smaller Reynolds number with respect to the present computation (namely,  ${Re}_{\theta } =2400$). Another relevant difference can be identified in the upstream boundary layer: the DNS performed by Zhu et al. (Reference Zhu, Yu, Tong and Li2017) did not rely on any artificial injection of turbulence. In fact, the full laminar-to-turbulent transition of the incoming boundary layer was explicitly simulated using a blow-and-suction disturbance technique.
Averaged (a) friction coefficient and (b) wall pressure, along the streamwise direction. Solid line, present simulation; dashed line, DNS by Zhu et al. (Reference Zhu, Yu, Tong and Li2017), dashed-dotted line, DNS by Priebe & Martín (Reference Priebe and Martín2012). Black circle, measurements by Ringuette et al. (Reference Ringuette, Bookey, Wyckham and Smits2009).

In figure 3(a), in the upstream region, the friction coefficient is slightly higher than the reference DNS by Priebe & Martín (Reference Priebe and Martín2012), whereas the simulation by Zhu et al. (Reference Zhu, Yu, Tong and Li2017) reports an even larger value. The experimental separation point is much better predicted by both Zhu et al. (Reference Zhu, Yu, Tong and Li2017) and the present simulation rather than by Priebe & Martín (Reference Priebe and Martín2012). Furthermore, both simulations tend to provide smaller values of the friction coefficient in the downstream region, in agreement with the experimental location of the reattachment point. In figure 3(b), the computed wall pressure profile follows nicely the one obtained by Zhu et al. (Reference Zhu, Yu, Tong and Li2017), which departs from the DNS by Priebe & Martín (Reference Priebe and Martín2012) within the interaction region around  $-3 < x/\delta < 0$.
In order to assess the quality of the incoming boundary layer, mean profiles along wall-normal planes at different locations have been extracted. First, in figure 4, velocity profiles have been evaluated before the interaction with the shock wave ( $x=-3 \delta$) and after (
 $x=4 \delta$). Second, in figure 5, the van Driest transformed streamwise velocity and the normalised Reynolds stresses at
 $x=-8 \delta$ are shown. In both panels of figure 5, the first
 $6$ solution points of the high-order discretisation are shown to highlight wall resolution. Notice that the first element is entirely contained in the viscous sublayer (
 $y^{+} < 10$). The van Driest transformed velocity follows accurately the experimental data in the log region, whereas some small differences with respect to the reference DNS are visible, in particular in the buffer layer.
Tangential velocity profiles along the wall-normal direction. (a)  $x=-3 \delta$. Solid line, present simulation; dashed line, DNS by Priebe & Martín (Reference Priebe and Martín2012). (b)
 $x=4 \delta$. Solid line, present simulation; dashed line, DNS by Wu & Martín (Reference Wu and Martín2007); symbols, experimental data by Ringuette et al. (Reference Ringuette, Bookey, Wyckham and Smits2009); the streamwise velocity is normalised by the outer velocity
 $u_{e}$ downstream of the main shock.

(a) Van Driest (VD) transformed streamwise velocity at  $x=-8 \delta$. Solid line, present simulation; dashed line, DNS by Wu & Martín (Reference Wu and Martín2007); symbols, experimental data by Ringuette et al. (Reference Ringuette, Bookey, Wyckham and Smits2009); dash-dotted line,
 $u_{VD}^{+} = y^{+}$ and
 $u_{VD}^{+} = 5.25 + \log (y^{+})/0.41$. (b) Normalised Reynolds stresses at
 $x=-8 \delta$. Solid line, present simulation; dashed line, DNS by Pirozzoli & Bernardini (Reference Pirozzoli and Bernardini2011b).

At  $x=-3\delta$, the profile extracted from the present simulation shows a perfect agreement with the reference DNS. Downstream of the shock-interaction region, instead, some discrepancies can be seen, where a much better agreement with the experimental data by Ringuette et al. (Reference Ringuette, Bookey, Wyckham and Smits2009) has been obtained. Similar results in the detached region have been reported only by Kokkinakis et al. (Reference Kokkinakis, Drikakis, Ritos and Spottswood2020) using a
 $9$th order WENO scheme. In the same work, different schemes were employed and compared. Compared to lower order methods, the
 $9$th order WENO scheme resulted in higher values of the skin friction in the upstream boundary layer and smaller ones in the downstream region, in agreement with the results shown in figure 3(a).
Finally, the main features of the incoming boundary layer are summarised in table 3. Most of them are in fairly good agreement with the reference values of Priebe's simulation.
Characteristics of the incoming boundary layer: reference versus computed.

3.2. Probes
The main variables have been collected over the simulated time through virtual probes located in regions characterised by different thermodynamic states and turbulence structure (see figure 6). Subsequently, temporal and spatial kinetic energy spectra have been related using Taylor's hypothesis. All the probes have been taken far enough from the wall, in order to make Taylor's hypothesis reasonably realistic. The first probe has been located in the log region of the incoming boundary layer, and the second in the detached flow downstream of the interaction with the shock wave. The kinetic energy spectra, computed using Taylor's hypothesis, are shown in figure 7(a). In addition, due to the periodic conditions along  $z$, the kinetic energy spectra in the spanwise direction have been evaluated at the same locations; they are shown in figure 7(b). To reduce numerical noise, the spatial kinetic energy spectra have been computed at multiple time steps and subsequently averaged.
Probe locations. In the background, instantaneous normalised velocity magnitude field.

Kinetic energy spectra. Dashed line,  $x=-8\delta$; solid line,
 $x=4\delta$.
 $\mathbb {E}$ denotes the kinetic energy Fourier spectrum of the velocity signal: (a) applying Taylor's hypothesis to temporal signals; (b) along
 $z$ (
 $y=0.7\delta$), where the vertical dashed line represents the Nyquist grid wavenumber. Here,
 $\kappa$ represents the wavenumber, which is evaluated along the spanwise direction as
 $\kappa _{z} = 0.5/z$ and, using Taylor's hypothesis, as
 $\kappa =2 {\rm \pi}f/\langle {\|\boldsymbol {u}\|}\rangle$, with
 $f$ the temporal frequency of the time signal. Both spectra are normalised by the first mode.

The inertial range is clearly visible in all the spectra, followed by a steeper viscous range where viscous dissipation takes place. Notice that no accumulation of kinetic energy in the proximity of the Nyquist grid wavenumber is observed. The molecular viscosity is then sufficiently large to dissipate the kinetic energy associated with the smallest grid size, indicating a fairly good resolution of the dissipative scales. It is interesting to note that the inertial range is evidently elongated after the interaction with the shock wave. This feature is in good agreement with the widely known evolution of isotropic turbulence across large-scale shock waves. The turbulence downstream of the interaction is, in fact, characterised by smaller scales (see also figure 9), pushing the dissipative range to larger wavenumbers.
In addition, in figure 8, the compensated kinetic energy spectra at the same locations have been computed to evaluate Kolmogorov's constant. In similarity to figure 7(b), notice the elongated inertial subrange due to the more energetic nature of small-scale fluctuations downstream from the interaction. Note that the classical value of Kolmogorov's constant, which is approximately equal to  $1.5$, is indicated for reference by a horizontal line. Notice that the kinetic energy spectra depicted in figure 7 present a monotonic behaviour, where the largest values are obtained at the largest wavelengths. Monotonically decreasing spectra are not uncommon in both experimental and numerical studies of turbulence (e.g. Comte-Bellot & Craya Reference Comte-Bellot and Craya1965; Spalart Reference Spalart1988; Phillips Reference Phillips1991; Eggels et al. Reference Eggels, Unger, Weiss, Westerweel, Adrian, Friedrich and Nieuwstadt1994; Matsubara & Alfredsson Reference Matsubara and Alfredsson2001; Pantano & Sarkar Reference Pantano and Sarkar2002; Wu & Moin Reference Wu and Moin2009; Laizet, Lamballais & Vassilicos Reference Laizet, Lamballais and Vassilicos2010, to cite just a few), and although kinetic energy spectra are often characterised by a first increase of energy in proximity of the integral length scale, subsequently followed by the classical inertial range (see, for example, Pirozzoli & Bernardini Reference Pirozzoli and Bernardini2011b), monotonic spectra, which are very similar to those obtained in the present study, were also reported by Wu & Martín (Reference Wu and Martín2007) for the same flow configuration. As pointed out by one of the anonymous reviewers, a possible explanation for this monotonic behaviour of the spectra might point to the integral scales being constrained artificially by the selected spanwise domain size, with a consequent build-up of energy at the lowest wavenumbers. Indeed, the spanwise extent of the domain used by Wu & Martín (Reference Wu and Martín2007) is almost identical to the one adopted in the present DNS, and it could be argued that results therein were affected by excessive artificialspanwise confinement. Yet, other similar DNS with the same imposed spanwise periodicity at about
 $2\delta$ report autocorrelation functions with a relatively fast decay at length scales that are considerably smaller than the spanwise domain size (Tong et al. Reference Tong, Tang, Yu, Zhu and Li2017a,Reference Tong, Yu, Tang and Lib). In particular, in both of these studies, spanwise autocorrelations drop to zero at a distance of about
 $0.2\delta$ before the interaction with the shock, which is, however, never larger than half the domain size in the spanwise direction even after the interaction, hence justifying the present choice for the domain width. Moreover, it is worthwhile pointing out that the same monotonic behaviour of the spectra is observed here both upstream and downstream of the shock-interaction region. Within the former region, as already observed, the autocorrelation functions by Tong et al. (Reference Tong, Tang, Yu, Zhu and Li2017a,Reference Tong, Yu, Tang and Lib) suggest the presence of integral scales much smaller than the spanwise extent of the domain, which would exclude the above-mentioned phenomenon of energy accumulation at the largest scales. Even more so, any spanwise confinement would also be excluded after the interaction with the shock, where, as expected, a reduction in the scales of turbulence is observed.
Compensated kinetic energy spectra along  $z$ (
 $y=0.7\delta$). Dashed line,
 $x=-8\delta$; solid line,
 $x=4\delta$. The horizontal solid line represents the classical value of Kolmogorov's constant, approximately equal to
 $1.5$ (Pope Reference Pope2001).

Numerical Schlieren.

Instantaneous absolute value of the normalised spanwise component of the vorticity field (wall view). Vertical white lines represent compression and expansion corners. Three periods along the spanwise direction have been plotted.

PDFs of (a) pressure, (b) density, and (c) temperature, time signals at the downstream probe location. Dash-dotted line, conditional PDF with  $Ma<1$; dashed line, conditional PDF with
 $Ma>1$; solid line, total PDF. Vertical dotted line in (a) represents the pressure mean value.

Another well-known effect of shock waves on isotropic turbulence is the strong amplification of the transverse vorticity component. As a qualitative visualisation of such behaviour, a wall view of the vorticity field is shown in figure 10. From this figure, the recovery of velocity fluctuations right after the turbulent inlet condition is also seen. Knowing the time history of the main variables, the discrete probability density function (PDF) of quantities of interest may be built in a time-averaged statistical sense. At the downstream probe location, the flow regularly oscillates between subsonic and supersonic regimes. Consequently, the PDFs have been conditioned to the local Mach number. The discrete PDFs of density and pressure are shown in figure 11. The PDF of pressure, shown in figure 11(a), is not particularly influenced by the supersonic/subsonic regime. On the other hand, in figure 11(b), a significant dependance on the sonic regime is observed for the density: whenever the Mach number exceeds a unitary value, the density PDF tends to extend to larger values, whereas in subsonic conditions, it is more symmetric with respect to the mean value. This tendency can beexplained partially by the presence of shocklets (Zeman Reference Zeman1990) in the detached flow, causing local compressions, and consequently an abrupt increase of the fluid density. The pressure field, instead, tends to recover the zero-pressure gradient characterising the incoming turbulent boundary layer, and it is not considerably influenced by the compressibility effects arising in the detached region of the flow. Consequently, the pressure field does not deviate considerably from its mean value. The behaviours of pressure and density are then compensated by a decrease in the temperature field due to the ideal gas law. Such a tendency is confirmed by the PDF of the temperature signal, which is depicted in figure 11(c). The temperature is, in fact, clearly skewed towards lower values with respect to the mean for supersonic regimes.
In these simulations, the shock-capturing artificial viscosity must be essentially inactive in the separated flow, which is characterised by strong vortical structures. This is confirmed in figure 12, where the averaged value of the artificial viscosity (AV) is shown. The model is active only in the proximity of the shock wave, whereas vanishing values are observed in the rest of the domain. Similarly, the positivity-preserving scheme has a relatively low and localised activation, as shown in figure 13. To visualise its activation levels, an elementwise constant flag has been introduced, taking a unitary value if the limiter is active and zero if it is not. Such a flag indicator is then averaged in time and along the spanwise direction following the classical paradigm for statistically steady-state and spanwise periodic flows. The maximum value assumed by the limiter flag is approximately  $1\times 10^{-4}$, meaning that the limiter is not only active in a very small region of the flow but also mostly inactive in time as well.
Snapshot of averaged artificial viscosity normalised by the molecular viscosity.

Averaged limiter activation.

4. Analysis of the balance equation for the resolved kinetic energy
The space filtered mass and momentum balance equations are obtained by applying a density-weighted spatial filtering operation  $\widetilde {(\cdot )}={\overline {\rho (\cdot )}}/{\bar {\rho }}$ to (2.2) and (2.3):
 $$\begin{gather} \frac{\partial{\bar{\rho}}}{\partial{t}} +\frac{\partial{}}{\partial{x_{j}}}(\bar{\rho} \tilde{u}_{j}) = 0, \end{gather}$$
 $$\begin{gather}\frac{\partial{}}{\partial{t}}(\bar{\rho} \tilde{u}_{i}) +\frac{\partial{}}{\partial{x_{j}}}(\bar{\rho} \tilde{u}_{i} \tilde{u}_{j}) ={-}\frac{\partial{\bar{p}}}{\partial{x_{i}}}+\frac{\partial{}}{\partial{x_{j}}}\left[2\mu(\tilde{T})\,\tilde{S}^{d}_{ij}\right]+\frac{\partial \tau_{ij}}{\partial x_j} + \frac{\partial \tau^v_{ij}}{\partial x_j}, \end{gather}$$
where  $\tilde {S}_{ij}^{d}$ is the deviatoric part of the strain-rate tensor, computed from the resolved velocity field as
 \begin{equation} \tilde{S}_{ij}^{d}= \frac{1}{2}\left(\frac{\partial{\tilde{u}_{i}}}{\partial{x_{j}}}+\frac{\partial{\tilde{u}_{j}}}{\partial{x_{i}}}\right) -\frac{1}{3}\,\frac{\partial{\tilde{u}_{k}}}{\partial{x_{k}}}\,\delta_{ij}, \end{equation}
and the terms representative of transport by unresolved fluctuations are
 $$\begin{gather} \tau_{ij} =\bar{\rho} \tilde{u}_{i} \tilde{u}_{j}-\overline{\rho u_{i}u_{j}}, \end{gather}$$
 $$\begin{gather}\tau^v_{ij} =\overline{2\mu S^{d}_{ij}}-2\mu(\tilde{T})\, \tilde{S}^{d}_{ij}. \end{gather}$$
The total kinetic energy may be written
 \begin{equation} \bar{\rho} E_k = \tfrac{1}{2}\overline{\rho u_i u_i} = \tfrac{1}{2} \bar{\rho} \tilde{u}_i\tilde{u}_i + \bar{\rho} k , \end{equation}
where  $\bar {\rho } k= (\overline {\rho u_i u_i}-\bar {\rho } \tilde {u}_i\tilde {u}_i)/2$ denotes the unresolved part of the kinetic energy.
The contribution of  $\tau _{ij}^v$ (see (4.5)) is often neglected, based on the assumption that terms involving molecular viscosity are mostly restricted to the smallest scales and then weakly affected by the averaging or filtering operations. Most common turbulence models for the unresolved Reynolds stress tensor
 $\tau _{ij}$ rely on the so-called Boussinesq hypothesis (eddy-viscosity hypothesis):
 \begin{equation} \tau_{ij} = 2\bar{\rho}\nu_{t} \tilde{S}^{d}_{ij} - \tfrac{2}{3}\bar{\rho} k\delta_{ij}, \end{equation}
where  $\nu _{t}$ is the eddy-viscosity.
The balance equation for the resolved part of the kinetic energy may be written as
 \begin{equation} \frac{\partial{(\frac{1}{2}\bar{\rho}\tilde{u}_{k}\tilde{u}_{k})}}{\partial{t}} = K_{0}+ K_{1}-K_{2}+K_{3}-K_{4},\end{equation}
with
 $$\begin{gather} K_{0} = \frac{\partial{}}{\partial{x_{j}}}\left\{ -\tfrac{1}{2}\bar{\rho}\tilde{u}_{k}\tilde{u}_{k}\tilde{u}_{j}-\bar{p}\tilde{u}_{j}+\left[ 2\mu(\tilde{T})\,\tilde{S}_{ij}^{d}+\tau_{ij} +\tau_{ij}^{v}\right] \tilde{u}_{i}\right\}, \end{gather}$$
 $$\begin{gather}K_{1} = \bar{p}\,\frac{\partial{\tilde{u}_{j}}}{\partial{x_{j}}},\quad K_{2} = 2\mu(\tilde{T})\,\tilde{S}_{ij}^{d}\,\frac{\partial{\tilde{u}_{i}}}{\partial{x_{j}}},\quad K_{3} ={-}\tau_{ij}\, \frac{\partial{\tilde{u}_{i}}}{\partial{x_{j}}},\quad K_{4} = \tau_{ij}^{v}\, \frac{\partial{\tilde{u}_{i}}}{\partial{x_{j}}}. \end{gather}$$
The first term on the right-hand side of (4.8) represents a transport term, which only redistributes kinetic energy. The last four terms, instead, act as sources and sinks of the kinetic energy of the resolved scales. The term  $K_{1}$ denotes the pressure-dilatation work, which quantifies the exchange of energy between kinetic and internal energy balances. The term
 $K_{2}$ represents the large-scale viscous dissipation. The term
 $K_{3}$ is the dissipation term of the resolved part of the kinetic energy (i.e. the so-called production term of
 $k$, the unresolved kinetic energy), and
 $K_{4}$ denotes the contribution of the unclosed viscous term due to the nonlinearity of molecular viscosity.
In a similar manner, the transport equation for the unresolved part of the kinetic energy (i.e. the last term in (4.6)) reads
 \begin{align} \frac{\partial{\bar{\rho}k}}{\partial{t}} &= \frac{\partial{}}{\partial{x_{j}}}\left [ -\bar{\rho}k\tilde{u}_{j}-\tfrac{1}{2}\bar{\rho}(\widetilde{u_{k}u_{k}u_{j}}-\widetilde{u_{k} u_{k}}\tilde{u}_{j})\right ] \nonumber\\ &\quad + \frac{\partial{}}{\partial{x_{j}}}\left [ \left(-\overline{pu_{j}}+\bar{p}\tilde{u}_{j}\right) + \left(\overline{2\mu(T)\,S_{ij}^{d}u_{i}}-\overline{2\mu(T)\,\tilde{S}_{ij}^{d}} \tilde{u}_{i} \right) - \tau_{ij}\tilde{u}_{j} \right ] \nonumber\\ &\quad + \left(\overline{p\,\frac{\partial{u_{j}}}{\partial{x_{j}}}} -\bar{p}\,\frac{\partial{\tilde{u}_{j}}}{\partial{x_{j}}}\right)-\left( \overline{2\mu(T)\,S_{ij}^{d}\, \frac{\partial{u_{i}}}{\partial{x_{j}}}} - \overline{2\mu(T)\,\tilde{S}_{ij}^{d}}\,\frac{\partial{\tilde{u}_{i}}}{\partial{x_{j}}}\right) + \underbrace{\tau_{ij}\,\frac{\partial{\tilde{u}_{i}}}{\partial{x_{j}}}}_{{-}K_{3}}. \end{align}
As in the resolved kinetic energy balance, all the terms on the right-hand side can be cast in flux terms, which only redistribute the turbulent kinetic energy in space, and in source/sink contributions. The most interesting term, for the purposes of the present work, is certainly the last one in (4.11), which coincides exactly with the term  $K_{3}$ of (4.8) with inverted sign. Such a term is, in fact, representative of the interchange of kinetic energy between the resolved and unresolved scales within the LES formalism, or mean and fluctuating fields in the RANS framework. In other words, the dissipation of the resolved kinetic energy, denoted
 $K_{3}$, directly coincides with the production of unresolved kinetic energy. Most of the following analyses will be focused on the resolved kinetic energy balance rather than on the transport equation of the unresolved kinetic energy. Such a decision is justified mainly by the fundamental importance of the resolved kinetic energy within the LES framework. The main task of LES is, in fact, to provide a generally satisfying description of the large-scale motions and only model the influence of the smallest scales on the resolved field.
If not explicitly stated differently, all the terms of the resolved kinetic energy balance will be considered as normalised by the quantity  $\rho _{\infty } u_{\infty }^{3}/\delta$.
4.1. Averaged fields
In the DNS featuring a homogeneous direction, the density-weighted ensemble-averaging is defined from an integration in time and along the statistically homogeneous direction:
 \begin{equation} \tilde{\phi}(x_{1},x_{2})=\frac{\overline{\rho \phi}}{\bar{\rho}} =\frac{\displaystyle\int_{{-}L}^{L}\int_{0}^{T} \rho \phi \, \mathrm{d}\kern0.7pt x_{3}\, \mathrm{d} t}{\displaystyle\int_{{-}L}^{L}\int_{0}^{T} \rho \,\mathrm{d}\kern0.7pt x_{3}\, \mathrm{d} t}, \end{equation}
for a sufficiently large duration  $T$ and where
 $L$ denotes the length of the
 $x_3$ homogeneous direction. The terms
 $K_{1}$ (pressure-dilatation) and
 $K_3$ (dissipation) of (4.8) are thus first considered in a RANS context, for which the balance equations formally take the exact same form as the filtered ones.
Pressure-dilatation ( $K_1$) represents a quantity that can be expressed directly as a function of the resolved variables, as opposed to the unresolved dissipation (
 $K_3$), for which explicit turbulence modelling is needed. The pressure-dilatation term, despite being a large-scale quantity, is particularly important as it represents the primary mechanism of energy exchange between kinetic and internal energies.
Each of these terms is plotted in the whole domain in figures 14 and 15. In figure 14, showing the dissipation, black and red lines have been added to highlight zones of negative and positive values, respectively. Clearly, most of the flow field is characterised by forward transfer of kinetic energy from the mean flow to the turbulent kinetic energy, as expected in RANS. The dissipation term reaches its smallest values right after the interaction with the shock wave, indicating that most of the unresolved dissipation takes place at this location. The presence of non-zero values of dissipation in the proximity of the shock wave is instead caused by the unsteadiness of the shock front, which oscillates along the streamwise direction. As already mentioned, backscatter is rarely observed on average, whereas it is a more common feature in an explicit filtering set-up. However, in the present configuration, even on average, a large portion of the flow experiences an inverse energy transfer, from the fluctuating field to the mean flow, in the proximity of the expansion corner. The correlation between expansion/compression motions and the inverse/direct energy cascade observed by O'Brien et al. (Reference O'Brien, Urzay, Ihme, Moin and Saghafian2014) and Wang et al. (Reference Wang, Wan, Chen and Chen2018a, Reference Wang, Chen, Wang, Li, Wan and Chen2020) is then confirmed also on average. A deeper discussion of the interpretation of such behaviour will be presented in the following sections.
Dissipation of the kinetic energy of the resolved scale ( $K_3$ term of (4.8)).

The pressure-dilatation term  $\bar {p}(\partial \tilde {u}_j/\partial x_j)$ is shown in figure 15. The large-scale compression and expansion are clearly visible in the proximity of the corresponding corners. In the detached region, most of the flow is mildly compressed due to the presence of local shocklets. Closely after the main shock/turbulence interaction, the secondary shocks caused by the separated flow (visible also in figure 9) produce a relatively extended compression region downstream of the main shock. The presence of secondary shocks is also responsible for the main shock deflection, coinciding in the figure with the intersection between the two white lines. The pressure-dilatation work interacts only partially with the incoming turbulent boundary layer in a very narrow region of the flow, coinciding with the shock in the vicinity of the wall. The Reynolds number is, in fact, not large enough for the shock wave to penetrate entirely in the turbulent boundary layer. To highlight the interaction, the evolution of the most relevant terms of the resolved kinetic energy balance have been computed along the streamwise direction, at height
 $y^{+}\approx 30$ (figure 17). As already observed in figure 14, the dissipation reaches its local minimum right after the shock. At
 $x \approx -3 \delta$, the turbulent boundary layer interacts with the main shock wave generating fluctuations at smaller scales, thereby promoting a large amount of dissipation immediately after. For the same reason, downstream of the primary shock, turbulent kinetic energy is locally produced and subsequently advected in the detached region (see figure 16). Similarly to the kinetic energy dissipation, non-zero values of turbulent kinetic energy in proximity of the shock wave are caused mainly by the oscillation of the shock wave. It is worth mentioning that the pressure-dilatation work assumes non-negligible values only in proximity of the shock wave. Across the shock, in fact, kinetic energy is converted locally in internal energy, precisely, through the pressure-dilatation term. In terms of resolved kinetic energy balance, the negative values of dissipation and pressure-dilatation work are compensated mainly by the flux term
 $K_{0}$, which assumes mostly positive values along the streamwise direction. The sum of all the terms on the right-hand side of (4.8) has been evaluated, and it is additionally shown in figure 17 as a solid black line. The local balance of resolved kinetic energy is very close to zero, indicating an accurate prediction not only of the large-scale terms such as pressure-dilatation and viscous dissipation, but also of the unclosed fluctuating contributions such as the unresolved dissipation term
 $K_{3}$. Furthermore, an accurate local balance of resolved kinetic energy is also indicative of negligible numerical dissipation, confirming the high resolution of the present DNS.
Pressure-dilatation term ( $K_1$ term of (4.8)).

Normalised turbulent kinetic energy:  $2 \bar {\rho } k/(\rho _{\infty } u_{\infty }^{2})$.

Main terms of the resolved kinetic energy balance (see (4.8)) along the streamwise direction at height  $y^{+}\approx 30$. Dashed line, flux term
 $K_{0}$; dotted line, pressure-dilatation work
 $K_{1}$; dash-dotted line, dissipation term of the resolved part of the kinetic energy
 $K_{3}$; solid line, local balance of the resolved kinetic energy
 $\sum _{i=0}^{5}K_{i}$ (
 $K_5$ from (4.13)). All the terms are normalised by
 $\rho _{\infty }u_{\infty }^{3}/ \delta$.

An additional term in (4.8), representing the contribution of the artificial viscosity model, has been taken into account in the evaluation of the resolved kinetic energy balance shown in figure 17. Such a term can be written as
 \begin{equation} K_{5} = \frac{\partial{}}{\partial{x_{j}}}\left(\beta_{{AV}}\,\frac{\partial{\tilde{u}_{k}}}{\partial{x_{k}}}\,\tilde{u}_{j}\right) - \beta_{{AV}} \left(\frac{\partial{\tilde{u}_{k}}}{\partial{x_{k}}}\right)^{2} = K_{5}^{f} + K_{5}^{s}. \end{equation}
Its contribution to the total balance of resolved kinetic energy has been shown to be smaller than the other relevant terms. The expression of such a term has been omitted in (4.8) for clarity purposes. In agreement with the classical analysis of kinetic energy balance, the artificial viscosity term has been written as the sum of a flux term and a sink term. A visual comparison of these two terms along the streamwise direction at height  $y^{+}\approx 30$ is shown in figure 18. It can be seen that both terms are particularly small in comparison to the other relevant terms (compare with figure 17), even more so away from the main shock. Furthermore, the flux component, which only represents a redistribution of resolved kinetic energy, is the dominant one between the two contributions. The dissipative nature of the artificial viscosity model is then quantified more representatively by the sink contribution, which is negative by construction. The sink contribution is much smaller, not only with respect to the other terms in the balance of resolved kinetic energy, but also with respect to the flux counterpart. It is then confirmed that the bulk artificial viscosity model herein employed has a very small influence in the overall budget of resolved kinetic energy.
Artificial viscosity terms of the resolved kinetic energy balance. Dotted line, flux contribution  $K_{5}^{f}$; dashed line, sink contribution
 $K_{5}^{s}$; solid line, sum of the two,
 $K_{5} = K_{5}^{f} + K_{5}^{s}$. Notice that the vertical axis units are scaled by
 $10^{-5}$.

4.2. Space filtered versus averaged fields
The differential filter proposed by Germano (Reference Germano1986) is applied, in which the resolution of a heat-type equation is performed with the spectral difference scheme employed for simulating the flow. Filter widths  $\varDelta = 2h$,
 $\varDelta = 4h$ and
 $\varDelta = 8h$ have been considered in the following analysis, with
 $h$ the DNS resolution.
The role of compressibility in kinetic energy transfers has been investigated extensively (O'Brien et al. Reference O'Brien, Urzay, Ihme, Moin and Saghafian2014; Wang, Gotoh & Watanabe Reference Wang, Gotoh and Watanabe2017; Sidharth & Candler Reference Sidharth and Candler2018; Wang et al. Reference Wang, Wan, Chen and Chen2018a,Reference Wang, Wan, Chen, Xie and Chenb; Chen et al. Reference Chen, Wang, Li, Wan and Chen2019; Wang et al. Reference Wang, Chen, Wang, Li, Wan and Chen2020), where the most relevant studies have been focused on the interconnection between large-scale dilatation, turbulent Mach number and dissipation. The first two represent the most relevant indicators of local levels of compressibility, and the last one drives the canonical mechanism of kinetic energy redistribution along scales in turbulent flows.
All the PDFs that will be considered in the following sections have been computed using the nodal values of the variable of interest in the portion of domain downstream from the plane  $x=-8 \delta$. For filtered fields, instantaneous PDFs and joint PDFs (JPDFs) have been computed every
 $5\, \delta /u_{\infty }$ seconds for
 $30$ distinct flow field snapshots. The resulting PDFs and JPDFs have been averaged subsequently over time, and normalised to integrate to unity.
In figure 19(a), the PDF of the dissipation term of the resolved field (term  $K_3$ in (4.8)) is shown using both averaging and filtering approaches. Some peculiar differences can be seen. The first, most relevant, can be identified in an evident prevalence of negative contributions of
 $K_{3}$ using averaged fields (see figure 19b). On average, within reasonable bounds, the assumption of classic kinetic energy cascade holds, whereas using the filtering operation, a much larger amount of both positive and negative values are observed. Still, the left tail of the PDF is clearly longer than the right one, indicating that forward transfer is still more likely to occur than backscatter. Even if the general behaviour of averaged and filtered PDFs is clearly different, mean values are similar. Such observation is in agreement with the suitability of eddy-viscosity models: their dissipative nature is, in fact, able to represent mean kinetic energy transfers (but not local ones). The influence of the small scales on the resolved flow field is then fairly well approximated, despite the absence of explicit backscatter mechanisms.
(a) PDF of the SGS kinetic energy dissipation term ( $K_{3}$). Black line, averaging; blue line, filtering with
 $\varDelta =2h$; red line, filtering with
 $\varDelta =4h$; and green line, filtering with
 $\varDelta =8h$. (b) Detailed view of (a).

Second, as expected, local interactions allow much larger values of both inverse and direct energy cascade due to a less regular flow field. Smaller filter widths lead, in fact, to larger gradients and therefore larger values of dissipation. Such behaviour is clearly visible in figure 19(a), where a narrower PDF is observed for the largest filter size ( $\varDelta = 8h$). Similar trends have been reported already in the case of compressible forced isotropic turbulence by Wang et al. (Reference Wang, Wan, Chen and Chen2018a). Finally, the negligible difference between the PDFs for
 $\varDelta = 2 h$ and
 $\varDelta = 4h$ is a good accuracy indicator for the present computation. A very small amount of kinetic energy is, in fact, transferred between the two scales, showing that the total kinetic energy can be considered fairly well resolved by the Nyquist grid size (see also figure 7b).
In the present work, as a classical indicator of small-scale compressibility activity, the SGS Mach number has been considered, defined as
 \begin{equation} Ma_{{SGS}} = \sqrt{\frac{2 \bar{\rho} k}{3 \gamma \bar{p}}}.\end{equation}
The averaged SGS Mach number throughout the domain is shown in figure 20. In figures 21 and 22, the filtered SGS Mach number is displayed for increasing filter size. The maximum value of the averaged SGS Mach number is approximately equal to  $0.32$. Using explicit filtering, instead, slightly higher values can be observed (around
 $0.42$ for
 $\varDelta =4h$ and
 $\varDelta =8h$). Non-negligible compressibility effects are expected for values approximately larger than
 $0.3$ (Passot & Pouquet Reference Passot and Pouquet1987; Erlebacher et al. Reference Erlebacher, Hussaini, Speziale and Zang1990; Sarkar, Erlebacher & Hussaini Reference Sarkar, Erlebacher and Hussaini1991a; Sarkar et al. Reference Sarkar, Erlebacher, Hussaini and Kreiss1991b). Such values have been reported mainly in the detached region of the flow, where compressibility is expected to have a much stronger influence. Non-zero values of the turbulent kinetic energy are observed not only in the detached region but also in the proximity of the shock wave, where the flow is essentially laminar. On average, the generation of turbulent kinetic energy at the shock location is explained by the oscillation of the shock wave in the streamwise direction. Considering LES space filtering, sucha tendency is caused simply by the spatial regularisation of the discontinuity. (A shock wave, from a numerical point of view, will still represent an unresolved feature of the flow even if not directly linked to the classical concept of turbulence under-resolution.)
Averaged SGS Mach number (see (4.14)).

Filtered SGS Mach number ( $\varDelta = 4h$).

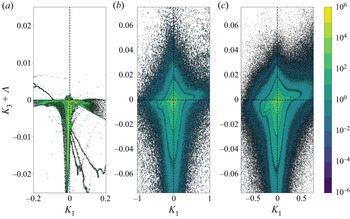
To focus on the mutual influence between kinetic energy transfers and compressibility, the correlation between large-scale pressure-dilatation work and SGS kinetic energy dissipation is analysed in figure 23, where the JPDF of the  $K_3$ and
 $K_1$ terms is depicted. On average, a large amount of the flow field is characterised by a classical direct energy cascade, as the kinetic energy dissipation term is evidently skewed toward negative values. The evident branch of positive values of dissipation in the second quadrant is instead caused by the expansion fan downstream of the compression ramp (see figure 14 for comparison).
Filtered SGS Mach number ( $\varDelta = 8h$).

Considering filtered quantities, both differences and analogies can be seen. Differently with respect to the JPDF of the averaged field, a larger amount of backscatter is present, in particular, in compression regions. Expansion motions are still characterised mainly by backscatter, whereas compressions enhance a direct energy cascade. Such a tendency is more evident for larger filter widths and is connected intrinsically to the previous figures 21 and 22: for larger filter widths, the unresolved kinetic energy is higher, leading to larger SGS Mach numbers and consequently a stronger influence of compressibility in kinetic energy transfers.
JPDFs of dissipation of resolved scales ( $K_3$) and resolved pressure-dilatation work (
 $K_1$). (a) Averaged data; (b) filtered data with
 $\varDelta = 4h$; (c) filtered data with
 $\varDelta = 8h$.

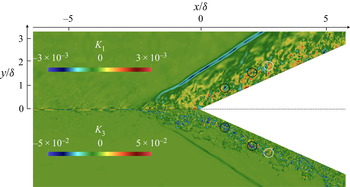
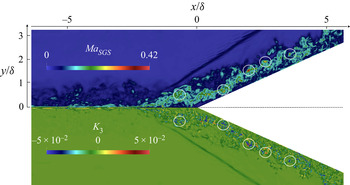
A more intuitive visualisation of pressure-dilatation work and dissipation of the resolved scales is shown in figure 24, where local interactions are highlighted: compression regions are characterised by classical forward kinetic energy cascade, whereas, vice versa, expansion regions are more likely to experience backscatter.
Visual comparison of dissipation (bottom,  $K_3$) and pressure-dilatation work (top,
 $K_1$) for a given instantaneous filtered field (
 $\varDelta = 4h$). The two quantities are shown in a specular way to ease the comparison. White and black circles highlight regions of intense back and forward scattering, respectively.

Notice that the JPDF of the averaged field in figure 23(a) is in large amount restricted to a very narrow region along the  $K_{1}=0$ line, meaning that, on average, most of the unresolved activity is restricted to regions of negligible pressure-dilatation work. The strongest kinetic energy transfers are located right downstream of the interaction with the shock wave, where the flow is only mildly compressed due to the presence of shocklets generated by the detached flow. Considering filtered fields, the JPDFs are much wider and characterised by a large amount of both positive and negative pressure-dilatation work. The shape of the JPDF of the averaged field can be explained by the highly intermittent character of the separated flow. The averaging operation causes an overall compensation between compression and expansion regions. Such an effect is an example of the kind of information that is lost when studying averaged fields only.
From the JPDFs of figure 23, the correlation coefficients between resolved dissipation of scales and resolved pressure-dilatation work can be computed easily, providing a more statistically quantitative evaluation of the interplay between the two terms. In the first row of table 4, the correlation coefficients over the whole plane are listed for averaged and filtered fields.  $K_{1}$ and
 $K_{3}$ are more and more correlated for increasing filter widths, and even more correlated on average, with correlation coefficient
 $0.2775$. In the remaining rows of table 4, the correlation coefficients in the different quadrants of the
 $K_{1}$–
 $K_{3}$ plane have been evaluated to identify which one of them has the strongest influence on the overall correlation. Since the fields are mildly correlated, the predominant quadrants to observe are the first and third. It can be seen that on average, the first quadrant is the most influential, with correlation coefficient
 $0.8781$, whereas an almost null correlation coefficient resulted from the third quadrant. Such general behaviour is clearly visible in figure 23(a), where in the third quadrant, the JPDF is almost perfectly aligned with the
 $K_{3}$ axis, indicative of a considerably small correlation. In the first quadrant, instead, the JPDF is much closer to the bisector of the first and third quadrant. Similar trends are observed for filtered data too (figure 23a,b), where the correlation coefficient in the first quadrant is larger than the one computed in the third quadrant. The difference between the two values is considerably smaller compared to the averaged case. The large correlation coefficient in the first quadrant indicates that the correlation between dissipation of resolved scales and resolved pressure-dilatation work is stronger in expansion regions undergoing backscatter events rather than in compression motions experiencing classical forward energy cascade. It is then relevant to highlight that the importance of compressibility in the modelling is imposed not entirely by the physics of the problem, but it is also strongly influenced by the filter width and thus by the flow resolution chosen for the simulation. A relatively coarse LES is then more likely to experience a stronger influence of compressibility in the modelling rather than well-resolved simulations.
Correlation coefficients between  $K_{1}$ and
 $K_{3}$, in the different quadrants.

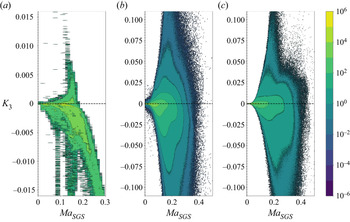
Another way to study the relation between compressibility and kinetic energy transfer is to relate the SGS Mach number to the SGS kinetic energy dissipation. In figure 25, the JPDFs of these two quantities are shown considering both averaging and filtering approaches. The amount of forward kinetic energy transfer gets stronger and stronger for increasing values of  $Ma_{{SGS}}$, indicating that larger turbulent Mach numbers enhance dissipation of the resolved scales.
JPDFs of SGS kinetic energy dissipation and  $Ma_{{SGS}}$. (a) Averaged data; (b) filtered data with
 $\varDelta = 4h$; (c) filtered data with
 $\varDelta = 8h$.

Considering the filtered counterparts, a large amount of backscatter is present, even if the JPDF is still clearly asymmetric toward negative values of  $K_{3}$. In a similar way with respect to the averaged terms, both forward and back scattering tend to increase for larger SGS Mach numbers. This can be observed clearly in figure 26 as well, where a direct comparison of the two quantities is shown for a given instantaneous filtered field.
Visual comparison of SGS dissipation (bottom) and SGS Mach number (top) for a given instantaneous filtered field ( $\varDelta = 4h$). The two quantities are shown in a specular way to ease the comparison. Circles highlight strong energy transfer regions.

Figure 25 links two quantities that are both unresolved, since the definition of SGS Mach number involves the turbulent kinetic energy. On the contrary, figure 23 relates an unclosed term, such as the dissipation of the resolved kinetic energy, to the large- scale pressure-dilatation work, giving more useful information in terms of turbulence modelling.
5. Eddy-viscosity hypothesis
In the previous discussions, the dissipation of the resolved kinetic energy has been used as the sole indicator of backscatter. Still, due to the intrinsic compressible character of the equations, it is reasonable to decompose the dissipation term into two separate contributions:
 \begin{equation} -\tau_{ij}\,\frac{\partial{\tilde{u}_{i}}}{\partial{x_{j}}} ={-}\left(\tau_{ij}^{d}+\tfrac{1}{3}\tau_{kk}\delta_{ij}\right)\frac{\partial{\tilde{u}_{i}}}{\partial{x_{j}}} ={-}\tau_{ij}^{d}\,\frac{\partial{\tilde{u}_{i}}}{\partial{x_{j}}} -\tfrac{1}{3}\tau_{kk}\,\frac{\partial{\tilde{u}_{i}}}{\partial{x_{i}}}, \end{equation}
where  $\tau _{ij}^{d} = \tau _{ij}-\frac {1}{3}\tau _{kk}\delta _{ij}$ is the deviatoric part of the SGS tensor. Under incompressible conditions, such decomposition is redundant from an energetic point of view, due to the solenoidal nature of the velocity field. In other words, the influence of the trace of the SGS tensor on the large-scale kinetic energy is directly proportional to the level of compressibility of the flow, quantified by the velocity field dilatation. To recover a traceless tensor, in compressible LES, commonly only the deviatoric part of the SGS tensor is modelled using an eddy-viscosity hypothesis (see (4.7)). The influence of this hypothesis on the total resolved kinetic energy is then expressed as
 \begin{equation} -\tau_{ij}\,\frac{\partial{\tilde{u}_{i}}}{\partial{x_{j}}} +\tfrac{1}{3}\tau_{kk}\, \frac{\partial{\tilde{u}_{l}}}{\partial{x_{l}}} ={-}2 \bar{\rho} \nu_{t} \tilde{S}_{ij}^{d}\, \frac{\partial{\tilde{u}_{i}}}{\partial{x_{j}}} \end{equation}
(see Rogallo & Moin Reference Rogallo and Moin1984), which leads to the following expression for eddy-viscosity:
 \begin{equation} \nu_{t} = \frac{K_{3}+\varLambda}{-2 \bar{\rho} \tilde{S}_{ij}^{d} (\partial \tilde{u}_{i}/\partial x_{j})}, \end{equation}
where  $\varLambda =-(2/3)\bar {\rho } k (\partial \tilde {u}_{l}/\partial x_{l})$. Such a formulation can be interpreted in both the filtered and averaged sense.
The term  $\varLambda$ represents the turbulent kinetic energy transfer due to the spherical part of the SGS tensor. It is usually modelled following the Yoshizawa (Reference Yoshizawa1986) approach, also with a dynamic formulation (Moin et al. Reference Moin, Squires, Cabot and Lee1991). This term, involving the turbulent kinetic energy, vanishes in the incompressible case, and the presence of negative/positive eddy-viscosities is entirely caused by the sign of the dissipation term (i.e. backscatter implies negative eddy-viscosities and, vice versa, forward kinetic energy transfer causes positive eddy-viscosities). Consequently, the unresolved part of the turbulent kinetic energy does not play a role in terms of dissipation of the resolved part of the kinetic energy in incompressible conditions. For non-spectral filters, as observed by Vreman, Geurts & Kuerten (Reference Vreman, Geurts and Kuerten1994), the turbulent kinetic energy always takes positive values. Consequently, in the compressible case, the term
 $\varLambda$ is negative in expansion regions and positive in compression regions, thus following an opposite trend with respect to
 $K_{3}$.
JPDFs of SGS dissipation and  $\varLambda$. The solid black line denotes the line
 $\nu _{t}=0$. (a) Averaged data; (b) filtered data with
 $\varDelta = 4h$; (c) filtered data with
 $\varDelta = 8h$. Both
 $K_{3}$ and
 $\varLambda$ are normalised by
 $\rho _{\infty }u_{\infty }^{3}/ \delta$.

In figure 27, the JPDF of these two terms has been plotted for both averaging and explicit filtering. The solid black line denotes the line  $\nu _{t}=0$ (i.e.
 $K_{3} = -\varLambda$). Below this line, the eddy-viscosity assumes positive values, whereas above it, the eddy-viscosity is negative. Regarding the JPDF within the RANS context, a clear prevalence of forward kinetic energy cascade can be observed. The term
 $K_{3}$ assumes mostly negative values, and it is particularly clustered around the vertical line
 $\varLambda =0$. This property indicates that most of the energy transfers are located in regions of negligible dilatation (at least on average). Furthermore, a distinct bandwidth of non-null values of the JPDF is almost perfectly aligned with the
 $\nu _{t}=0$ line. This narrow stripe is located slightly below the
 $\nu _{t}=0$ line, as it extends for relatively large values of
 $\varLambda$. Finally, the JPDF is almost entirely confined below the
 $\nu _{t}=0$ line, indicating that in statistical mean, the assumption of positive eddy-viscosity can be fairly accurate, even in the presence of backscatter. The term
 $\varLambda$, in fact, compensates the backscatter phenomenon, preventing the occurrence of negative eddy-viscosities. With the space filtered fields, the same tendencies are present but in a less evident form. Even if a forward kinetic energy cascade is generally more likely to occur than backscatter, a large amount of the flow field is characterised by negative values of the eddy-viscosity. In analogy to table 4, in table 5 the correlation coefficients between
 $\varLambda$ and
 $K_{3}$ have been computed in the whole domain, and in the different quadrants of the
 $\varLambda$–
 $K_{3}$ plane. As observed in figure 27, the two fields are mildly anticorrelated. The correlation coefficients are negative, and they are more and more negative for increasing filter widths. Compared to both filtered fields,
 $\varLambda$ and
 $K_{3}$ in the average field are more anticorrelated, with correlation coefficient
 $-\,0.4755$. Since
 $\varLambda$ and
 $K_{3}$ are generally anticorrelated, the second and fourth quadrants can give more insightful information on their mutual dependency. Both on average and for filtered fields, the second quadrant is characterised by a stronger anticorrelation with respect to the fourth quadrant. As observed in table 4, such a difference is less pronounced for filtered fields. In analogy with the previous discussion regarding
 $K_{1}$ and
 $K_{3}$, the stronger influence of the second quadrant indicates that the coexistence of backscatter events and negative values of
 $\varLambda$ is the dominant mechanism of anticorrelation between the two fields.
Correlation coefficients between  $\varLambda$ and
 $K_{3}$, in the different quadrants.

To highlight the difference between  $K_{3}$ and the sum
 $K_{3}+\varLambda$, their averaged values are shown in figure 28. Following the classical definition of kinetic energy transfer based on
 $K_{3}$, the expansion region experiences strong backscatter (figure 28a), but if the compressible contribution
 $\varLambda$ is accounted for, then only negative values are observed in the whole domain. It is then reasonable to conclude that the deviatoric part of the SGS tensor, on average, has an essentially dissipative role, whereas the trace is directly responsible for the backscatter observed in the proximity of the expansion corner.
Comparison between averaged terms (a)  $K_3$ and (b)
 $K_3+\varLambda$. Both terms are normalised by
 $\rho _{\infty }u_{\infty }^{3}/ \delta$.

To evaluate the contribution of the spherical part on the total SGS kinetic energy dissipation, the joint probability function of the deviatoric contribution  $K_{3}+\varLambda$ with respect to the large-scale pressure-dilatation work
 $K_{1}$ has been computed and shown in figure 29. Starting from the JPDF of the averaged field, in agreement with figure 28, the deviatoric contribution of the SGS kinetic energy dissipation takes negative values only. The backscatter region observed in figure 23(a) completely disappears when the spherical part is subtracted. In the filtered case, instead, a mild correlation between the two terms can still be observed even though it is considerably weaker, in particular for small filter widths. These observations highlight a clearly different behaviour between averaged and filtered approaches. On the one hand, the correlation, once observed, completely vanishes on average when the spherical part is subtracted. On the other hand, the same correlation persists when evaluated on filtered fields. The correlation coefficients between the deviatoric contribution of the dissipation of resolved scales and the resolved pressure-dilatation work are listed in table 6. The correlation coefficients evaluated on the whole domain are significantly close to zero. It is particularly interesting to compare these values with the ones listed in table 4: the positive correlation observed in table 4 is now reduced considerably if not completely set to zero. As previously discussed, the correlation between dissipation of the resolved scales and resolved pressure-dilatation work is caused mainly by the spherical contribution of (5.1). Since the correlation between the two terms is very mild, the correlation coefficients evaluated in the different quadrants are not as revealing as the ones computed on previous JPDFs.
JPDFs of deviatoric SGS dissipation and large-scale pressure-dilatation work. (a) Averaged data; (b) filtered data with  $\varDelta = 4h$; (c) filtered data with
 $\varDelta = 8h$.

Correlation coefficients between  $K_{1}$ and
 $K_{3}+\varLambda$, in the different quadrants.

To facilitate the comparison, figure 30 shows the JPDFs of the averaged field accounting, respectively, for both deviatoric and spherical contributions or for deviatoric contributions only. A spherical bulk term, such as the one introduced by the artificial viscosity scheme, can be interpreted interestingly as some kind of approximation of the turbulent kinetic energy itself. In fact, close to the shock wave, the flow field divergence is negative, and the term
 \begin{equation} \beta\,\frac{\partial{\tilde{u}_{k}}}{\partial{x_{k}}} \end{equation}
is consistently negative too, where  $\beta$ is a bulk viscosity. From a direct comparison of such a term with the spherical part of the SGS tensor, the following heuristic expression can be obtained easily:
 \begin{equation} \tfrac{2}{3} \bar{\rho} k \sim{-} \beta\,\frac{\partial{\tilde{u}_{k}}}{\partial{x_{k}}}. \end{equation}
Averaged JPDFs of standard and deviatoric SGS dissipation and large-scale pressure-dilatation work. (a)  $K_{3}$; (b)
 $K_{3}+\varLambda$.

Away from the shock, such similarity is less evident. Nevertheless, the parallelism between compression regions and positive turbulent kinetic energy can be used conveniently for modelling purposes. In fact, it can be proved easily that a bulk viscosity term in the momentum equation causes large-scale kinetic energy dissipation. Therefore, the additional bulk term would ideally reproduce only the dissipative character of the turbulent kinetic energy on the large scales, in a fashion that resembles eddy-viscosity models, where only the direct kinetic energy transfers are modelled. In a similar way, Wang et al. (Reference Wang, Wan, Chen and Chen2018a, Reference Wang, Chen, Wang, Li, Wan and Chen2020) proposed a simplified relation between SGS dissipation and dilatation, reporting a scaling close to  $(\partial \tilde {u}_{k}/\partial x_{k})^{2}$ in compression regions, which is the same form as a bulk viscosity term. In their work, the total SGS dissipation was analysed, including both deviatoric and spherical contributions. The bulk viscosity, furthermore, has a well-known dissipative character on the dilatation field, reinforcing the idea of SGS modelling as essentially a regularisation technique.
In the incompressible case, vorticity is smoothed thorough explicit filtering of DNS data, and an analogous mechanism needs to be present in under-resolved a posteriori simulations, for example, through an augmented shear viscosity. In the same way, a similar tendency is expected for the dilatation. The filtered dilatation will result as less singular and irregular. Thus a regularisation of it would be produced successfully by an artificial bulk term in the resolution of the filtered momentum equation. The natural decoupling between dilatational and solenoidal contributions in compressible turbulence (see Pan & Johnsen Reference Pan and Johnsen2017) clearly indicates a convenient dichotomy based on Helmholtz decomposition. The contraposition between solenoidal and dilatational field (and consequently vorticity and divergence) could possibly suggest a parallelism in the SGS modelling as well, based on the difference between deviatoric and spherical components of the SGS tensor, that could be possibly modelled using their respective natural choices of shear and bulk viscosities.
Preliminary computations of an LES of a similar configuration using the same inflow boundary condition, artificial viscosity model and numerical scheme (Tonicello, Lodato & Vervisch Reference Tonicello, Lodato and Vervisch2021) have shown promising results in combination with the recently developed spectral element dynamic model (Chapelier & Lodato Reference Chapelier and Lodato2016) as the SGS model. Future research will be focused on the design of further generalisations of the spectral element dynamic model for highly compressible turbulent flows, paying particular attention to the deviatoric component of the SGS tensor. The development of such a model, which is outside the scope of the present study, will be grounded on the high fidelity data extracted from the present DNS, which represent a solid background for the design of novel SGS models. The information gathered from the DNS can, in fact, be used to perform an extensive range of physical and numerical analyses on a posteriori LES computations, including detailed studies on SGS modelling and numerical dissipation/dispersion under non-negligible compressibility effects.
Nonetheless, the methodical development of such a model is far beyond the scope of the present work. The DNS presented herein can be interpreted as very first step in this direction, and future work will be focused on this matter.
6. Conclusions
A DNS of a  $24^{\circ }$ compression/expansion ramp has been performed using a high-order spectral difference code. The presented set-up has been chosen as a popular example of shock-wave–turbulence interaction. Despite its relatively simple geometry, the interaction between a supersonic boundary layer and compression/expansion ramps is representative of many different complex features of compressible turbulent flows.
After a thorough validation, considering mean profiles and wall coefficients, a series of a priori analyses has been considered. The present work has been developed using both averaging and explicit filtering, providing a clear dualism between RANS and LES approaches, respectively. Most of the attention has been focused on specific terms that appear in the resolved kinetic energy balance in both the filtered and averaged sense. In particular, the well-known dissipation term has been analysed in detail. It has been shown that in the present set-up, following both the averaging and filtering formalisms, the presence of both direct and reverse kinetic energy cascade was observed. In agreement with previous observations (O'Brien et al. Reference O'Brien, Urzay, Ihme, Moin and Saghafian2014; Wang et al. Reference Wang, Wan, Chen and Chen2018a), compression regions are mostly characterised by forward kinetic energy transfers, whereas an inverse cascade is promoted by expansion motions.
Subsequently, the dissipation term has been decomposed in deviatoric and spherical contributions. Such a procedure has been used to evaluate the suitability of eddy-viscosity models for the deviatoric part of the SGS tensor in compressible flows. Averaged results have shown that the expression of equivalent eddy-viscosity rarely assumes negative values throughout the whole domain. It is then evident that the correlation, already observed, between large-scale dilatation and SGS dissipation is, in large part, caused by the spherical part of the SGS tensor. Its corresponding term in the total kinetic energy balance is, in fact, directly proportional to the divergence of the velocity field. The importance of proper modelling of the spherical part of the SGS tensor is then highlighted.
For sufficiently high turbulent Mach numbers, the influence of expansion/compression motions and, consequently, of the spherical part of the SGS tensor, increases, revealing a clear mechanism of backscatter based on the local levels of compressibility. It has been observed that, inspired by classical eddy-viscosity models for the deviatoric part, a bulk viscosity could be used as an SGS model for the turbulent kinetic energy. Further analyses will be focused on a better understanding of solenoidal and dilatational contributions on kinetic energy transfers. The ultimate goal of such analyses is identified in the development of SGS models (in particular for the turbulent kinetic energy) more suitable to high-order simulations of compressible flows.
Acknowledgements
The use of the SD solver originally developed by A. Jameson's group at Stanford University is gratefully acknowledged. This work was granted access to the high-performance computing resources of CRIANN. The PhD scholarship of the first author is founded by the University of Rouen Normandie.
Funding
Financial support to the second and third authors was provided by ANR under grant number ANR-18-CE05-0030.
Declaration of interests
The authors report no conflict of interest.
Appendix A. The spectral difference scheme
The spectral difference method (Kopriva & Kolias Reference Kopriva and Kolias1996; Liu, Vinokur & Wang Reference Liu, Vinokur and Wang2006; Wang et al. Reference Wang, Liu, May and Jameson2007) solves the strong form of the differential equation using piecewise continuous functions as approximation space. Consequently, the solution is assumed to be discontinuous at the element interface. In order to have a consistent discretisation, the solution is interpolated using a polynomial of degree  $N-1$, while the flux, which is connected to the conservative variables via a divergence operator, is approximated with a polynomial of degree
 $N$. The most important ingredient of the spectral difference discretisation is the definition of two different set of points: solution and flux points. The numerical solution is defined on the nodes
 $x_i^s$, with
 $i=0,\ldots,N-1$. Fluxes, instead, are defined on a different set of nodes
 $x_{i}^f$, with
 $i=0,\ldots,N$, among which boundary points are included. It will be noted that in the present study, the solution points are set as the Gauss–Legendre points of order
 $N$, a sensible choice to minimise aliasing errors in the nonlinear case while defining a well-conditioned basis set for the solution interpolation (Jameson et al. Reference Jameson, Vincent and Castonguay2012), whereas the flux points are set as the Gauss–Legendre points of order
 $N$ plus the two end points
 $-1$ and 1 to ensure linear stability (Jameson Reference Jameson2010). An example of solution and flux points for a polynomial approximation of degree
 $N=4$ is shown in figure 31. The solution is approximated with a polynomial of degree
 $N-1$:
 \begin{equation} \hat{u}(\hat{x})=\sum_{i=0}^{N-1}u_{i}\,l^{s}_{i}(\hat{x}).\end{equation}
In the spectral difference scheme, the values of the solution are extrapolated at the flux points
 \begin{equation} \hat{u}(\hat{x}^{f}_{j})=\sum_{i=0}^{N-1}u_{i}\,l^{s}_{i}(\hat{x}^{f}_{j}), \quad j=0,\ldots,N, \end{equation}
and then used to compute fluxes on the same collocation basis:
 \begin{equation} f_{j}= \hat{f}(\hat{x}^f_{j})=\hat{f}(\hat{u}(\hat{x}^{f}_{j})). \end{equation}
Then a continuous flux polynomial of degree  $N$ is constructed, by Lagrange interpolation, using the fluxes evaluated from the interpolated solution at the interior flux points and the numerical fluxes at the element interfaces:
 \begin{equation} \hat{f}(\hat{x})= \hat{f}^{I}_{L}\,l^f_{0}(\hat{x}) +\sum_{j=1}^{N-1}f_{j}\,l^f_{j}(\hat{x}) +\hat{f}^{I}_{R}\,l^f_{N}(\hat{x}). \end{equation}
In other words, the interpolated values of the flux at element extrema are substituted by the interface numerical fluxes  $\hat {f}^{I}_{L}$ and
 $\hat {f}^{I}_{R}$. Finally, the flux divergence is evaluated at the solution points,
 \begin{equation} \frac{\mathrm{d}{\hat{f}}}{\mathrm{d}{\hat{x}}}(\hat{x}^s_{i})= \hat{f}^{I}_{L}\,\frac{\mathrm{d}{l^f_{0}}}{\mathrm{d}{\hat{x}}}(\hat{x}^{s}_{i}) +\sum_{j=1}^{N-1}f_{j}\,\frac{\mathrm{d}{l^f_{j}}}{\mathrm{d}{\hat{x}}}(\hat{x}^{s}_{i}) +\hat{f}^{I}_{R}\,\frac{\mathrm{d}{l^f_{N}}}{\mathrm{d}{\hat{x}}}(\hat{x}^{s}_{i}),\end{equation}
and the numerical solution can be advanced in time using a suitable time integration scheme discretising the equation
 \begin{equation} \frac{\mathrm{d}{\hat{u}}}{\mathrm{d}{{t}}}={-}\frac{\mathrm{d}{\hat{f}}}{\mathrm{d}{\hat{x}}}(\hat{x}^s_{i}).\end{equation}
Once the one-dimensional strategy is defined, the three-dimensional generalisation can be obtained easily. The governing equations are once again transferred from the physical to the computational domain through the change of coordinates
 \begin{equation} \boldsymbol{x} = \sum_{i=0}^{K} M_{i}(\hat{\boldsymbol{x}})\,\boldsymbol{x}_{i}, \end{equation}
where  $K$ is the number of points defining the physical element, whereas
 $\boldsymbol {x}_{i}$ and
 $M_{i}$ are the relevant position vectors (in physical space) and shape functions, respectively.
Solution (red circles) and flux (blue squares) points of spectral difference discretisation in the reference element ( $N=4$).

The equations then take the form
 \begin{equation} \frac{\partial{\boldsymbol{Q}}}{\partial{t}} + \boldsymbol{\nabla}_{\hat{x}} \boldsymbol{\cdot} \boldsymbol{G} = \boldsymbol{0}, \end{equation}
where  $\boldsymbol {Q}=\text {det}(J)\boldsymbol {U}$ and
 $\boldsymbol {G}=\text {adj}(J) \boldsymbol {\cdot } \boldsymbol {F}$, with
 $\text {det}(J)$ and
 $\text {adj}(J)$ representing, respectively, the determinant and the adjoint of the Jacobian of the transformation
 $J=\partial \hat {\boldsymbol {x}} /\partial \boldsymbol {x}$. Clearly, the aforementioned change of coordinates consisted simply in a linear scaling in the one-dimensional analysis, whereas in multiple dimensions, more complex deformations of the reference element are allowed. In this sense, using appropriate definitions of coordinate transformation, it is possible to handle highly complex geometries with a reasonably small effort. Of course, the geometrical flexibility of spectral element methods represents a very desirable feature for realistic CFD configurations.
Within the element, solution and flux points are defined in a tensor product fashion, leading to the following expression of the interpolated representation of conserved variables:
 \begin{equation} \boldsymbol{U}(\hat{x},\hat{y},\hat{z}) = \sum_{i=0}^{N-1} \sum_{j=0}^{N-1} \sum_{k=0}^{N-1}\frac{\boldsymbol{Q}_{i,j,k}}{\det{(J)}_{i,j,k}} \,l_{i}^{s}(\hat{x})\,l_{j}^{s}(\hat{y})\,l_{k}^{s}(\hat{z}), \end{equation}
where  $l_{i}(\hat {x})$,
 $l_{j}(\hat {y})$,
 $l_{k}(\hat {z})$ represent one-dimensional Lagrange polynomials along the three dimensions of the reference element. Similarly to the one-dimensional case, along each direction the polynomial approximation defines immediately a strategy to evaluate the conserved variables at the flux points, namely,
 $$\begin{gather} \boldsymbol{U}_{f,j,k} = \sum_{i=0}^{N-1} \frac{\boldsymbol{Q}_{i,j,k}}{\det{(J)}_{i,j,k}}\, l_{i}^{s}(\hat{x}_{f}), \end{gather}$$
 $$\begin{gather}\boldsymbol{U}_{i,f,k} = \sum_{j=0}^{N-1} \frac{\boldsymbol{Q}_{i,j,k}}{\det{(J)}_{i,j,k}}\,l_{j}^{s}(\hat{y}_{f}), \end{gather}$$
 $$\begin{gather}\boldsymbol{U}_{i,j,f} = \sum_{k=0}^{N-1} \frac{\boldsymbol{Q}_{i,j,k}}{\det{(J)}_{i,j,k}}\,l_{k}^{s}(\hat{z}_{f}), \end{gather}$$
with  $f=0,\ldots,N$. An example of tensor product location of solution and flux points is shown in the reference element in figure 32.
Distribution of solution (red circles) and flux points (blue squares) in the standard element for a third-order spatial discretisation.

Fluxes, considered here only along  $\hat {x}$ for simplicity, can be written as
 \begin{equation} \boldsymbol{G}_{j,k}^{1}(\hat{x}) = \sum_{p=0}^{N}(\text{adj}(J) \boldsymbol{\cdot} \boldsymbol{F})^{1}_{p,j,k}\,l_{p}^{f}(\hat{x}), \end{equation}
where  $(\text {adj}(J) \boldsymbol {\cdot } \boldsymbol {F})^{1}_{p,j,k}$ is the first component of
 $\text {adj}(J) \boldsymbol {\cdot } \boldsymbol {F}$ evaluated at the
 $p$th flux point. The relevant flux is computed using the reconstructed solutions at the flux points, namely,
 $\boldsymbol {U}_{f,j,k}$ from (A10). This reconstructed flux is only elementwise continuous, but discontinuous across cell interfaces. With regard to the interface contribution, a Riemann solver is employed to compute a common flux at the cell interface, to ensure conservation and stability. The flux is then made continuous by replacing the element interface fluxes
 $\boldsymbol {F}_{0,j,k}$ and
 $\boldsymbol {F}_{N,j,k}$ with the single-valued numerical interface flux given by the approximate solution of the interface Riemann problem. The computation of the derivative along
 $\hat {x}$ is finally computed in exactly the same way as in the one-dimensional case. Namely, given the interpolation of corrected fluxes
 $\tilde {\boldsymbol {G}}_{j,k}^{1}(\hat {x})$, the derivative of
 $\tilde {\boldsymbol {G}}_{j,k}^{1}(\hat {x})$ along
 $\hat {x}$ is computed simply by applying the derivative operator to (A13):
 \begin{equation} \frac{\partial{}}{\partial{\hat{x}}}(\tilde{\boldsymbol{G}}_{j,k}^{1}(\hat{x}) ) = \sum_{p=0}^{N}(\text{adj}(J) \boldsymbol{\cdot} \tilde{\boldsymbol{F}})^{1}_{p,j,k}\, \frac{\mathrm{d}{l^{f}_{p}(\hat{x})}}{\mathrm{d}{\hat{x}}}. \end{equation}
In a similar manner, the same procedure can be used to compute viscous fluxes where the interpolation to flux points is applied to first derivatives. In fact, after the computation of inviscid fluxes, the first derivatives of the conserved quantities are available at the solution points and the same strategy can start again, leading ultimately to the evaluation of the second derivatives at the solution points. As for the inviscid fluxes, a common numerical flux needs to be defined at the interface.
Appendix B. The shock-capturing method
In the main body of the paper the shock-capturing method has been introduced, focusing on the functional form of the bulk artificial viscosity and on the Ducros modification used in the present work. In this appendix a more thorough presentation of the shock-capturing methods is given, in particular regarding shock detection and model calibration.
In order to identify properly regions of the flows where artificial regularisation is required, the local level of smoothness of a given variable is determined by checking the rate of decay of the expansion coefficients, or modal coefficients, of the solution on an orthogonal basis. In particular, a popular choice, employed in the present implementation, is represented by the Legendre polynomials. A specific variable of interest, here denoted as  $\psi$, can then be written along a specific direction
 $\xi$ in space as
 \begin{equation} \psi(\xi) = \sum_{i=0}^{N-1}\hat{\psi}_{i}\,P_{i}^{*} (\xi), \end{equation}
where  $P_{i}^{*}$ is the normalised Legendre polynomial of degree
 $i$, and
 $\hat {\psi }_{i}$ are the modes of the chosen variable. The modes can be computed easily from the nodal values of the target variable using a simple matrix multiplication, i.e. using the Vandermonde matrix of the selected polynomial basis. In order to evaluate the smoothness of the spatial signal, the truncated expansion is introduced as
 \begin{equation} \bar{\psi} (\xi) = \sum_{i=0}^{N-2} \hat{\psi}_{i}\,P_{i}^{*} (\xi). \end{equation}
Consequently, a resolution indicator within the spectral element  $n$ can be evaluated comparing the energy content of the truncated and full expansion as
 \begin{equation} s_{{modal}}^{n} = \log_{10} \left[ \frac{(\psi-\bar{\psi},\psi-\bar{\psi})_{n}}{(\psi,\psi)_{n}}\right], \end{equation}
where  $(\cdot,\cdot )_{n}$ indicates the classical inner product within the element
 $n$. Once the smoothness indicator has been computed, the local magnitude of the artificial viscosity is modulated smoothly from
 $0$ to a maximum value
 $\varepsilon _{0}$ using an activation function
 $f(s_{{modal}}^{n})$ that is defined as
 \begin{equation} f(s_{{modal}}^{n}) = \begin{cases} 0, & \text{for } s_{{modal}}^{n}< s_{0}-l,\\ {\displaystyle \frac{\varepsilon_{0}}{2} \left\{1+\sin\left[\frac{{\rm \pi}(s_{{modal}}^{n}-s_{0})}{2l}\right]\right\}}, & \text{for } s_{0}-l \leq s_{{modal}}^{n} \leq s_{0}+l, \\ \varepsilon_{0}, & \text{for } s_{{modal}}^{n}>s_{0}+l, \end{cases} \end{equation}
where  $\varepsilon _{0} = C_{\varepsilon } \lambda _{{max}} h/N$, with
 $\lambda _{{max}}$ the maximum wave speed in the whole domain, and
 $h$ the element size. Finally, the elementwise constant value of bulk artificial viscosity is set simply as
 $\beta _{{AV}} = \rho \,f(s_{{modal}}^{n})$.
The rest of the undefined variables, namely,  $C_{\varepsilon }$,
 $l$ and
 $s_{0}$, are additional parameters of the model. With regard to the threshold
 $s_{0}$ and sensor tolerance
 $l$, these are computed via a self-calibration algorithm based on a manufactured solution (see also Lodato (Reference Lodato2019a) and Lodato et al. (Reference Lodato, Vervisch and Clavin2016) for additional details).
Appendix C. The positivity-preserving scheme
The adaptation of the positivity-preserving algorithm by Zhang & Shu (Reference Zhang and Shu2010) requires the positivity check on the density and pressure to be done at every Runge–Kutta step on the reconstructed solution at both the solution and flux points. The main relevant steps of the current implementation are summarised below (see also Lodato Reference Lodato2019a).
At each Runge–Kutta stage, let  $\boldsymbol {U}_{i,j,k}$ and
 $\bar {\boldsymbol {U}}$ be the spectral difference interpolation of the conserved variables at the solution points and the relevant average within the element, respectively. Also, let
 $\boldsymbol {U}_{i\pm 1/2,j,k}$,
 $\boldsymbol {U}_{i,j\pm 1/2,k}$ and
 $\boldsymbol {U}_{i,j,k\pm 1/2}$ be the reconstructed solutions at the flux points along the three directions, respectively. For simplicity, the solution vector at both solution and flux points is indicated as
 $\boldsymbol {U}_{\alpha }$, where
 $\alpha$ can be any triplet of indices related to the solution of flux points in the element. The minimum density
 $\rho _{{min}}= \min (\rho _{\alpha })$ among the values at both the solution and flux points is first obtained, and the coefficient
 $\theta _{1}$ is computed as
 \begin{equation} \theta_{1} = \min \left\{ 1 , \frac{\bar{\rho}- \epsilon}{\bar{\rho}-\rho_{{min}}} \right\}, \end{equation}
where  $\epsilon$ is a threshold value for the density (e.g.
 $\epsilon = 10^{-13}$). Then, at each solution and flux point, the density is recomputed as
 \begin{equation} \hat{\rho}_{\alpha} = \theta_{1} ( \rho_{\alpha} - \bar{\rho}) + \bar{\rho}. \end{equation}
The density values defined as such are used to evaluate the conserved variables  $\hat {\boldsymbol {U}}_{\alpha }$ at any solution or flux point within the element.
With regard to the pressure  $p_{\alpha } (\hat {\boldsymbol {U}}_{\alpha })$ at each solution and flux point, a coefficient
 $t^{\alpha }_{\epsilon } \in [0,1]$ is computed, such that
 \begin{equation} t^{\alpha}_{\epsilon} = 1 \quad \text{if } p_{\alpha} \geq \epsilon, \end{equation}
or  $t^{\alpha }_{\epsilon }$ is the solution of the equation
 \begin{equation} p_{\alpha}[ (1-t^{\alpha}_{\epsilon}) \bar{\boldsymbol{U}}+t^{\alpha}_{\epsilon} \hat{\boldsymbol{U}}] = \epsilon \quad \text{if } p_{\alpha}<\epsilon . \end{equation}
Notice that the above equation is quadratic in  $t^{\alpha }_{\epsilon }$ for an ideal gas, and can be solved analytically. Finally, the solution at the solution and flux points is recomputed as
 \begin{equation} \tilde{\boldsymbol{U}}_{\alpha} = \theta_{2} (\hat{\boldsymbol{U}}_{\alpha} -\bar{\boldsymbol{U}})+\bar{\boldsymbol{U}}, \end{equation}
where  $\theta _{2} = \min (t^{\alpha }_{\epsilon })$ is the smallest value of
 $t^{\alpha }_{\epsilon }$ obtained among the solution and flux points.