Bank notes satisfied the antebellum demand for small denomination, nonmetallic money, but at the same time, aggregate noteholder losses ranged from 2 to 5 percent per year and individual losses were as high as 60 percent.Footnote 1 Recent work by Stephen Mihm also documents the degree of counterfeiting that accompanied note issues.Footnote 2 If the quality of note issues were so variable, then why were they readily accepted? I propose that the secondary market reduced the real value of losses ex ante and allowed notes to circulate by pricing them based upon the issuer's default risk. Whereas previous studies have shown a connection between discounts and systematic risk, I test whether discounts also represented the default risk of individual notes.
Starting with the savings and loan crisis and continuing through the subprime mortgage crisis, the past decades have seen a renewed interest in determining whether the market monitors individual bank behavior. Gary Whalen, David Wheelock and Paul Wilson, and Paola Bongini, Stijn Claessens, and Giovanni Ferri show that riskiness can be monitored through balance sheet indicators such as return on equity, whereas Robert Avery, Terrence Belton, and Michael Goldberg, and Mark Flannery and Sorin Sorescu show that market prices respond to these indicators.Footnote 3 The Free Banking Period (1837–1862) offers a unique environment in which to test the market's ability to recognize price risk. Not only were there no federal bank regulations, but over 2,500 individual bank notes were priced by small local brokers. This article therefore considers the open question of whether the market can efficiently price bank risk without federal oversight and modern exchanges.
One of the first to systematically examine bank discounts, Gary Gorton argues that discounts responded to a bank's reputation.Footnote 4 He finds that recently established banks had an excess discount relative to existing banks. Howard Bodenhorn further shows that discounts increased up to two years before a bank defaulted, arguing that a high discount might have signaled an at-risk bank.Footnote 5 Drawing on studies of free bank default, I determine whether these patterns match the two most significant indicators of bank-specific risk: the market value of a bank's collateral assets and degree of portfolio diversification.
Arthur Rolnick and Warren Weber use depressed government bond prices to indicate default risk.Footnote 6 By design, free bank capital was invested in government debt to back note issues. A drop in bond prices depreciated the value of a bank's capital stock and note backing, but left the value of the notes unchanged. Andrew Economopoulos argues that free banks could have limited their exposure to falling bond prices through portfolio diversification.Footnote 7 Empirical tests by Matthew Jaremski show that banks were more likely to default when bond prices were low, but banks that diversified their assets with loans and limited the size of their circulations were more likely to remain solvent.Footnote 8 Discounts thus should have been higher during periods of low bond prices, and diversified banks should have had a lower risk premium.
To date, the lack of micro-level data has only allowed the empirical examination of systematic risk. Gorton focuses on state regulations and insurance programs, whereas Weber examines specie suspensions.Footnote 9 The publication of Weber's bank database, however, removes this constraint by providing the annual balance sheet of almost every bank.Footnote 10 Matching a bank's composition with redemption costs and note discounts in New York City (1837–1860) and Philadelphia (1837–1858), I construct a quarterly panel from which to measure the relationship between discounts and bank-specific default risk for 640 free banks.
The analysis indicates that the note discounts of banks that were in operation are related to those factors that increased the probability of default: specie suspensions, bond prices, and the share of loans to assets of the underlying bank. Alternatively, discounts after closure reflected the market value of a bank's bonds and the relative size of its note obligations and reserves. Even in the absence of modern regulations or reporting, discounts seemed to reflect the probability of default, thereby mitigating risk and increasing note demand in the secondary market.
BANK NOTES IN THE ANTEBELLUM UNITED STATES
Deposits during the antebellum period were not generally demandable or a high-debt priority.Footnote 11 States, therefore, gave banks the right to monetize their assets. By promising to pay the full value in specie whenever demanded, banks split large illiquid assets into smaller liquid ones. The notes were denominated in dollars and resembled modern paper currency. Each described the type of backing assets, as well as, the issuing bank's name and location for ease of use in transactions and redemption.
The requirements of early charter banks varied greatly over place and time. Some states developed insurance programs to limit losses, but participation was often not required in a bank's charter.Footnote 12 Starting in 1837, a series of free banking laws altered this trend by installing a well-defined set of requirements.Footnote 13 The laws required banks to purchase government debt as collateral for each note.Footnote 14 The bonds were then deposited with a state comptroller in exchange for an equal (or lesser) value of notes. If any redemption request went unmet, then the bonds were liquidated and used to redeem outstanding notes.
A merchant first had to take time to determine that a note was legitimate and then trust that it would be redeemed at face value when presented for repayment. Private note brokers alleviated these issues by identifying and purchasing notes at a percentage discount from their face value.Footnote 15 Similar to modern currency exchangers, brokers advertised the notes they were willing to buy and sell and their corresponding prices. As the number of notes and brokers grew, note reporters began to publish the prevailing discounts in a city as a periodical. Reporters also provided each note's originating location, physical description, and a description of any counterfeit notes. A merchant could thus verify a note's provenance and value by examining the reporter's description.Footnote 16
With at least two paper dollars for every dollar of specie in the money supply after 1840, bank defaults posed a significant problem for the economy.Footnote 17 As shown by Hugh Rockoff, Robert King, and Rolnick and Weber, aggregate losses ranged between 2 and 4 percent per year, but individual losses could be over 60 percent.Footnote 18 Philip Cagan suggests that the liquidity benefits of notes simply outweighed the losses; however, an efficient secondary market would also have reduced losses by appropriately discounting notes before default.Footnote 19 Those who received notes at par would still be exposed, but efficient discounts would have, at least, allowed them to use the notes outside of the bank's immediate area.
STYLIZED BANK NOTE DISCOUNT FACTS
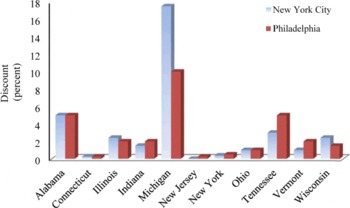
Figure 1 shows that discounts varied across states from zero in New York to 17 percent in Michigan but display the same tendencies across note reporters. Comparing reporters from Cincinnati, Cleveland, New York City, and Philadelphia, Gary Gorton and Laurence Ales, Francesca Carapella, Pricila Maziero, and Weber highlight several stylized discount facts.Footnote 20
1) “Local” bank notes almost always traded at par, because holders could easily demand payment from a local bank. As banks were required to redeem their notes at par, a local discount could only exist if the bank was closed or suspended. In the case of closed or suspended banks, the market value of the bank's assets and collateral should ultimately determine its discount.
MODAL BANK NOTE DISCOUNTS IN NEW YORK CITY AND PHILADELPHIA BY STATE (1837–1860)
Sources: Discount samples from Gorton and Weber, “Quoted Discounts;” and Weber, “Quoted Discounts.”

2) Most, but not all, “foreign” notes circulated at a discount. For example, Indiana notes were discounted in New York City (NYC) and Philadelphia, whereas NYC notes were not discounted in Philadelphia. Furthermore, foreign discounts varied across redemption locations. In terms of the example, Indiana notes had different discounts in NYC than Philadelphia.
3) Discounts were asymmetric across locations. If discounts were only a function of distance, then the discount of NYC notes in Cleveland should have been close to the same as the discount of Cleveland notes in NYC. However, this was not the case. Instead, NYC notes circulated around par in Cleveland, but Cleveland notes circulated at large discounts in NYC. As these differences were often significant, there seems to have been other aspects to note pricing.
4) Discounts in a state often revolved around a modal discount, but bank-level variation existed. Gorton shows that new banks received an excess discount, whereas Bodenhorn shows that banks that were about to close often received a high discount.Footnote 21 Note discounts were also highly variable during financial crises.
This article attempts to explain these stylized facts through an empirical analysis of bank risk. Previous studies have focused on a bank's location and a note's redemption costs, but these only explain the first two facts. If note discounters accounted for risk, then it could potentially explain the rest of the bank-level variation in discounts.
DATA
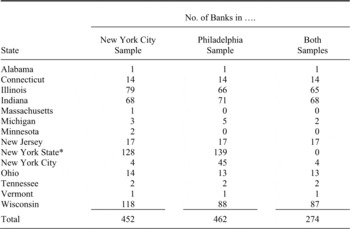
I examine the quarterly discount of bank notes traded in New York City (1837–1860) and Philadelphia (1837–1858).Footnote 22 Summarized in Table 1, the data made public by Gorton and Weber are the longest and most inclusive sample of bank notes available.Footnote 23 Discounts in Philadelphia come from Bicknell's Reporter and Van Court's Counterfeit Detector. Discounts in New York City come from the Shipping & Commercial List, New York Price Current, and Taylor's United States Money Reporter and Thompson's Bank Note and Commercial Reporter. Notes enter the sample around the date of first issue and exit when no longer traded. Discounts vary over time for a specific bank and from quarter to quarter between banks.
The discount samples contain charter bank notes, but I focus on free bank notes for two reasons. First, free banks were not subject to note insurance programs. As these programs virtually eliminated the note discounts of member banks, there is little to no variation in charter bank discounts to be empirically examined. Second, free banks within a state were subject to the same balance sheet and note requirements, whereas charter banks had unique requirements that varied within a state.Footnote 24 This within-state variation in charter banks makes balance sheet and note security comparisons difficult as they were constrained in unobservable ways.
COMPOSITION OF NOTE DISCOUNT SAMPLES

∗New York State only provides number of banks outside of New York City.
Notes:
Provides the number of unique banks in each note discount sample.
Sources:
Discount samples from Gorton and Weber, “Quoted Discounts;” and Weber, “Quoted Discounts.”
The New York City (NYC) sample consists of notes from 452 free banks and the Philadelphia sample consists of notes from 462 banks.Footnote 25 The NYC sample is slightly smaller because reporters published few local notes and Pennsylvania had no free banks before 1860. As seen in Table 1, the NYC sample contains more non-New York notes than the Philadelphia sample. I thus estimate regressions on the two samples separately to compare how discounts varied across locations.
Weber's antebellum databases contain the annual balance sheet of almost every free bank, but I must make an assumption before matching them with the quarterly discounts.Footnote 26 Namely, I assume that it took note reporters a quarter to update their discounts in response to a new balance sheet examination. Publications were required by law, but there was an initial delay between when the bank examined its balance sheet and when it was published in a periodical. For example, balance sheets examined in December often were not published until the following March edition of Merchant's Magazine. Once public, there was another delay as brokers updated their prices using the new information. These delays would have led to at least a quarter lag from the examination date until the updated discounts were published in a note reporter.Footnote 27 Each quarterly note discount is thus linked to the balance sheet available in the previous quarter. The process provides a filling mechanism between publications, and the lag ensures that a bank's composition was exogenous to changes in discounts.
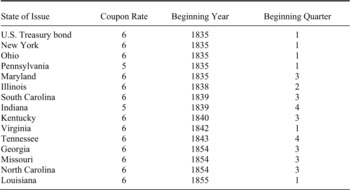
I also construct a contemporaneous bond price index to control for the economic conditions each quarter. The balance sheets do not contain the type of bonds held by a bank, and the index is defined as the average quarterly price of bonds allowed by each state's law.Footnote 28 Most states allowed any type of state or national debt to back notes, whereas some constrained banks to specific bonds. The index in unconstrained states is the unweighted average price of the 16 state bonds and one U.S. Treasury bond summarized in Table 2, whereas the index in constrained states is the unweighted average price of allowed bonds. The index in Ohio is the price of its own state bond, whereas the index in Alabama and New Jersey is the price of a Treasury bond.Footnote 29 Due to a law change, the index in New York is the average price of all bonds before 1842 and a New York bond thereafter. The index thus takes into account the fact that certain banks held more secure bonds by law.
Because bank notes had to be physically returned to the issuing bank, a passenger travel cost index developed by Jaremski is used to account for each note's redemption cost.Footnote 30 The index uses a hub-and-spoke network to estimate the travel cost from New York City and Philadelphia to each bank location. Each hub is a central city to which the travel costs from New York City and Philadelphia are known with certainty in 1836, 1849, 1856, or 1859, whereas the spokes are typically smaller locations to which the costs are unknown. An estimate of travel cost to each bank is then generated by minimizing the cost of traveling there either directly or indirectly through a hub. I then fill the missing years with a linear trend.
BOND PRICES USED IN AVERAGE

Notes:
This table lists the state bonds that were used to make up the bond price average.
Sources:
Prices were collected from Merchant's Magazine and Commercial Review or Banker's Magazine, Dwyer, Hafer, and Weber (“Weekly U.S. and State Bond Prices”), and Sylla, Wilson, and Wright (“Security Prices”).
The combination of data provides 15,998 quarterly observations from 640 free banks located in 376 cities. Each observation contains a bank's lagged balance sheet, its quarterly note discount in New York City and Philadelphia, the travel cost to return its notes, as well as, the prevailing market price of its allowable bonds.
EXAMINING THE DETERMINANTS OF INDIVIDUAL NOTE DISCOUNTS
Each period, a noteholder could decide whether to use the note at a discount or return the note to the issuing bank for its full face value. Using this logic, Gorton constructs a cash-in-advance model, whereas Weber models a note arbitrageur.Footnote 31 The same basic implications emerge from either model. Each bank note should be priced by its net expected redemption value. First, a note's discount should be positively correlated with the cost it takes to redeem; thus, we should see higher discounts for notes from banks located farther away. Second, a note's discount should be positively correlated with the probability that it will not be redeemed by the issuing bank.
The systematic risk factors considered in the above studies, such as insurance programs and specie suspensions, should affect all banks involved similarly. However, as stated by their models, efficient discounts must be bank-specific in order to match default risk. If after accounting for redemption cost, a risky bank's notes are priced at the state average, then the market was not efficient. I therefore examine the correlation between discounts, travel costs, and default risk at the appropriate level.
Redemption Costs
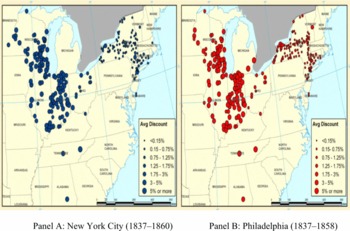
Figures 2A and 2B map the discount of each bank note location. Each dot represents a bank location, whereas its size denotes the location's average discount in New York City or Philadelphia. The samples’ different banks cannot be compared against each other, but the same pattern emerges across both panels. Discounts increase with distance, but the relationship is not one-to-one or linear. For instance, New York notes circulated around par and Indiana notes did not, but some Indiana notes have greater discounts than those from Wisconsin even though they had smaller redemption costs. Discounts were thus generally higher for notes from banks in more distant states, but distance does not explain all of the geographical variation in discounts.
Default Risk
The data allow the examination of three types of default risk: specie suspensions account for systematic risk, falling bond prices account for state-specific risk, and undiversified balance sheets account for bank-specific risk. With the exception of missing information on “Management quality” and “Earnings,” these default risk measures also correspond to the CAMELS ratings used to measure modern bank quality. Capital and reserves respectively measure “Capital adequacy” and “Liquidity,” whereas specie suspensions and bond prices measure “Sensitivity to market risk.” Due to their high return and short maturity, loans are a crude measure of “Asset quality.”
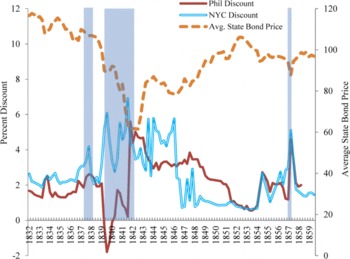
Specie suspensions relieved banks of their redemption requirements without forcing closure and should have led to higher discounts. As seen in Figure 3, discounts doubled during each of the three shaded suspension periods: May 1837–Aug. 1838, Oct. 1839–June 1842, and late 1857. The only exception comes during the incomplete suspension of 1839. As New York City banks continued to fully redeem notes during the period, their notes traded at a premium, while all suspended bank notes had a much larger discount.Footnote 32 The Philadelphia sample's average discount is thus negative during 1839 and 1840 because of its large number of NYC notes.
AVERAGE DISCOUNT IN NEW YORK CITY AND PHILADELPHIA

Rolnick and Weber's falling asset price hypothesis posits that free banks were more likely to default when bond prices were low.Footnote 33 As notes were backed by government debt, a bond price decline signaled a bank's collateral was insufficient to redeem its notes in the short run and often resulted in a bank run. Knowing their collateral was worth less than their notes in circulation, banks often refused to redeem their notes and forfeited their collateral rather than take capital losses. Discounts therefore needed to be high during periods of low bond prices to compensate for the depreciated backing and increased probability of default. Figure 3 shows that note discounts were at their highest when bond prices were at their lowest.
NOTE DISCOUNTS VS. BOND PRICES (1832–1860)

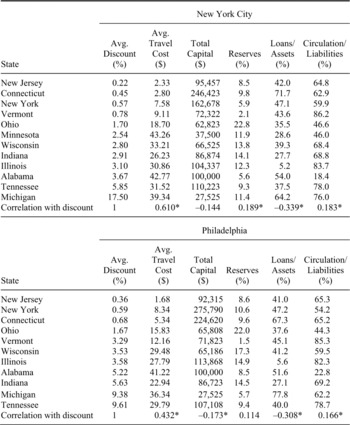
While bond price depressions were largely exogenous, banks could have diversified their asset and liability portfolios in order to remain solvent. Economopoulos and Jaremski find that free banks with small proportions of note circulations and large proportions of loans were less likely to default.Footnote 34 Bodenhorn shows that loans were typically short-term with maturities of 3–6 months, whereas John Wallis, Richard Sylla, and Arthur Grinath show that state bond returns were particularly volatile and state bonds were prone to default.Footnote 35 Loan rates (6 percent) were also similar to bond yields (5 percent) signaling that banks with large loans portfolios could avoid bank runs without sacrificing revenue.Footnote 36 Because they faced a lower probability of default, banks with diversified portfolios should have had lower note discounts. To examine this relationship, Table 3 provides the average balance sheet in each state as well as each item's correlation with discounts. By looking at the last row in each panel, we gain a rough idea of whether bank fundamentals mattered to note discounters. The stronger a balance sheet item's correlation with discounts, the more likely that note brokers used it to set their prices. As discounts are significantly correlated with a bank's proportions of loans and circulation in both samples, discounts seem to reflect those factors that are associated with bank-level default risk.
ECONOMETRIC ANALYSIS
Similar to studies of modern bank subordinated debt, I estimate note discounts using a linear model.Footnote 37 Each observation is a bank-quarter allowing identification across differences between banks within each time period. The dependent variable is the percentage on a note from bank i in period t. There are several explanatory variables: measures redemption costs from bank i's location to the redemption city in quarter t; is a dummy variable that captures the effect of specie suspensions; is defined as the average quarterly price of allowed bonds and captures falling asset prices; captures capital adequacy; is defined as the ratio of loans to assets and captures asset quality; is defined as the ratio of specie to liabilities and captures liquidity, and is defined as the ratio of circulation to liabilities and captures the size of a bank's note issue. The general model is where denotes the random effects by bankFootnote 38, denotes the error term, and is a vector of control variables. The control variables included but not reported are the number of years a bank has been in operation and fixed effects for each quarter. Standard errors are clustered by state to account for serial correlation within each state.Footnote 39
COMPARISON OF FREE BANK BALANCE SHEETS AND DISCOUNTS

∗denotes significance at the 1 percent level.
Notes:
Entries contain the balance sheet of the average bank for each state. For the sake of the average and correlation, each bank was only counted once. The average discount of each state is only calculated when the underlying bank was open.
Sources:
Discount samples from Gorton and Weber, “Quoted Discounts;” and Weber, “Quoted Discounts.” Balance sheet information obtained from Weber, “Balance Sheets.”
![\[
\begin{array}{c}
\mathrm{E}\left[d_{i,\thinspace r},\Bar{\varepsilon }_{i,t} \right]=\thinspace \mathrm{E}\left[s_{i,r},\Bar{\varepsilon }_{i,t} \right]=\mathrm{E}\left[p_{i,r},\Bar{\varepsilon }_{i,t} \right]=0\thinspace \thinspace \thinspace \thinspace \thinspace \thinspace \thinspace \mathrm{r}<\left(\mathrm{t-1} \right)\thinspace
\end{array}
\](https://static.cambridge.org/binary/version/id/urn:cambridge.org:id:binary-alt:20160922040455-04780-mediumThumb-S0022050711002208_eqn1.jpg?pub-status=live)
The regressions are estimated with and without state-fixed effects. When included, these effects account for factors common to all banks within a state but vary across states, such as relative population or regulatory enforcement. They are also useful when comparing balance sheets. The inclusion of state effects means that the effect of travel cost on discounts is determined by deviations of the costs between the bank and the redemption city within each state and over time.
Using Weber's dates of operation, I separate the note discounts of “open” banks that were in operation during the quarter from “closed” banks that had ceased operation.Footnote 40 Theoretically, the nature of default risk changes when a bank closed, as the market value of assets becomes more important and predictors of closure become less important. For instance, the high return on loans decreases the probability of a bank closing, but once closed, sudden loan liquidation might cause additional noteholder losses. Empirically, a bank's note discount often substantially increased when it ceased operation. If this increase was the result of asset value or bankruptcy information, then a combined regression would bias the model's coefficients. I therefore run separate regressions for open and closed banks to make the coefficients easier to interpret.
Determinants of Note Discounts When Open
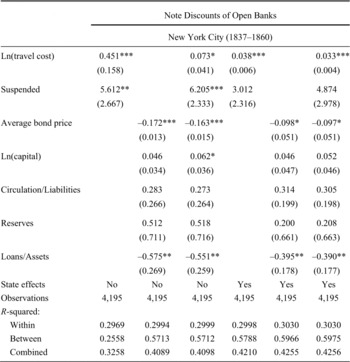
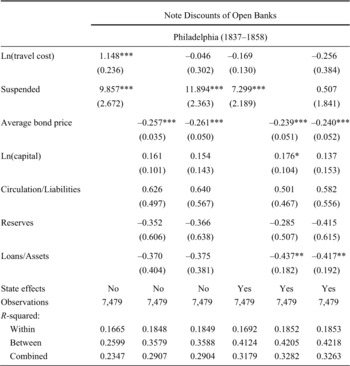
Tables 4A and 4B present the estimated model of discounts when banks were open. The tables are divided into two sets of specifications based on whether state-fixed effects are included. The first specification of each set isolates the effect of travel costs and specie suspensions, the second isolates default risk, and the third combines the explanatory variables into a single model.
DETERMINANTS OF NOTE DISCOUNTS WHILE FREE BANK WAS OPEN

∗denotes significance at the 10 percent level.
∗∗denotes significance at the 5 percent level.
∗∗∗denotes significance at the 1 percent level.
Notes:
Linear panel regression with random effects taking the bank's note discount as the dependent variable. Only discounts of banks that were currently in operation were used. All regressions include quarter-year effects and the cumulative number of years a bank was open. Standard errors are provided in parentheses and clustered by state.
Sources:
Discount samples from Gorton and Weber, “Quoted Discounts,” and Weber, “Quoted Discounts.” Balance sheet information obtained from Weber, “Balance Sheets.” Travel costs from Jaremski, “Antebellum Passenger Costs.” Construction of bond price index described in the text.

Redemption costs were generally positively correlated with discounts; however, their effect is greatly reduced when bank risk characteristics are included in the regression. For every 10 percent decrease in the cost of travel from New York City, a note's percent discount would decline by 0.045 without accounting for default risk but only by 0.007 when measures of default risk are included in the model. Travel costs, therefore, are a determinant of note discounts, but the initial size of the travel cost coefficients when the asset quality variables are not included seems to be due to omitted variable bias related to the asset problems of risky frontier banks.Footnote 41
The coefficient on specie suspensions is positive and generally statistically significant. A suspension increased every banknote's percent discount by 4 to 12 percent. Matching Figure 3, the effect is also economically large relative to the average note discount of 2 percent.
The bond price index is negative and statistically significantly correlated with note discounts. For a $10 decrease in bond prices, discounts were higher by 1 percentage point in New York City and 2.4 percentage points in Philadelphia. The relationship does not seem to be the result of financial panics, as the coefficient remains large when the suspension dummy is included in the model.
Despite being associated with the probability of default, the coefficient on the ratio of circulation to liabilities is economically but not statistically significant. A bank that raised its circulation ratio by 10 percentage points would have experienced a 0.03 to 0.06 percentage point higher discount. The large standard errors might be the result of large circulations being available to be shipped together. For instance, brokers might only pay the fixed redemption cost when they collected a large number of notes. Weber suggests this potential for economies of scale in note return lowers the redemption cost per note or per dollar and compensates note brokers for some risk.Footnote 42 The economies of scale argument, however, can only be taken so far, as the return of a large number of notes would stretch a bank's ability to redeem and could cause default.
The ratio of loans to assets always has a statistically significant negative correlation with discounts. A bank that raised its loan portfolio by 10 percentage points would experience a 0.03 to 0.05 percentage point lower discount. Because of their short maturity and high rate of return, banks could diversify their portfolios against bond price declines using loans. The presence of loans therefore might have been a way for brokers to identify a bank's profitability and capacity to avoid bank runs.
Note discounts are uncorrelated with a bank's capital size and reserves. The coefficient on reserves even changes sign in the New York sample. As shown by Jaremski, these balance sheets items were also uncorrelated with a free bank's probability of default.Footnote 43 Discounts on the notes of open banks thus seem to have been more closely related to travel costs and default risk rather than modern security conventions.
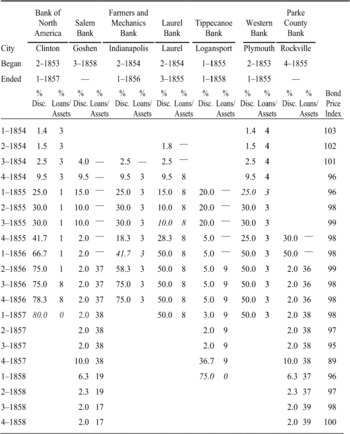
Even though note discounters might have approached solvent notes in a state the same way, discounters seemed to have used bank fundamentals to adjust the statewide discount for individual risky banks. To illustrate the use of bank-level information, Table 5 contains the note discounts of seven Indiana banks. Several interesting points emerge from the table. First, the notes of open banks had the same discount for most of 1856/57. Second, new banks received an excess discount before a balance sheet was published.Footnote 44 For instance, the Tippecanoe Bank started with a 10 to 20 percentage point higher discount than other banks, but the excess discount disappeared as soon as the bank published a balance sheet. Third, banks with lower proportions of loans had higher discounts, and discounts were uniformly higher when bond prices fell at the end of 1854 and 1857. Finally, discounts often increased just prior to a bank's closing, suggesting that note brokers identified risky banks before they closed.Footnote 45
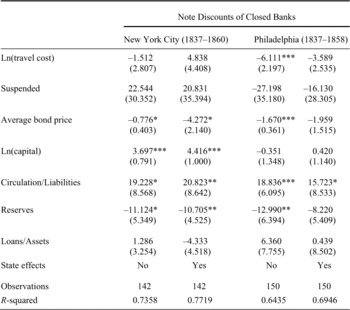
Determinants of Note Discounts When Closed
As seen in Table 5, discounts dramatically increased when a bank closed and often continued to rise over time. These changes could have been the result of brokers applying rules of thumb due to the lack of reliable information and readjustments were made once information became available. To avoid identifying the coefficients based on the initial assessment, I average the discounts of each bank after it was closed. The regression thus focuses on the underlying discount of the closed bank rather than missing information.
Travel costs and specie suspensions are no longer robustly correlated with note discounts in Table 6. The coefficients are large but change signs depending on the specification. The insignificance of travel costs is likely caused by the fact that a note holder had a year to redeem the note at the state representative's office. Redemption, therefore, was not immediate and the cost of travel to redeem the note would have been to the state capital not to the bank itself.
EXAMINING THE REGRESSION RESULTS USING THE DISCOUNTS OF INDIANA BANKS

Notes:
Table provides the note discounts for seven Indiana banks. The closing quarter has been italicized. Dates before a balance sheet was published have been marked by “—.”
Sources:
Discount samples from Gorton and Weber, “Quoted Discounts,” and Weber, “Quoted Discounts.” Balance sheet information obtained from Weber, “Balance Sheets.” Construction of bond price index described in the text.
Upon closure, the bonds used to back notes were liquidated along with bonds held on the balance sheet. The current market price of bonds thus determined the size of liquidation losses. The negative and statistically significant sign of the coefficient on bond prices reflects this relationship. For instance, a 10 dollar decline in bond prices caused discounts to increase by at least 7.7 percentage points. Discounts were low when bond prices were high and banks were more likely to fully redeem their notes.
DETERMINANTS OF NOTE DISCOUNTS WHILE FREE BANK WAS CLOSED

∗ denotes significance at the 10 percent.
∗∗ denotes significance at the 5 percent level.
∗∗∗ denotes significance at the 1 percent level.
Notes:
Linear panel regression taking the average bank's note discount when they were closed as a dependent variable. Different columns represent the present of state-fixed effects of discount sample used. All regressions include time (quarter-year) effects, and the cumulative number of years a bank was open. Standard errors are provided in parentheses and clustered by state.
Sources:
Discount samples are from Gorton and Weber, “Quoted Discounts,” and Weber, “Quoted Discounts.” Balance sheet information obtained from Weber, “Balance Sheets.” Travel costs are from Jaremski, “Antebellum Passenger Costs.” Construction of bond price index is described in the text.
The ratio of circulation to liabilities is correlated with discounts for closed banks, whereas the ratio of loans to assets is not correlated. The different relationships for open and closed banks seem to have been the result of differences in the note redemption process. The relatively small and insignificant coefficient of the loan to asset ratio suggests that the redemption process might have provided enough time for some short-term loans to come due. On the other hand, the ratio of circulation to liabilities represented the ability of a bank to pay back their note holders. Regardless of economies of scale in note redemption, the more circulation, the less likely a bank would have been able to redeem its notes and the larger its discount needed to have been. The significant impact on discounts of a non-depreciating asset, such as specie, provides additional evidence for this interpretation.
The note discounts of closed free banks differed significantly from those of open ones. Specifically, discounts of notes from closed banks seem to capture the degree that a bank was able to repay its debts. Banks with large obligations due to greater note circulation and with low prices for the bonds backing their notes were less likely to fully redeem their notes; therefore, notes from those banks were discounted more.
CONCLUSION
The patterns of discounting of bank notes are consistent with a market in which noteholders monitored the risky behavior of antebellum banks despite significant travel costs, informational asymmetries, and limited government involvement. The secondary market priced bank notes according to their redemption costs and default risk. Because the effect of travel costs is small relative to default risk factors, the results suggest that systematic risk in the form of specie suspensions and idiosyncratic risk determined by falling bond prices and a bank's proportion of loans were the primary determinants of discounts.
For both open and closed banks, the discounts on notes were higher when the prices of bonds backing the notes were lower. On other dimensions, however, the market discounted the notes of open and closed banks differently. Open bank note discounts were sensitive to a bank's loan portfolio but not the extent of its note circulation. Closed bank discounts, on the other hand, were larger when there were more notes in circulation. Note discounts before closure thus corresponded to the probability that a bank would default, but after closure, they corresponded to the degree that a bank could repay its debt.
State-level regulation and legal structures also play a significant role in note pricing. For instance, the tight security provisions of New York led to lower note discounts even after accounting for travel costs. Moreover, bank notes from states with high reserve requirements, like Ohio, had a lower discount, whereas notes from states with double stockholder liability, as in Illinois and Minnesota, did not. Brokers thus seemed to group notes together based on the regulations in the bank of origin's state, but then used bank fundamentals to adjust those discounts to account for idiosyncratic risk.
The analysis provides a reason why risky bank notes were accepted in the antebellum economy. The benefits of notes did not simply outweigh nominal losses, rather the secondary market discounts mitigated the value of those losses. Individuals who received notes at par still faced risk of note loss, but discounting would have allowed the notes to circulate beyond the issuing bank. The process thus might have made bank notes the most liquid currencies of the period as reliable gold coins were relatively limited before 1860.Footnote 46
Appendix
Travel Cost Index
The travel data from Philadelphia and NYC to each note location comes from work by Matthew Jaremski.Footnote 47 The index takes the historical travel costs to transportation hubs and extrapolates the unknown costs to other cities using a hub-and-spoke network. This semiparametric approach eliminates some of the measurement error associated with straight distance estimates by incorporating the availability of railroad or canal transportation. Data for 1836 and 1849 come from Gorton's summary of Disturnell's A Guide Between Washington, Philadelphia, etc., whereas 1856 and 1859 come directly from Appletons’ Railway and Steam Navigation Guide.Footnote 48 Corresponding to the expansion of railroad, river, and canal lines, the number of hubs obtained increases over time: 44 in 1836, 52 in 1849, 124 in 1856, and 132 in 1859.
The hub-and-spoke network uses the Haversine formula to obtain the distance in miles on a sphere between each hub-spoke pair. These distances are then converted into the passenger costs by multiplying it by the stagecoach cost estimates. The assumed passenger-mile rate was 7.5 cents in 1836, 6.5 cents in 1849, and 6 cents in 1856–1859. Finally, the travel costs to each city are obtained by adding this estimated cost of each hub-spoke pair to the hub's travel costs to NYC and Philadelphia. Because the destination cities are also hubs with a zero travel costs, this process calculates both the direct travel to a city and as well as every indirect path through a hub. By comparing all possible routes, the network selects the minimum cost of travel to each city.Footnote 49 Finally, the travel costs in between 1836, 1849, 1856, and 1859 were filled with a linear trend.