I. INTRODUCTION
Indentation testing is a widely recognized method to investigate the fundamental mechanical materials properties, such as the hardness, Young’s modulus, and/or Poisson’s ratio.Reference Oliver and Pharr1 This method has many other potential applications in diverse fields, e.g., investigation of phase transformations,Reference Ge, Domnich and Gogotsi2, Reference Gassilloud, Ballif, Gasser, Bürki and Michler3 thin film delamination,Reference Demarecaux, Chicot and Lesage4 and/or cleavage of materials.Reference Lawn5, Reference Wasmer, Ballif, Gassilloud, Pouvreau, Rabe, Michler, Breguet, Solletti, Karimi and Schulz6 Thus, indentation mechanics is extensively described in several text books.Reference Johnson7, Reference Hill8 Most scientists agree that, in III-V semiconductors, the nucleation of dislocations, also called the elastic–plastic transition, is associated with the pop-in in the load–displacement curve in nanoindentation.Reference Leipner, Lorenz, Zeckzer, Lei and Grau9–Reference Bradby, Williams, Wong-Leung, Kucheyev, Swain and Munroe12 Some authorsReference Page, Oliver and McHargue13, Reference Patriarche and Le Bourhis14 found that, for InP, pop-in event is statistical and is related to a low density of native defects. The fact that plastic deformation can occur even without pop-in was explained via the difference in doping that dramatically changes the pathway to plastic deformation.Reference Patriarche and Le Bourhis14 In contrast, Almeida et al.Reference Almeida, Prioli and Ponce15 found that the native oxide on InP epitaxial layer grown on semi-insulating InP (001) wafers leads to an overestimation of the mean contact pressure required for the initial plastic deformation. Mann and PethicaReference Mann and Pethica16, Reference Mann and Pethica17 showed that, for GaAs, the approach velocity and the nanometric-size surface asperities play a vital role on the initial contact stiffness and the yield point. Hence, taking into account nanometric surface inhomogeneities and small impact during the initial contact, some dislocation lines may be generated even at loads close to zero. Such dislocations might not be stable after unloading unless they have multiplied or pinned in some ways.Reference Mann and Pethica17 In contrast to nanoindentation, very little fundamental studies have been performed on nanoscratching, a technique mainly used to investigate delamination of layered materials,Reference Huang, Lu and Xu18 tribological contacts,Reference Bhushan19 or deformation and cracking processes.Reference Ponce, Wei, Wu, Fonseca-Filho, Almeida, Prioli and Cherns20–Reference Parlinska-Wojtan, Wasmer, Tharian and Michler23 The nanoscratching technique is commonly viewed as a test, which generates many incontrollable defects such as cracks and particles generation at the surface (ductile chips, brittle chips).Reference Domnich and Gogotsi24, Reference Gogotsi, Zhou, Ku and Cetinkunt25 When controlled, scratching can be used to generate a starter crack for ensuing cleavage of semiconductors.Reference Wasmer, Ballif, Pouvreau, Schulz and Michler26, Reference Wasmer, Ballif, Pouvreau, Schulz and Michler27 In the last years, the nanoscratching has found a renewal of interest in patterning techniques since it was recently proved that highly selective dissolution could be obtained on n-InP surfaces scratched with well-controlled loads as low as a few micro-Newtons.Reference Michler, Gassilloud, Gasser, Santinacci and Schmuki28, Reference Gassilloud, Michler, Ballif, Gasser and Schmuki29 Moreover, transmission electron microscopy (TEM) investigation showed that, even at this low force scale, dislocations were generated under the tip and that a few dislocations were sufficient to trigger local electrochemical dissolution. These findings allowed the development of an easy and rapid method to reveal the dislocation field inside a damaged area on InP surfaces with a classical electrochemical setup.Reference Gassilloud, Michler, Ballif, Gasser and Schmuki29
In this work, the nucleation of dislocation during nanoindentation and nanoscratching is investigated via contact mechanics. Several nanoindentations and nanoscratches were realized at various micro-Newton loads on InP surfaces using a characterized diamond tip. The resulting patterns were dissolved by electrochemical etching. In parallel, indentation tests were conducted to determine the transition load at which pop-in events occur. Loads required to create the first dislocations were determined for indentation and scratching tests. These indentation results will be compared to pop-in events. These experimental threshold values were implemented in a contact mechanics model that computes the distribution of the maximum shear stress under the tip. The modeling is based on the elastic equation set written by Hanson and Johnson,Reference Hanson30, Reference Hanson and Johnson31 which computes the elastic field of a spherical Hertzian contact and includes sliding friction to study the scratching process. The application of this model requires an accurate knowledge of the tip radius used. This tip radius was accurately measured using two different methods: (i) by direct imaging of the tip topography using an atomic force microscope (AFM), and (ii) by fitting the experimental load–penetration curve of several indentations with the theoretical equation of surface deformation of an elastic body under contact loading. The experimental results in conjunction with the theory show that the load required to generate systematically the first dislocations on InP(100) surface is half in scratching than in indentation. The indentation results show that in some experiments, (below 2 mN), dislocation nucleation happens statistically without a pop-in event. Additionally, this investigation suggests that dislocations nucleate first at the surface and then propagate inside the bulk, which can be an explanation for the so-called pop-in effect in InP indentation.Reference Bradby, Williams and Wong-Leung10–Reference Bradby, Williams, Wong-Leung, Kucheyev, Swain and Munroe12, Reference Le Bourhis and Patriarche32 Finally, in opposition to the general beliefs (scratching tests create too many damages), we prove in this article that scratching is a suitable method to control dislocation nucleation inside a crystalline material.
II. EXPERIMENTAL
Nanoindentation and nanoscratching experiments were performed with a MTS Nano-Indenter XP (NanoXP from MTS, MTS Systems Corporation, Eden Prairie, MN). This apparatus is equipped with a lateral force measurement option for scratch experiments. To minimize the influence of the native oxide layer (2–3 nm), it was decided to use ideally a spherical tip with a large radius (three orders of magnitude higher than the oxide thickness). Hence, the experiments were carried out with a Berkovich diamond tip (three sides with a semiapex angle of 65.3°)Reference Fischer-Cripp33. This tip was chosen since, after hundred scratches on various semiconductors such as Si, GaAs, and InP, the tip radius had become a pseudoperfect spherical tip up to a depth of 40 nm. The tip radius was estimated via two methods: (i) atomic force microscopy and (ii) using elastic indentation in conjunction with Hertz equations,Reference Johnson7, Reference Hanson30, Reference Hanson and Johnson31 and radii of 2.4 and 2.7 μm were determined up to a depth of 40 nm.
For all experiments, polished n-type InP{100} wafers were used, with sulfur doping (n ∼ 3 × 10¹⁸ to 8 × 1018 cm−3) and a dislocation density ≤1000 cm−2. The surface roughness Rz of the InP wafer was smaller than 2 nm. The Young’s modulus of InP was determined by performing 20 indentations at a 50 mN load on the (100) plane.Reference Oliver and Pharr1 The indentation test results on the (100) plane yielded a Young’s modulus of 95.37 GPa and confirmed, within the measurement uncertainty, the literature value.Reference Nicholz, Rimai and Sladek34 This value was used for all calculations, together with a Poisson’s ratio of ν = 0.36.Reference Adachi35 It is well recognized that the glide planes are {111} and the glide directions are <110> leading to a 2-fold symmetry, the so-called rosette arm patterns.Reference Leipner, Lorenz, Zeckzer, Lei and Grau9, Reference Patriarche and Le Bourhis14, Reference Le Bourhis and Patriarche32, Reference Le Bouhris36 This rosette arm was observed parallel to the [110] direction and the other one parallel to the orthogonal [ 10]. It is known that α-dislocations are along the [110] direction, whereas β-dislocations are along [
 10] and α-dislocations are faster than β-dislocations.Reference Le Bouhris36
To determine the load required to nucleate the first dislocations in indentation, 80 indents from 0.25 to 4 mN by step of 0.25 mN with a constant loading rate of 62.5 μN/s were performed. These indents were subsequently dissolved by electrochemical etching in 1M HCl so that the dislocation field was revealed at the surface. To establish at which load pop-in events take place, 100 indents were done from 1 to 20 mN with a step of 1 mN and a constant loading rate of 200 μN/s giving a strain rate close to the scratching experiment ( ∼ 1–4 s−1). To evaluate the load at which dislocations nucleation occur during the scratching of InP surface, 15 scratches were carried out by raising the load along the scratch direction from 0 to 2 mN with a velocity between 1 and 5 μm/s. The grooves were obtained by scratching in the <110> direction on the InP surface. The edge of the pyramidal Berkovich tip was oriented in the scratch direction. The grooves were then subsequently dissolved in 1 M HCl for dislocation field revelation.
For electrochemical setup, a back contact electrode to the InP was established by smearing an indium–gallium eutectic on the backside of the samples. The samples were then pressed against a nitrile O-ring of an electrochemical cell leaving a surface of 0.29 cm2 exposed to the electrolyte. The dissolution experiments were performed at a constant voltage of 600 mV during 60 s with an Autolab model PGSTAT30 potentiostat/galvanostat and a conventional three electrode setup using a silver/silver chloride electrode (Ag/AgCl, C = 236.3 mV versus the standard hydrogen electrode) as reference electrode together with a platinum counter electrode. Scanning electron microscopy (SEM) micrographs were taken under a Zeiss DSM 962 (Carl Zeiss International, Oberkochen, Germany) operating at 15 kV leading to a resolution limit of 10 nm. A detailed characterization of the tip topography as well as a scratch were performed by AFM in noncontact mode using a Topometrix Explorer (TopoMetrix Explorer, Santa Clara, CA, USA) instrument with a linearized scanner head and loop controlled to keep the distance tip-sample constant. The AFM is placed on a vibration-isolated table mounted with four springs in a frame. The measurement are carried out with a pyramidal silicon-nitride tip (Topometrix SFM-Probes, Ref 1520-00) coated with a reflective coating of gold/chromium. The tip radius was given of approximately 100 nm and a top angle of 90°. The cantilever used had a V-shape with an arm length of 600 μm and a thickness of 600 nm. The measurement of the diamond tip was simply performed by installing the tip upside down in a homemade sample holder.
III. RESULTS
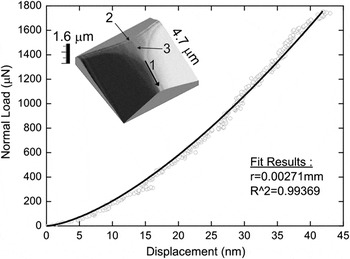
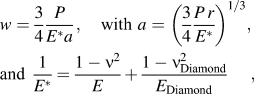
For a rigid contact analysis, the exact tip radius is required. To achieve this, two independent methods were used to evaluate the tip radius. First, five purely elastic indentations (confirmed via electrochemical etching) were performed at a force of up to 1.75 mN with a loading rate of 25 μN/s. Figure 1 shows the averaged load–penetration curve of these indentations on InP, as well as the fit of the surface deformation (w) from the Hertz equationsReference Johnson7, Reference Hanson30, Reference Hanson and Johnson31:
Average load–penetration curve of elastic indentations on indium phosphide. The fit of the normal deformation (w) of the surface gives a tip radius of 2.7 μm. In insert, atomic force microscopy (AFM) image of the Berkovich tip. Arrow 1 indicates the scratching orientation. The arrow 2 shows the transition edge between the rounded top and the back plane of the Berkovich tip. Arrow 3 points at wear lines formed during the repeated scratching experiments.

where P is the load, r the tip radius, and (E, ν) and (E Diamond, ν Diamond) the Young’s modulus and the Poisson’s ratio of InP and diamond, respectively. For diamond, the values were taken from the literature with E Diamond = 1,143 GPaReference Hess37 and ν Diamond = 0.07.Reference Simmons and Wang38 From the fit of Eq. (1), a radius of 2.7 μm for the diamond tip was determined. Second, the insert in Fig. 1 shows a detailed image of the tip topography measured by AFM. This three-dimensional (3D) illustration confirmed that the top of the Berkovich tip is spherical and the three planes are also visible. In the inserted figure, the arrow 1 indicates the edge used for scratching. The arrow 2 shows the transition edge between the rounded top and the back plane of the Berkovich tip. Wear lines are perceptible (arrow 3) that were formed during the repeated scratching experiments. By extracting three profiles from a line lying along each edge of the Berkovich tip, the tip radius was evaluated to be 2.4 μm by extracting the surface from the top of the tip down to approximately 40 nm (which correspond to the depth reached from the elastic indentation of Fig. 1). An identical analysis was performed at the end of our experiments and no changes could be identified. Considering the ambiguities in the tip radius, both radii values will be used for calculation of the critical shear stresses given in Table I.
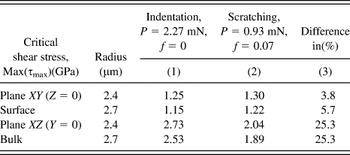
Comparison between indentation and scratching using the Hanson’s model for the different tip radii measured.

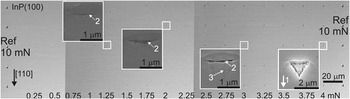
Figure 2 shows an optical micrograph of an array of 80 indents revealed by electrochemical etching. At the left and right borders of the optical image, a row of five reference indents with a load of 10 mN were carried out to delimit the indentation zone. Between both reference rows, indentation rows containing five indents were performed by increasing the loads from the left (0.25 mN) to the right (4 mN) by steps of 0.25 mN. Inspection of Fig. 2 indicates that the optical image can be divided into three regions. They are (i) loads below 0.75 mN, no dissolved indents appear; (ii) between 1 and 2.25 mN, some indents appear stochastically; and (iii) above 2.5 mN, all indents are revealed. It is noticed that at a load of 3.25 mN, one indent is not visible in the middle of the row, certainly due to either an error of the nanoindenter apparatus (not finding the wafer surface) or due to the presence of a dust particle. All indent locations in Fig. 2 were as well observed via SEM and, within its resolution (10 nm at 15 kV), no plastic deformation was seen for loads below 0.75 mN, even of the native oxide layer. To investigate the stress repartition of the indents during indentation, four magnified SEM micrograph insets of the indents are displayed in Fig. 2 at 1.25, 2, 3, and 4 mN. These images show the influence of the load in conjunction with the tip geometry on the dislocations nucleation and propagation which was revealed by electrochemical etching. The upper dissolved area, (see arrow 2 in Fig. 2) in the first three micrographs (from the left to the right), corresponds to the transition edge between the rounded top and the back plane of the Berkovich tip in the inserted AFM image of Fig. 1 (see arrow 2 in Fig. 1). This dissolved form follows a straight trench along the [ 10] direction. This suggests that during loading, higher shear stress arise due to stress concentration at the transition edge (defined above) leading to the dislocation nucleation in a preferential direction via β-dislocations. By increasing the load, one can see dissolved lines perpendicular to the straight dissolved trenches (see arrow 3 in Fig. 2). These dissolved lines correspond to the [110] direction via α-dislocations and can be correlated to the topographical lines visible on the top of the blunt Berkovich tip (see arrow 3 in Fig. 1). These lines are related to the wear lines present at the surface of the diamond tip. It demonstrates with certainty that, together with the transition edge, the spherical part of the tip was in contact with the surface during indentations between 2 and 3 mN. At 4 mN, all indents are dissolved. The triangular shape of the Berkovich tip is clearly visible, which indicates that more than the spherical end of the tip was penetrating the surface.
Optical image of the indentation arrays revealed by electrochemical etching. On the left and right, 10 mN reference indents delimit the zone. Three different regions can be determined: from 0.25 to 0.75 mN, no dislocations are visible; from 1 to 2.25 mN, first indents appear statistically; and from 2.5 to 4 mN, indents can be clearly seen. In insert, Scanning electron microscopy (SEM) micrographs of indents at 1.25, 2, 3, and 4 mN: one can clearly distinguish the influence of the load on the dissolved imprints (arrow 1 indicates the orientation of the tip in [110] direction).

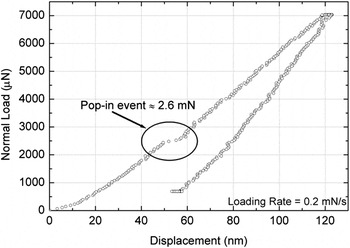
To investigate the pop-in event, 100 indents were carried out at various loads from 1 to 20 mN. Figure 3 shows a typical load–penetration curve acquired when indenting an {100} InP wafer up to a load of 7 mN. This plot shows a prominent discontinuity during the loading step at approximately 2.6 mN well known in the field of indentation as pop-in. At the pop-in event threshold, the indenter undergoes a sudden extension of around 10 nm. From the results, a mean value of 2.27 mN was found for the pop-in event. The minimum and maximum loads that define the transition regime between no pop-in and well-defined pop-in occurrence were 2 and 2.85 mN, respectively.
Load–penetration curve for InP sample loaded up to 7 mN including the pop-in load (2.6 mN) and the pop-in extension (∼10 nm).

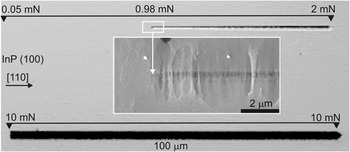
Figure 4 shows two scratching tests where the lower scratch serves only as a reference and was carried out at the constant load of 10 mN. The upper scratch is representative of a set of 15 tests. It was realized by increasing the load from 0 up to 2 mN along a distance of 100 μm with a scratch velocity of 10 μm/s. Identically, to the indentation experiments, the dislocation field was first revealed by electrochemical etching. The first dissolved areas corresponding to the first dislocations nucleation appear at a load threshold of approximately 0.98 mN. The insert in Fig. 4 presents a SEM micrograph of the beginning of the dissolved scratch. In this insert, several lines appear in the [ 10] direction followed two micrometers further in the [110] direction by a large, flat, circular area of dissolved material of approximately 5 μm in diameter. These large dissolved areas are positioned at the center of the scratch, and thus their presences are related to the scratch dissolution. It can be concluded that these lines perpendicular to the scratching direction and the circular area correspond clearly to the beginning of plastic deformation. A dark line is also visible and is assumed to be due to a carbon contamination which may come from a dirty tip. From this SEM image, it is obvious that the location and the subsequent load needed to generate the first dislocations in InP can be very precisely determined using this electrochemical etching technique. The load threshold, for which the first dislocations are observed to occur during the scratching tests, is found to vary between 0.74 and 1.22 mN with a mean value of 0.93 mN. The friction coefficient (f = F t/P with P the normal load and F t the tangential load) is estimated to be approximately 0.07. Although, the friction coefficient between diamond and InP remains unknown,Reference Yan, Tamaki, Zhao and Kuriyagawa39 this result is in good agreement with the commonly observed value of 0.1 for the friction of diamond on semiconductor surfaces.Reference Bhushan and Li40
Optical image of two scratches. The upper one is a representative scratch of our experiment whereas the lower one serves as scale reference (100 μm). The upper scratch was performed by varying the load along its length from 0 to 2 mN. The first dislocations appear at around 0.98 mN. In insert, SEM micrograph of the beginning of the dissolved scratch at the surface.

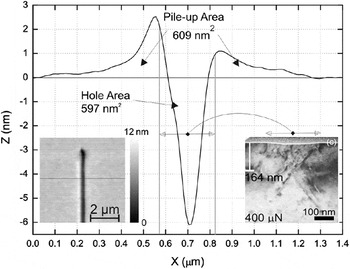
An AFM topographical investigation was carried out on a scratch at a load of 0.4 mN to assess the deformation at the nanometer scale and the results are presented in Fig. 5. The left insert in this figure represents a 3D overview of the area where the profile was taken. The right insert is the corresponding bright field high resolution transmission electron microscopy (XTEM) image. From the scratch profile, the scratching imprint (hole area) and the pile-up located around the scratch are clearly visible. Care must be taken with the unit as the Z-axis is in nm, whereas the X-axis is in μm. Thus, the topography of the sample can be considered as flat. The asymmetry of the pile-up is certainly due to a small misalignment of the tip in the scratching direction. The pile-up is more or less a quarter of the scratch depth but extends up to three times the scratch width. The scratch and pile-up areas were computed and were found to be virtually identical with a value of 600 nm2. From this observation, it can be concluded that the material “removed” from the residual groove during scratching groove is in fact moved outside the scratching groove forming the pile-ups. The width of the deformed zone measured with AFM was also compared to XTEM image (right insert in Fig. 5), and very good agreement was found between both techniques. From these results, it is observed that the main part of the scratch area is filled with dislocations. On the contrary, the pile-up is totally free of dislocations.
AFM profile of a scratch at a load of 0.4 mN (Z-axis in nm and X-axis in μm); the left insert shows a three-dimensional AFM topographical image of the scratch; the right insert is the corresponding bright field high resolution transmission electron microscopy image.

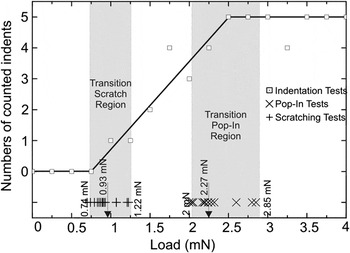
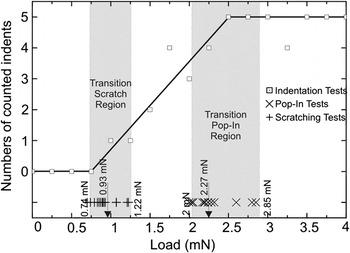
Figure 6 summarizes the indentations, scratching, and pop-in results. The square markers ( ⃞ ) represent the number of dissolved indents counted from Fig. 2 versus the applied load. Considering the 10 nm conservative limit resolution of the SEM, the first visible indent appears at 1 mN, and the number of indents is rising until 2.5 mN, where all indents are observable. Between these two loads, although their number increases with the load, the location of their occurrence of the dissolved imprints has a clear random behavior. Evidence of this is shown in Fig. 2 and by comparing the results with the straight line linking the points (0.75;0) and (2.5;5). Beyond 2.5 mN, a plateau is reached and all indents performed above this load were systematically dissolved. Only one indent is not dissolved for reasons already mentioned. In Fig. 6, the crosses (+) show the loads at which the first dissolved dislocations are observed with the SEM in scratching. The transition area, for the scratching tests, ranges between 0.74 and 1.22 mN with a mean value equal to 0.96 mN. This area is called thereafter the transition scratch region. Finally, the symbols (×), in Fig. 6, stand for the loads at which the pop-in event occurred. This zone is thereafter called the transition pop-in region with a mean value at 2.27 mN with the lower and upper limits at 2 and 2.85 mN, respectively. A clear separation between the transition scratch region and the transition pop-in region exists.
Summary of the indentation and scratching experiments. The square markers ( ⃞) represent the number of indents counted versus the load applied. The crosses (+) illustrate the loads at which the first dislocations appeared during scratching tests. The symbols (×) stand for the loads at which pop-in event occurred.
IV. DISCUSSION
Based on the literature, dislocation nucleation in nanoindentation is related to either the initial impact,Reference Mann and Pethica16, Reference Mann and Pethica17 the difference in doping leading to plastic deformation even without pop-in and so random,Reference Page, Oliver and McHargue13, Reference Patriarche and Le Bourhis14 the deformation of the native oxide layer,Reference Almeida, Prioli and Ponce15 or the pop-in event (related to the density of native defects).Reference Leipner, Lorenz, Zeckzer, Lei and Grau9–Reference Bradby, Williams, Wong-Leung, Kucheyev, Swain and Munroe12 In this work, the first case can be disregarded as the approach velocity is identical for all indentation tests and no dislocations are generated up to a load of 1 mN. The latter case is observed for tests conducted at loads higher than 2 mN since all indents having a pop-in the load–displacement curves were etched indicating that dislocation nucleation had occurred. For indentation loads between 1 and 1.75 mN, plastic deformation exists without any pop-in event. Consequently, in this range of loads, the authors believe that dislocation nucleation and propagation in InP during nanoindentation are due to a combination of three factors: first, the imperfect spherical loading conditions (there is no perfect tip), then to the material anisotropy, and finally to the InP doping (n ∼ 3 × 10¹⁸ to 8 × 1018 cm−3), which is very similar to the work of Patriarche et al.Reference Patriarche and Le Bourhis14 (n ∼ 1018 cm−3) who also saw plastic deformation without pop-in event. The SEM inserts in Fig. 2, obviously, supports this theory. Actually, based on AFM image in Fig. 1, the loading condition is expected to be spherical up to an indentation depth of 40 nm for a load of 1.75 mN, whereas at higher loads, the transition edge of the tip starts to play a role in the stress field. It can be concluded that for loads from 1 to 1.75 mN, dislocation nucleations are due solely to the few defects inside the materials, which are consistent with the low frequency of plastic deformation. For loads higher than 1.75 mN, the line contact corresponding to the transition edge of the tip following by a pseudospherical contact is becoming more and more significant. Due to this improper loading conditions, the first dislocations appear under the tip at lower loads due to the line loading step compared to the one required to nucleate dislocations in case of a perfect spherical contact. This behavior is caused by high localized stresses leading to stress concentration, which is well known in the field of linear elastic fracture mechanics.Reference Saxena41 Stress concentration may also come from surface inhomogeneities. For instance, the surfaces are not perfectly plane as the roughness of the InP wafers was approximately Rz ∼ 2 nm. Dislocation nucleation attributable to surface inhomogeneities will result in a random behavior (dislocation will propagate in different preferential direction). However, as all imprints below 1.75 mN in Fig. 2 have the same shape (a line along the [ 10] direction) indicating that in our experiments surface inhomogeneities (or surface roughness) do not have a main influence of the onset of plasticity.
In a perfectly spherical indentation, the deformation is symmetrically accommodated by the specimen and the indenter is supported uniformly over the contact area. On the contrary, in a scratch deformation where a significant amount of plastic deformation occurs, the indenter is only fully supported by the specimen in the front or leading part while the recovered material, behind the indenter, partly supports the indenter in the rear half. The amount of recovered material that will support the indenter depends upon the nature of the material. For a perfectly plastic material, there is no recovery after deformation, and hence, there is no load supporting in the rear half of the indenter surface. In contrast, for an elastic material, there is partial support of the indenter in the trailing zone.Reference Briscoe, Pelillo, Ragazzi and Sinha42, Reference Dasari, Duncan and Misra43 The type of material behavior during indentation and scratching is described by the so-called rheological factor X,Reference Bucaille, Felder and Hochstetter44, Reference Johnson45 which is defined by:
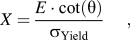
where E is the Young’s modulus, θ is the indenter semi-apex angle, and σ Yield is the yield strength. The rheological factor represents schematically the ratio between the deformation imposed by the indenter [ε ∼ cot(θ)] and the part of the elastic deformation (ε e = σ Yield/E). Using the highest Young’s modulus E [111] = 113 GPa,Reference Madelung, Rössler and Schulz46θ = 70.3°,Reference Bhushan19, Reference Fischer-Cripp33 and σ Yield = 1.3 GPa,Reference Patriarche and Le Bourhis14 a maximum value of approximately 40 is found. Knowing that for values close to 100, the deformation mechanisms are mainly plastic (close to metal behavior), whereas for values close to 10, the material behavior is mainly elastic,Reference Bucaille, Felder and Hochstetter44, Reference Tabor47 it can be concluded that InP behavior lies between the elastic recovery and plastic deformation. Hence, in contrast to indentation tests, the transition edge, taking into account the scratching direction (arrow 1 in Fig. 1), is located in the rear part of the indenter and therefore its influence on the contact is less important. Furthermore, no pop-in was observable for any scratching tests performed on InP surfaces so that the load, at which the first dissolved area is visible, is considered to be responsible for the first dislocation nucleation and is used for further calculations.
The striking result of this study, visible in Fig. 6, is the important difference between the load needed to nucleate the first dislocations in scratching (mean = 0.93 mN) compared to the one in indentation (mean = 2.27 mN). To explain this behavior, the stress field below the tip was computed using the equation set written by Hanson and Johnson.Reference Hanson30, Reference Hanson and Johnson31 Hanson’s model allows the calculation of the stress field of a static perfectly elastic spherical indentation (or scratching) on an isotropic half-space. Hanson’s model is valid until the limit between elasticity and plasticity is reached. The dislocations nucleation and propagation are known to be caused by the shear stresses in single-crystal semiconductors.Reference Hirth and Lothe48 It is well known that, in diamond structures, dislocations glide along the {111} equivalent planes and the glide directions are <110> leading to a rosette arm patterns.Reference Leipner, Lorenz, Zeckzer, Lei and Grau9, Reference Patriarche and Le Bourhis14, Reference Gassilloud, Michler, Ballif, Gasser and Schmuki29, Reference Le Bourhis and Patriarche32, Reference Le Bouhris36, Reference Azzaz, Michel and George49–Reference Le Bourhis and Patriarche51 The shear stress in the {111} planes in anisotropic materials would be the appropriate value to analyze for the dislocations nucleation and propagation. Even if this case is covered by Hanson’s equations, it appeared very difficult and time consuming to implement. Therefore, it was decided, as a good approximation, to consider the maximum shear stress as the most suitable parameter to discuss the experimental differences observed between the scratching and pop-in tests. The maximum shear stress (τ max) is defined by the following equation:
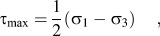
where σ 1 and σ 3 are the maximum and minimum principal stresses, respectively.Reference Fisher-Cripps52
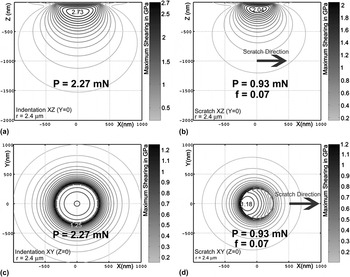
Figure 7 illustrates the distribution of maximum shear stress at the surface for an indentation and for a scratch experiment. The equations used consider the loads required to nucleate systematically the first dislocations in InP wafer containing no defect for a perfect tip radius. For computation, the experimental values obtained above were used (2.4 μm for tip radius based on AFM measurement, 2.27 mN for the threshold in indentation, and 0.93 mN in scratching with f = 0.07). In Fig. 7, only the maximum shear stress is plotted (i.e., not the surface deformation). The scale of maximum shear stress is given on the right-side of each simulation in gray scale (light gray and black colors are used for the minimum and maximum values of τ max, respectively). The scratching direction is indicated in Figs. 7(b) and 7(d) with an arrow. Figures 7(a) and 7(b) show cross-sections in the plane XZ (Y = 0) under the tip during indentation and scratching, respectively. The maximum value of τ max, also called the critical shear stress [Max(τ max)], is obtained between 100 and 300 nm under the tip [Max(τ max) = 2.73 GPa] and reaches zero far away from the indentation zone (>1500 nm). The results in scratching are similar to one in indentation, τ max reached its maximum value between 100 and 300 nm below the tip [Max(τ max) = 2.04 GPa] [see Fig. 7(b)]. However, the maximum value has been shifted to a few nanometers in the scratching direction X. Figures 7(c) and 7(d) illustrate top views in the plane XY (Z = 0) of τ max at the surface for indentation and scratching, respectively. Inspection of Fig. 7(c) indicates that the critical shear stress [Max(τ max) = 1.25 GPa] lies along a circle line having a diameter of approximately 800 nm, which corresponds to the contact radius. The value at the surface (1.25 GPa) is approximately half that inside the bulk (2.73 GPa). During scratching, a value of Max(τ max) = 1.18 GPa is obtained at the center of the scratch but is located slightly behind the tip. This corresponds to the decompression phase of the material during scratching, and these results are consistent with the literature.Reference Johnson7, Reference Ahn, Farris and Chandrasekar53
Distribution of the maximum shear stress (τ max) inside the bulk and at the surface for an indentation (P = 2.27 mN) and a scratch (P = 0.93 mN; f = 0.07). The scale of maximum shear stress is given on the right-side of each simulation in gray scale (light gray and black colors are used for the minimum and maximum values of τ max, respectively). (a) indentation in the bulk, (b) scratch in the bulk, (c) indentation at the surface, and (d) scratch at the surface.

Due to the uncertainties in the tip radius, calculations were performed for the two different measured radii and for the indentation and scratching process. The critical shear stresses were extracted from the computations for each case and are given in Table I. Columns (1) and (2) summarized the results of Fig. 7 for the two tip radii based on the experimental dataset presented earlier and column (3) is the difference in percent of column (1) and (2). It should be kept in mind that the loads used in the calculations in indentation and in scratching are the loads needed to nucleate systematically the first dislocations in the InP semiconductor for the current tip radius. From inspection of Table I, several interesting observations can be made. First, for both processes, the critical shear stress is higher in the plane XZ than in the plane XY. In other words, the shear stress is always higher in the bulk than at the surface. Second, the values of maximum shear stress in indentation at 2.27 mN and in scratching at 0.93 mN are the same within 6% at the surface (XY plane) for the two tip radii. In contrast, in the bulk (XZ plane), the discrepancy between indentation and scratching is approximately 25% and is due to the friction at the surface during scratching. These disparities in the critical shear stress [Max(τ max)] between indentation and scratching suggest that dislocations are nucleated first at the surface and then extend to the bulk, even though the shear stress inside the bulk is higher. Actually, the load required to systematically nucleate the first dislocations in scratching (0.93 mN) is more than twice lower compared to the one in indentation (2.27 mN). These results are consistent with the literature,Reference Mann and Pethica16, Reference Mann and Pethica17, Reference Wasmer, Parlinska-Wojtan, Gassilloud, Pouvreau, Tharian and Michler22, Reference Vanderschaeve54, Reference Levade and Vanderschaeve55 and this behavior was explained via stress concentration induced due to either tip imperfection or surface inhomogeneities or a combination between them.Reference Mann and Pethica16, Reference Mann and Pethica17 Then, based on the shear stress yield criterion,Reference Dowling56 the relation between the yield stress in tension (σ Yield) and in shear (τ max) is known to be σ Yield = 2·Max(τ max), leading to a yielding stress value of σ Yield ∼ 2.5 GPa at the surface. This value is approximately twice higher than the one determined by Patriarche et al. (σ Yield = 1.3 GPa).Reference Patriarche and Le Bourhis14 This difference can be easily explained by the fact that Patriarche et al. evaluated the yield stress of InP in a fully plastic regime. In such case, the material yields mainly due to dislocations propagation and expansions and not to dislocations nucleation. Noticeably, a step is created only when the dislocation Burgers vector component along loading axis is not null. Hence, when only one dislocation nucleates at the surface, it obviously creates a step of at least its Burgers vector. This process has a cost in surface energy and leads to a higher value of the yielding value.Reference Hirth and Lothe48, Reference Kamat and Hirth57 These processes of dislocations nucleation and propagation were also observed in stress–strain experiments of initially dislocation-free single-crystal semiconductors. In these traction tests, an upper and lower yield points were defined and the phenomenon explained by the rapid multiplication of low initial dislocation content at the point when the few dislocations in the material can no longer sustain the imposed strain rate.Reference Alexander and Haasen58 Finally, the fact that dislocations nucleate at the surface and then expand into the bulk gives an explanation for the pop-in event in spherical indentations. To start with, the surface is loaded until the critical shear stress at the surface is reached due to stress concentrations leading to high localized stresses (τ max surface > τ max bulk) caused by the imperfect tip geometry and/or surface inhomogeneities. Based on the results presented in Figs. 7(c) and 7(d), yielding occurs due to dislocations nucleation most probably at the contact radius. To end with, as the shear stress inside the bulk is generally higher than at the surface, after the dislocations nucleation at the surface, they expand instantaneously and multiply until a stable size is achieved. This rapid expansion leads to a sudden extension of the indenter, the pop-in event, which is recorded in the load–penetration curve of Fig. 3.
V. CONCLUSIONS
The difference between indentation and scratching was investigated in the case of a single crystalline InP semiconductor. The tip radius used in this work was accurately characterized by two methods. An array of several indents and scratches were electrochemically etched and compared to evaluate the loads required to nucleate the first dislocations. In indentation, the elastic–plastic transition could be divided into two cases that are with or without pop-in events. When no pop-in events were perceptible, dislocation nucleations were found to be random and so were related to the few defects inside the materials, the imperfect tip geometry, and the material anisotropy. When pop-ins were visible in the load–displacement curves, plastic deformations were always observable and their respective pop-in loads were determined. For the tip used in this work, the load needed to generate systematically the first dislocations in indentation (2.27 mN) is more then twice higher than the one required in scratching (0.93 mN). The experimental values obtained were implemented in an analytical model to determine the maximum shear stress based on an elastic spherical Hertzian contact. The model predicts different stress inside the bulk material between indentation and scratching due to the friction at the surface during scratching. The modeling suggested also that dislocations nucleate at the wafer surface and not inside the bulk. The nucleation of dislocations at the surface is consistent with experimental observations, and this behavior was explained via a combination of specific conditions including the low density of native defects, the imperfect spherical loading conditions, and the material anisotropy. After nucleation, the dislocations propagate into the bulk where the shear stress is higher. Finally, at loads higher than 2 mN, the geometry of the imperfect tip starts to play a role by inducing high localized stress field on the line contact which can be related to the pop-in event.
ACKNOWLEDGMENTS
The authors would like to thank Dr. P. Kern and C. Jäggi (EMPA Thun) for assistance in electrochemistry and Dr. B. Moser for helpful discussions of the manuscript.