Introduction
Advanced bandstructure design in semiconductor heteroepitaxy has led to a broad variety of high-performance electronic and optoelectronic devices and systems. By the recent development of the wide band gap group-III nitrides as fully functional system [Reference Akasaki and Amano1,Reference Edgar, Strite, Akasaki, Amano and Wetzel2] of high crystalline quality [Reference Akasaki, Amano, Koide, Hiramatsu and Sawaki3] combining n and p-type conduction [Reference Amano, Kito, Hiramatsu and Akasaki4], large electronic band gaps and band offsets this system is predestined to take light output, high temperature operation, switching power and GHz power to significantly higher levels of performance. One of the crucial challenges along this path is a coherent description of spectroscopic observations and even better yet an understanding of the underlying physics. As compound system stable in the uniaxial wurtzite structure inversion symmetry along the unique [0001] axis which typically coincides with the epitaxial growth direction is not maintained. In combination with strong polar bonding contributions and heteroepitaxial strain this leads to rather strong polarization and piezoelectric effects in heterostructures of AlGaInN. Results of piezoresistivity [Reference Bykhovski, Kaminski, Shur, Chen and Khan5] and first principles calculations [Reference Bernardini, Fiorentini and Vanderbilt6] find large coefficients for piezoelectric (GaN: e 33 = 0.73 C/m2, e 31 = −0.49 C/m2 [Reference Bernardini, Fiorentini and Vanderbilt6]) and spontaneous polarization (GaN: P eq = −0.029 C/m2 [Reference Bernardini, Fiorentini and Vanderbilt6]). In this context we shall experimentally quantify the associated electric fields and explore the role of such polarization fields in the optoelectronic properties of thin film and quantum well heterostructures. We present experimental results of pseudomorphic AlGaInN/GaN thin film and multiple quantum well (MQW) structures of various well width and composition near the performance optimum of laser diodes in the 430 - 400 nm range using combinations of modulated reflectivity and photoluminescence spectroscopy.
Background
Among the challenges in group-III nitrides is the identification of the electronic bandstructure in AlGaInN/GaN heterostructures in order to identify the light emission processes, the threshold edges for detector devices and the channels of highest electron mobility. Especially the aspect of light emission in light emission diodes and laser diodes has been subject of substantial controversy in recent years [Reference Chichibu, Azuhata, Sota and Nakamura7,Reference Narukawa, Kawakami, Fujita, Fujita and Nakamura8]. Work has been hampered by a wide range of material qualities in this highly strained superlattice system exhibiting a strong tendency towards inhomogeneities [Reference El-Masry, Piner, Liu and Bedair9]. To resolve this dilemma we concentrate on material that has been optimized for the highest homogeneity of the structural and optical properties [Reference Akasaki and Amano1]. In order to explain the processes within the wells we first develop a foundation by studying the conditions of the barriers that define the well. In this way the energy of binary GaN layers serves as an accurate point of reference. Here we will show that by such an approach we gain important insight into the conditions of the AlGaInN quantum well system in general and only thereafter endeavor into a more phenomenological description of the conditions within the depth of the wells.
Experimental
GaInN/GaN structures have been grown by MOVPE on basal plane sapphire using the technique of low temperature deposited buffer layers of AlN and GaN [Reference Akasaki, Amano, Koide, Hiramatsu and Sawaki3]. Layers have been optimized for microscopic homogeneity and smooth morphology. Typical growth temperatures for GaInN layers range from 680 -780 oC. A first set of GaInN layers was grown at thicknesses of 400 Å and variable composition x, (0 < x < 0.2) pseudomorphically on GaN. Details have been given in Refs. [Reference Wetzel, Takeuchi, Yamaguchi, Katoh, Amano and Akasaki10,Reference Wetzel, Takeuchi, Amano and Akasaki11]. Next a set of GaInN/GaN MQWs with variable x, (0 < x < 0.2) and well width L w = 30 Å, barrier width L b = 60 Å were studied [Reference Sakai, Takeuchi, Sota, Katsuragawa, Komori, Amano and Akasaki12]. A third set comprises nominally fixed compositions and variable well width L w, 23 Å ≤ L w ≤ 70 Å. A fourth set consists of Al γ Ga1− γ N/GaN MQWs on GaN (L w = 34 Å, L b = 100 Å, x ≈ 0.06). A fifth set was Si doped in the barriers at concentrations of 3×1018 cm−3 (L w = 30 Å, L b = 60 Å, x = 0.15).
Time integrated photoluminescence (PL) was performed using a 325 nm HeCd laser. Stimulated emission was performed using a 1 mJ pulsed 337 nm N2 laser. For photoreflection (PR) the spectral reflectivity was measured using light of a Xe-lamp and above band gap modulation by the HeCd laser. For electro-modulated reflection (ER) a variable voltage of 0.5 to 2 V amplitude was applied using an aqueous electrolyte as a top contact. Alloy compositions were determined using a dynamical analysis of x-ray rocking data in the QWs and x-ray diffraction of both lattice constants for the thicker layers. Details have been given in Refs. [Reference Wetzel, Takeuchi, Yamaguchi, Katoh, Amano and Akasaki10,Reference Wetzel, Takeuchi, Amano and Akasaki11,Reference Wetzel, Takeuchi, Amano and Akasaki13].
Reflection Spectroscopy in Strained Layers
Characteristic modulated reflection data is compared in Figure 1. Within a pseudomorphically strained 400 Å, x = 0.19 single heterostructure (SH) (trace a) a strong oscillation appears at the so determined optical band gap near 2.65 eV in both PR as well as ER. From the close correspondence we conclude that the modulation process also in PR is that of a variable electric field acting perpendicular to the surface [Reference Wetzel, Takeuchi, Amano and Akasaki11]. The oscillation minimum marks a critical point in the joint density of states (J-DOS) that can be assigned to the direct optical band gap in the pseudomorphic GaInN layer. From a tracing of this signal for variable composition an expression for the optical band gap in Ga1− x In x N could be derived [Reference Wetzel, Takeuchi, Yamaguchi, Katoh, Amano and Akasaki10]. Upon a more detailed investigation additional extrema appear on the high-energy side of the oscillation at a variable degree of clarity in about 20 out of 40 studied samples [Reference Wetzel, Takeuchi, Amano and Akasaki11]. Trace b) depicts a case where up to three half-periods can clearly be identified. From a fitting procedure considering different known line shape models it was found that a very good description can be given by the scaled electro-optical functions (dashed lines) [Reference Aspnes14]. Fitting procedures involving more generic third derivative-type lines fail to reproduce the spectral asymmetry. The electro-optical functions describe Franz-Keldysh oscillations (FKOs) in the vicinity of a three dimensional critical point in the J-DOS due to the presence of a static electric field F. The oscillation period scales with the electro-optic energy hΘ which is a very direct measure of the acting electric field strength F.

Spectra of photo modulated reflection (PR) and electro modulated reflection (ER) in various layers. a) PR and ER in high x single heterostructure (SH) coincide in all details revealing the field modulation nature of the PR. b) FKOs in a strained SH thin film marking the direct band gap and shorter periods due to reduced strain, i.e., fields. c) Well resolved FKOs originating in a narrow well together with the electro-optical line shape function. d) Several FKO extrema separate N0 and N1 in a wide well. Like in c) these fields act in the well. e) ER in a doped MQW shows FKOs in the barrier above the GaN band gap N0 with bias-dependent period while PR can be described in 3rd derivative line shapes (interference fringes IF are marked as identified in the DC reflection). f) FKOs within the barriers of an AlGaN/GaN MQW.

The only material related parameter is the J-DOS effective mass µ ≈ 0.2 m 0 [Reference Meyer, Volm, Graber, Alt, Detchprohm, Amano and Akasaki15] that enters in a power below unity. Consequently very accurate readings of the electric field within the sampled area can be obtained. A similar situation can be identified within GaInN/GaN MQW structures (trace c) [Reference Wetzel, Takeuchi, Amano and Akasaki16]. In this case the oscillations are superimposed on third derivative features (N 0) at the GaN band edge. Furthermore a clear onset (N 1) of the oscillations marks the three-dimensional band gap which in this case is below the GaN barrier band gap energy. In some layers the third derivative features dominate and the assignment of FKOs is less reliable (trace e), PR). A different situation occurs for a modulation by an externally applied electric field in ER [Reference Wetzel, Amano and Akasaki17]. In this case oscillations appear only above the GaN band edge. Under variation of the bias voltage the oscillations respond with a variation of the oscillation period (dashed line). This corresponds to fields of 0.40 - 0.76 MV/cm which also leads to a determination of the polarity of the internal electric field [Reference Wetzel, Amano and Akasaki17]. A field of 0.14 MV/cm can be derived from the FKOs in the barriers of an AlGaN/GaN MQW in trace f).
Electric Field in Strained GaInN/GaN
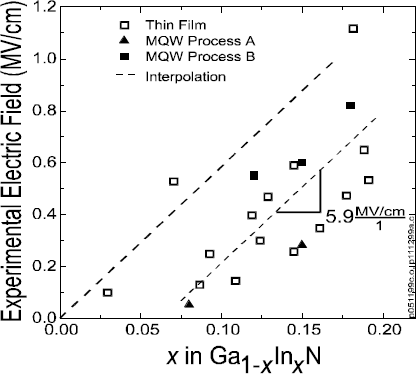
The range of so determined electric field values versus the layer composition (Figure 2) in Ga1- x In x N thin films and MQWs spawns a wide range of electric fields up to a maximum determined value of 1.1 MV/cm for x = 0.19 [Reference Wetzel, Takeuchi, Amano, Akasaki, DenBaars, Palmour, Shur and Spencer18]. Despite some scatter in this large data set, a linear correlation with composition and/or pseudomorphic strain can be derived at a slope of ∂F/∂x = 5.9 MV/cm. This corresponds to very large area charge densities of ∂σ/∂x = 3.4×1013 cm−2 and is induced by the discontinuity of the lattice polarization at the interface. The presence of such large field values should prompt screening mechanisms to compensate. As we will see below such mechanisms can be effective only on a larger length scale but not where size quantization is relevant. It therefore is an interface effect similar to band offsets where the discontinuity of a volume property induces large dipole moments. First principle calculations [Reference Bernardini, Fiorentini and Vanderbilt6] show that polarization properties of GaN and InN are very similar and so we should attribute the observed fields to the discontinuity of strain in the pseudomorphic structures, i.e., the piezoelectric properties. The contrary must be expected for AlGaN alloys, where compositional variations should dominate over the strain effects [Reference Wetzel, Nitta, Takeuchi, Yamaguchi, Amano and Akasaki19].
Experimental electric field values in pseudomorphic thin film GaInN/GaN and MQWs versus composition. In the average a differential slope and a composition offset is identified. For some samples, however, this offset seems to vanish.

Polarization Tuned Band Gap
The occurrence of FKOs is limited to conditions where electrons or holes are free to follow the direction of the electric field. Such a situation is generally given above a three-dimensional critical point in the J-DOS and for in-plane fields within two dimensional QWs. The requirement is also fulfilled for electric fields acting perpendicular to the plane of QWs for carrier energies above the well. The MQW data, however, clearly shows that the respective band edge corresponds to a band gap smaller than the GaN barrier band gap adjacent to the GaInN wells. The spectrum of a control sample (Figure 1, trace d) with a rather weak electric field (F = 0.07 MV/cm) shows that several oscillation extrema can be identified in the interval from the critical point N 1 to the GaN band gap energy N 0 [Reference Wetzel, Takeuchi, Amano and Akasaki13]. This excludes any hypothetical uncertainty of the exact phase argument of the oscillation.
The splitting of levels N 0 and N 1 has been studied as a function of composition and of well width [Reference Wetzel, Takeuchi, Amano and Akasaki13]. Figure 3 depicts results for L w = 30 Å and variable x (Figure 3a), and for L w, 23 Å ≤ L w ≤ 70 Å (x ≈ 0.13) (Figure 3b). From both sets we conclude that the splitting ΔE = E(N 0) - E(N 1) of the so-defined critical point energy from the GaN band gap follows the product of electric field, electron charge and well width. Within an error of ± 20 % the factor of proportionality is unity.

a) N0 - N1 splitting versus field values derived from FKOs follow a slope of e 31 Å. b) The same splitting as function of well width results in a slope of e 0.39 MV/cm for constant composition.

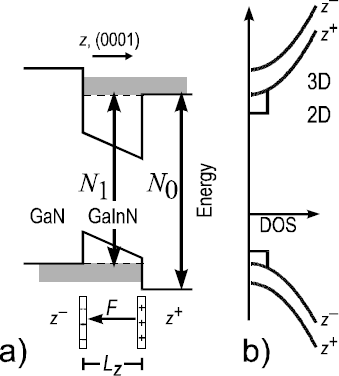
The apparent contradiction of energy level and dimensionality can be resolved by considering a staggered band line-up of the barrier band edges across the GaInN well similar to type-II heterointerfaces [Reference Esaki20]. Figure 4 sketches this situation. According to this the determined electric field originates in the piezoelectric dipole induced by the strained well layer and it is limited to this range. This results in asymmetric barrier heights on either side of the wells, electrons and holes, however, are free to move along the field, respectively. The close correspondence of level splitting and electric field under variation of both parameters, well width and composition, i.e., electric field allows for a very accurate determination of the actual polarization conditions of the system. It allows to determine the electric field within the QW and to determine the bandoffset across the GaN/GaInN/GaN multiple heterointerface.
a) Derived model of band lineup across the GaN/GaInN/GaN heterointerface with strained piezoelectric GaInN layer. The shaded areas mark resonant states associated with an interband transition N1 at energies below the barrier band gap. The system resembles a type-II staggered heterointerface with a direct transition. b) The respective DOS distinguishes branches z+ and z- with respect to the well. Two dimensional states in the well are not indicated and external response fields are neglected.

Polarization Dipole
The role of the GaInN well layer is that of a controllable interface dipole D = ε0 εr F L w between pairs of GaN barriers that by L w and composition allows the controlled adjustment of the band edges across the thin well layer. This adds a versatile control parameter and another degree of freedom to the tools of superlattice bandstructure design.
The induced piezoelectric polarization P = ε0 εr F acts as perfect δ-doping layers [Reference Zrenner, Reisinger, Koch, Ploog and Maan21] of large area charge densities σ = P/e within sub-monolayer thicknesses and periodicity of the lattice. In contrast to impurity doping, however, both polarities of charges are spatially fixed. A complete screening of the induced dipoles requires the depletion of rather thick highly doped layers [Reference Wetzel, Amano and Akasaki17]. This in turn induces large potential steps and thus strongly limits the transfer of free carriers into shallow wells. For typical doping concentrations of N D = 1018 cm−3 the depletion layer L d = σ /N D = 50 nm for (x = 0.15) extends well beyond the QW region. Polarization fields therefore cannot be screened by doping (see also Ref. [Reference della Sala, di Carlo, Lugli, Bernardini, Fiorentini, Scholz and Jancu22]) on the length scale of typical superlattice periods without compromising sharp definition of electronic levels and crystalline quality. Instead the depletion of adjacent layers will induce a macroscopic field to balance the chemical potential in top and bottom layer of the structures [Reference Leroux, Grandjean, Laugt, Massies, Gil, Lefebvre and Bigenwald23]. In a first approximation this macroscopic field leads to a balancing of each QW dipole with one induced dipole across the adjacent barrier. This response field F b with direction opposing that of F w is limited to the barrier layer and it is this part that is responsible for the observation of FKOs above the GaN bandedge in the electric modulated reflection in Figure 1 (trace e). From knowledge of both field components F w and F b the total polarization charge induced at the heterointerface can be inferred:

The margin of uncertainty originates in the wide range of fields observed. Similar considerations hold for the screening of the equilibrium or spontaneous polarization that induces charges at the discontinuities of the polar sample surfaces. These, however, can easily be screened by carriers accumulated throughout the volume of the sample and surface passivation from the environment. Combining both effects a small correction of the order of the ratio of both length scales ≈ 0.1 must be considered. Under the assumption of the theoretical polarization coefficients [Reference Bernardini, Fiorentini and Vanderbilt6] we expect ∂P/∂x = 0.15 C/m2.
Polarization and Transport Asymmetry
The second aspect of the controlled polarization dipole layer is the fact of a tunable three dimensional critical point in the J-DOS according to E = E g(GaN) - F w e L w. This is in contrast to band line-up engineering in conventional QW designs where the controllable band gap occurs between states of two dimensions. The additional degree of freedom allows photogenerated carriers to escape the well region without additional potential barrier. The respective interband transition exhibits a large matrix element due to the large overlap within the region of the well layer (see Figure 4a). It also directly affects the quantization of states within the QW at lower energies by imposing a variable barrier height that is reduced by F w e L w with respect to the well without polarization effects.
Considering the recombination dynamics of electrons and holes it is essential to distinguish the carriers originating from either the left or the right hand side barriers. For example photogenerated carrier pairs under low excitation will be collected from the same side into the well while carriers injected by a pn-junction come from opposite sides. For the case of GaInN wells strained to GaN barriers in a typical MOVPE pn-junction with top p-type contact the orientation of polarization will provide that carriers are injected from the higher barrier sides, respectively. In this context it is useful to distinguish eigenstates in positive (z +) and in negative (z --) direction of the (0001) axis in accordance with the broken inversion asymmetry (Figure 4b).
So far it has been shown that the electronic bandstructure in the vicinity of the barrier levels is to very large extent controlled by the polarization dipole induced at the pseudomorphic heterointerface. In the next step we shall investigate in a more phenomenological approach the role this dipole plays for the states within the wells at larger binding energies.
Polarization and Quantized Levels of the Well
On the basis of the now well-established conditions of the barriers we next focus on the properties of the well. It had been shown by Takeuchi et al. [Reference Takeuchi, Sota, Katsuragawa, Komori, Takeuchi, Amano and Akasaki24] that PL peak energies in GaInN/GaN QW differ by as much as 350 meV (x = 0.13) for low (2 Wcm−2) and high (200 kWcm−2) excitation density [Reference Takeuchi, Sota, Katsuragawa, Komori, Takeuchi, Amano and Akasaki24]. This value compares well with reported discrepancies in luminescence and absorption [Reference Chichibu, Azuhata, Sota and Nakamura25]. This splitting was shown to vary with well width and composition and has lead to the interpretation of a level shift as a result of the quantum confined Stark effect in the strongly polarized QWs [Reference Takeuchi, Sota, Katsuragawa, Komori, Takeuchi, Amano and Akasaki24]. The presence of this effect was furthermore confirmed by a continuos variation of both, the spontaneous emission under photo excitation [Reference Takeuchi, Wetzel, Yamaguchi, Sakai, Amano, Akasaki, Kaneko, Nakagawa, Yamaoka and Yamada26] and a corresponding level in the ER signal [Reference Wetzel, Detchprohm, Takeuchi, Amano and Akasaki27] as a function of an externally applied bias voltage. A level shift of the spontaneous emission by a variation of the doping concentration has also been interpreted in this direction [Reference Chichibu, Azuhata, Sota and Nakamura25]. It is important to note that none of those observations involve a level under the condition of stimulated emission. It has been observed that several levels appear to compete under conditions near stimulated emission [Reference Watanabe, Yamada, Yamada, Taguchi, Takeuchi, Amano and Akasaki28]. Figure 5 shows a case within a doped MQW. The center peak of stimulated emission is bordered by two very sharply defined levels of spontaneous emission. It therefore cannot be excluded that the level of stimulated emission is of different origin than the one that shifts under electric field variation.
Stimulated and spontaneous luminescence in doped GaInN/GaN MQW revealing multiple sharp levels.

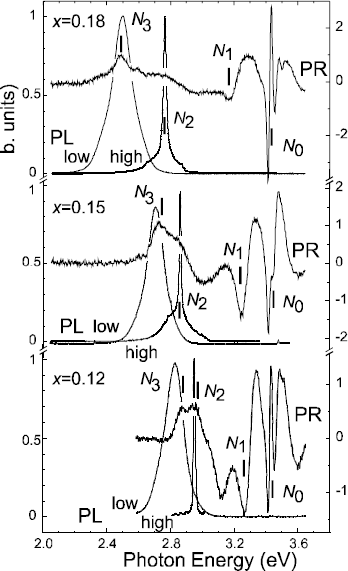
In Figure 6 we compare the emission spectra under low excitation density (2 W cm−2) of the CW HeCd laser and high density (200 kWcm−2) excitation of a pulsed N2 laser [Reference Sakai, Takeuchi, Sota, Katsuragawa, Komori, Amano and Akasaki12] together with the PR spectra for the case of three 30 Å GaInN / 60 Å GaN MQWs with composition x = {0.12, 0.15, 0.18} within a wide spectral range. PR was performed at a very low photomodulation power density of the order of 5 mW/cm2 to rule out any possible trace of luminescence in the PR data. Near 3.4 eV we identify the GaN barrier band gap PR signal (N 0) and the FKOs starting above the well-defined level N 1. The derived electric field values acting within the wells are F = {0.55, 0.59, 0.82} MV/cm and increase with the N 0-N 1 level splitting and composition. In parallel the energetic separation of the levels of stimulated emission and spontaneous emission and the threshold density increases as reported [Reference Sakai, Takeuchi, Sota, Katsuragawa, Komori, Amano and Akasaki12]. In the same energetic range of the QW two contributions N 2, N 3 appear in the PR spectrum that cannot be simulated by partial energy derivatives of Lorentzian-type line functions. Instead the partly asymmetric line shape indicates contributions from higher order effects such as modulated line widths. Such a condition is conceivable for the case of photocarrier screening of electrostatic fluctuations. Also in this mode, however, extrema can be associated with critical points in the J-DOS. In this mode under low density excitation extrema can clearly be identified at levels corresponding to both, the PL maximum of spontaneous emission under low excitation density (N 3) and the peak of stimulated emission under high-density excitation (N 2). This holds for all three InN-fractions and supports that both levels are of the same origin. This evidence strongly suggests that levels of spontaneous and stimulated emission are levels of different origin and both co-exist under low excitation density conditions. This information can be useful in the assessment of gain and band gap renormalization processes.
PL at low and stimulated emission at high density excitation in comparison with PR under low excitation conditions. Stimulated emission coincides with a level labeled N2 seen in PR under low excitation. The electric field condition is revealed from the splitting of N0 and N1 and the FKO in the same region.

In the next step the respective level splittings are compared in Figure 7. We consider the separation of the low energy extrema in PR, the splitting of spontaneous and stimulated emission, as well as the N 0-N 1 splitting in PR and the value of F w e L w derived from the FKOs in PR as functions of the alloy composition. There is a remarkable close agreement of all the considered splitting energies, both in their trend within the composition series as well as in their magnitude. The level of agreement as well as the level of accuracy is higher for the sample with x = 0.18 compared to x = 0.12 which can indicate competing effects for smaller InN fraction or smaller electric fields. This line of evidence strongly suggests that the polarization properties, which define the electronic band structure at the barrier band gap energy, play a similar role in the radiative centers in the depth of the quantum wells. While a more detailed study is underway this observation can tentatively be expressed by the combination of quantum confined Stark effect and the field dependent asymmetric barrier height. The close correspondence of magnitude of the polarization dipole and the respective level splitting furthermore suggests that mechanisms of level broadening and band tailing play a minor role in this material optimized for homogeneity.
Splitting energies of N0 and N1 (PR) (offset between barriers), N2 and N3 extrema in PR, PL peak energies at low and high excitation as well as the quantity F e Lw derived from FKOs. All values share the same trend with composition and merge for higher x.

Conclusions
We have shown that by the combination of modulated reflection spectroscopy with luminescence and absorption techniques can provide a coherent picture of the electronic bandstructure in AlGaInN alloys and heterostructures. Pronounced oscillations in reflectivity have been identified as Franz-Keldysh oscillations allowing an accurate determination of large electric fields within the individual layers. This information can serve as an accurate input parameter for the theoretical description of the electronic band structure. In this way it significantly improves the accuracy over approaches where electric fields and polarization charges are free parameters to describe the interband transition energies. Based on the knowledge of the fields within strained GaInN wells we have derived the value of the relative band offset F w e L w between adjacent GaN barriers. We furthermore find that the same quantity is in direct correlation with the peak discrepancy of spontaneous and stimulated emission and it also reflects in the splitting of corresponding discrete energy levels in the reflection spectra. These properties strongly resemble a Stark ladder with constant step widths defined by the polarization dipole across each individual well [Reference Wetzel, Takeuchi, Amano and Akasaki16]. The combination of field values in the well and their response fields in the barrier was used to quantify the polarization induced fixed charges. From electrostatic arguments it could be shown that screening by modulation doping is of minor influence on the polarization in the wells. The presented results can be extended throughout the AlGaInN heterostructure system by consideration of respective strain and material discontinuities. It could be shown that the role of the polarization dipole at the interface is similar to a controllable type-II staggered band offset between adjacent layers by insertion of a polarized epitaxial layer of variable thickness.
Acknowledgements
This work was partly supported by the JSPS Research for the Future Program in the Area of Atomic Scale Surface and Interface Dynamics under the project of Dynamic Process and Control of the Buffer Layer at the Interface in a Highly-Mismatched System. The authors thank M. Iwaya, N. Hayashi, and R. Nakamura for the excellent sample material and Y. Kaneko for fruitful discussion. This work was partly supported by the and the Ministry of Education, Science, Sports and Culture of Japan (contract nos. 09450133 and 09875083).