INTRODUCTION
A central tenet of sediment stratigraphy is the progressive aging of sediment with increasing depth. In a static setting, sediment settles in neat, successive layers. Yet the marine sediment–water interface is a dynamic environment in which gravitational slumping, bottom water remobilization, and bioturbation intervene with stratigraphic sediment deposition. Bioturbation is particularly confounding; its ubiquity operates as a low pass filter on sediment records (Berger and Heath Reference Berger and Heath1968; Guinasso and Schink Reference Guinasso and Schink1975; Goreau Reference Goreau1980; Wheatcroft et al. Reference Wheatcroft, Jumars, Smith and Nowell1990; Boudreau Reference Boudreau1994; Anderson Reference Anderson2001; Laepple and Huybers Reference Laepple and Huybers2014), but it can sometimes occur in discrete channels that create a heterogeneous age distribution in the sediment and possibly even age reversals (Ruddiman and Glover Reference Ruddiman and Glover1972; Berger and Johnson Reference Berger and Johnson1978; Anderson Reference Anderson2001). Constraining the influence of bioturbation and other sediment mixing processes is particularly important in interpreting high-frequency climate proxy records, particularly with regards to their amplitude and duration (Bard et al. Reference Bard, Arnold, Duprat, Moyes and Duplessy1987; Anderson Reference Anderson2001; Trauth Reference Trauth2013; Laepple and Huybers Reference Laepple and Huybers2014).
Sediment mixing is often parameterized using radioactive tracers like 210Pb and 14C (Peng et al. Reference Peng, Broecker and Berger1979; Demaster and Cochran Reference Demaster and Cochran1982), which have known input functions and decay rates such that the distribution of these tracers within the sediment renders an estimate of sediment mixing in the ocean. The short half-life of 210Pb (t1/2=22.3 yr) limits its utility to only the modern mixing depth, but long-lived 14C (t1/2=5730 yr) can trace sediment mixing well into the last glacial period (Peng et al. Reference Peng, Broecker and Berger1979). Because sediment mixing can vary with environmental parameters, the assumption of a constant mixing regime over time may be an oversimplification of sedimentary conditions. Variations in the availability of organic carbon, as a food source, and dissolved oxygen, to support respiration, are each likely influences on benthic mixing. For example, low oxygen concentrations in bottom waters can suffocate benthic communities such that sediment accumulates in undisturbed, laminated deposits (Behl and Kennett Reference Behl and Kennett1996; Yarincik et al. Reference Yarincik, Murray, Lyons, Peterson and Haug2000; Cook et al. Reference Cook, Keigwin and Sancetta2005; Davies et al. Reference Davies, Mix, Stoner, Addison, Jaeger, Finney and Wiest2011). If oxygen concentrations change over time, then it would not be unreasonable to expect the intensity of sediment mixing to change as well. In the Pacific Ocean, previously observed variability in sediment remobilization (Kienast et al. Reference Kienast, Kienast, Mix, Calvert and François2007) and oxygen concentrations (Cook et al. Reference Cook, Keigwin and Sancetta2005; Jaccard and Galbraith Reference Jaccard and Galbraith2012; Jaccard et al. Reference Jaccard, Galbraith, Frolicher and Gruber2014; Praetorius et al. Reference Praetorius, Mix, Walczak, Wolhowe, Addison and Prahl2015; Tetard et al. Reference Tetard, Licari and Beaufort2017) during the rapid climate transitions of the deglaciation suggest that the intensity of sediment mixing may have indeed fluctuated during this period. Linking sediment mixing to environmental conditions may have the potential to allow predictions of the nature and timing of changes to bioturbation and its influence on sedimentary records. This study presents new radiocarbon (14C) and oxygen isotope records to mutually constrain a model of sediment mixing in the Northeast Pacific Ocean over the past 30,000 yr (30 kyr).
STUDY SITE AND METHODOLOGY
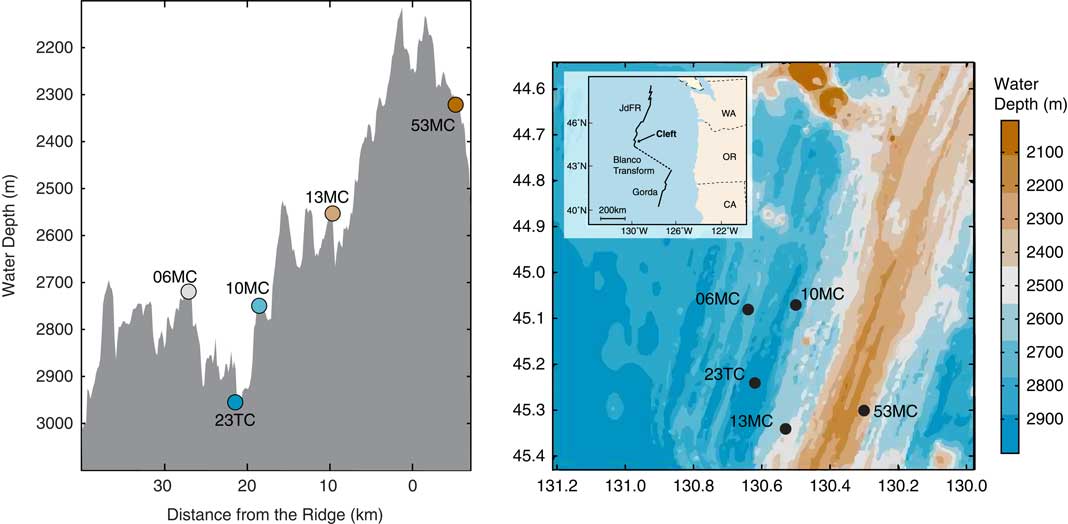
The Juan de Fuca Ridge (JdFR) is located in the Northeast Pacific Ocean about 500 km off the coast of North America in the subpolar transition zone (Figure 1). Sediment cores were collected from the JdFR on the SeaVOICE cruise (AT26-19) of the R/V Atlantis in September 2014. Sedimentation rates on the ridge are highly variable (from <0.5 to >3 cm/kyr) as a result of both glacial-interglacial carbonate preservation cycles and sediment focusing and winnowing along the rough bathymetry of the ridge (Costa et al. Reference Costa, McManus, Boulahanis, Carbotte, Winckler, Huybers and Langmuir2016; Costa and McManus Reference Costa and McManus2017). Glacial sediments are characterized by high carbonate content, high dry bulk density, low magnetic susceptibility (terrigenous content), and higher coarse fraction (primarily foraminiferal tests) (Costa et al. Reference Costa, McManus, Boulahanis, Carbotte, Winckler, Huybers and Langmuir2016). Previous work has focused on piston cores, which provide long records (up to 700,000 yr ago, or 700 ka) but poor recovery of more recent sediment. To study the last glacial maximum, deglaciation, and Holocene, this study utilizes samples from four multicores (AT26-19-53MC, -13MC, -10MC, and -06MC) and one trigger core (AT26-19-23TC) that were retrieved in a depth gradient from the ridge crest (53MC, 2347 m) to the most proximal abyssal valley (23TC, 2906 m) (Figure 1). Two of the multicores (06MC and 10MC) correspond with previously published piston cores (09PC and 12PC, respectively) (Costa et al. Reference Costa, McManus, Boulahanis, Carbotte, Winckler, Huybers and Langmuir2016).
Core locations on the Juan de Fuca Ridge. (Right) Bathymetric map showing the location of the cores relative to the ridge crest (in orange), modified from Costa et al. (Reference Costa, McManus, Boulahanis, Carbotte, Winckler, Huybers and Langmuir2016). (Left) Representative bathymetric profile from the ridge crest to the ridge flanks. Core locations are superimposed on this profile, although their exact depth and distance location may differ slightly. Cores generally follow a depth transect: 53MC, 2347 m; 13MC, 2503 m; 06MC, 2668 m; 10MC, 2711 m; and 23TC, 2906 m. (Color refers to online version.)

Stable Isotope Analyses
Gentle deployment of multi-corers allows the recovery of the sediment–water interface, but the presence of water within the sediment barrels can potentially disturb the upper sediment layers during transport and storage. To minimize these effects, multicores were slabbed shipboard into 1-cm slices immediately upon recovery. Samples from 23TC, a gravity core, were taken later at the Lamont-Doherty Earth Observatory (LDEO) core repository. All samples were then freeze-dried, and an aliquot was weighed into a 125 mL Nalgene bottle: average ~4 g for 23TC and average ~20 g for multicores, the large sample size permitted by the full barrel slabs taken shipboard. The bottles were filled with approximately 100 mL of tap water, and disaggregated on a tumble wheel for 2 hr. Samples were then sieved at 63 μm, and a soft brush was used to gently break up clay clumps that did not sufficiently disintegrate during tumbling.
Oxygen isotopes in foraminifera largely record ice volume, temperature, and salinity, but they can also vary systematically by size fraction, in response to physiological effects, like the presence or absence of symbionts, as well as their depth habitat, seasonality, and stage in the reproductive cycle (Erez Reference Erez1978; Bemis et al. Reference Bemis, Spero, Bijma and Lea1998; Spero Reference Spero1998; Ezard et al. Reference Ezard, Edgar and Hull2015). To determine the most representative size fraction, stable isotopes were analyzed from Uvigerina sp., Cibicidoides sp., Globigerina bulloides, Neoglobigerina pachyderma, and Neoglobigerina incompta (formerly Neoglobigerina pachyderma dextral) in different size fractions on a Thermo Delta V Plus equipped with a Kiel IV individual acid bath device at LDEO. Although no size fractionation of oxygen isotopes was observed in N. pachyderma, G. bulloides, or Cibicidoides sp., Uvigerina sp. demonstrates a positive size relationship, in which δ18O increases with increasing size fraction, and N. incompta exhibits the opposite size relationship (see supplementary Figure 1). These results inform the size fraction that would be the best compromise between the diverse size fraction trends and the economies of picking foraminifera from larger (e.g., more massive) sizes. All subsequent δ18O data presented here were picked from the 250–300 μm fraction, approximately the midpoint of the Uvigerina sp. and N. incompta size trends, and a size range in which generally fewer than 10 tests are sufficiently massive for isotopic analysis. Analyses of benthic species generally utilized 2–3 individuals, while analyses of planktonic species were based on 8–12 individuals. Although a greater number of individuals (preferably 30+) would provide greater confidence in capturing a normal distribution of values that would better represent the population, analyzing such large numbers of foraminifera was precluded by relatively low foraminiferal abundance. More than 50% of the samples had less than 10% coarse fraction, reflecting the generally poor carbonate preservation of the region.
Foraminiferal assemblage counts were conducted on core 13MC at select sediment intervals. An average of 560 individuals were counted from unbiased sediment splits of the 250–300 μm fraction for Uvigerina sp., Cibicidoides sp., G. bulloides, N. pachyderma, N. incompta, G. ruber, other unspecified planktic foraminifera, and other unspecified benthic foraminifera to recreate the population of foraminifera present in the sediment. These census counts allow the calculation of relative abundances (e.g., % G. bulloides of all planktic species), concentrations (e.g., # G. bulloides specimens/g sediment), and burial fluxes (e.g., # G. bulloides specimens/ cm2 kyr).
Radiocarbon Analyses
Radiocarbon dates (n=29) from the five sediment cores were analyzed, using 300–500 tests of either G. bulloides or N. incompta. While G. bulloides was present in samples from all depths, the relative abundance of N. incompta increased towards the coretop. In cores 06MC and 10MC, only N. incompta had sufficient mass in the shallowest sample for the 14C analyses, while only G. bulloides had sufficient mass for the deeper samples. In core 13MC, each sample depth except the deepest provided sufficient mass to analyze both G. bulloides and N. incompta for 14C. All samples for 53MC are from G. bulloides. Analyses were performed at the National Ocean Sciences Accelerator Mass Spectrometry Facility at Woods Hole Oceanographic Institution. 14C ages were calibrated to calendar years using Calib 7.0 Marine13 (Stuiver and Reimer Reference Stuiver and Reimer1993; Reimer et al. Reference Reimer2013) with a total reservoir correction of 800 yr (ΔR=400).
Total Particle Flux Analyses
Total particle flux calculations were determined using 230Th normalization, as detailed by Costa and McManus (Reference Costa and McManus2017). Briefly, samples were analyzed for thorium (230Th, 232Th) and uranium (238U, 235U, 234U) by isotope dilution inductively coupled plasma mass spectrometry following complete acid digestion and column chromatography (Fleisher and Anderson Reference Fleisher and Anderson2003). Unsupported 230Th was isolated by correcting for lithogenic and authigenic uranium decay (Henderson and Anderson Reference Henderson and Anderson2003), and the initial deposition concentration was calculated by correcting for 230Th decay (half-life of 75,584 yr; Cheng et al. Reference Cheng2013). The short residence time of 230Th (20–40 yr; Nozaki et al. Reference Nozaki, Horibe and Tsubota1981) translates into nearly all of the 230Th produced by uranium decay in seawater being removed locally to sediments by scavenging. Therefore, the concentration of excess 230Th in the underlying sediment is primarily a function of the particle flux, such that higher particle flux will dilute the excess 230Th concentration in the sediment. The particle flux can be calculated as the integrated 230Th production in the overlying water column divided by the concentration of excess 230Th in the sediment corrected for decay since deposition (Bacon Reference Bacon1984; McManus et al. Reference McManus, Anderson, Broecker, Fleisher and Higgins1998; Henderson and Anderson Reference Henderson and Anderson2003; Francois et al. Reference Francois, Frank, Rutgers van der Loeff and Bacon2004). Comparing the burial inventory of 230Th with the inferred production of 230Th in the overlying water column reflects the degree of sediment focusing (Ψ) during the period of sediment deposition (Suman and Bacon Reference Suman and Bacon1989).
RESULTS
Oxygen Isotopes and Foraminiferal Assemblage
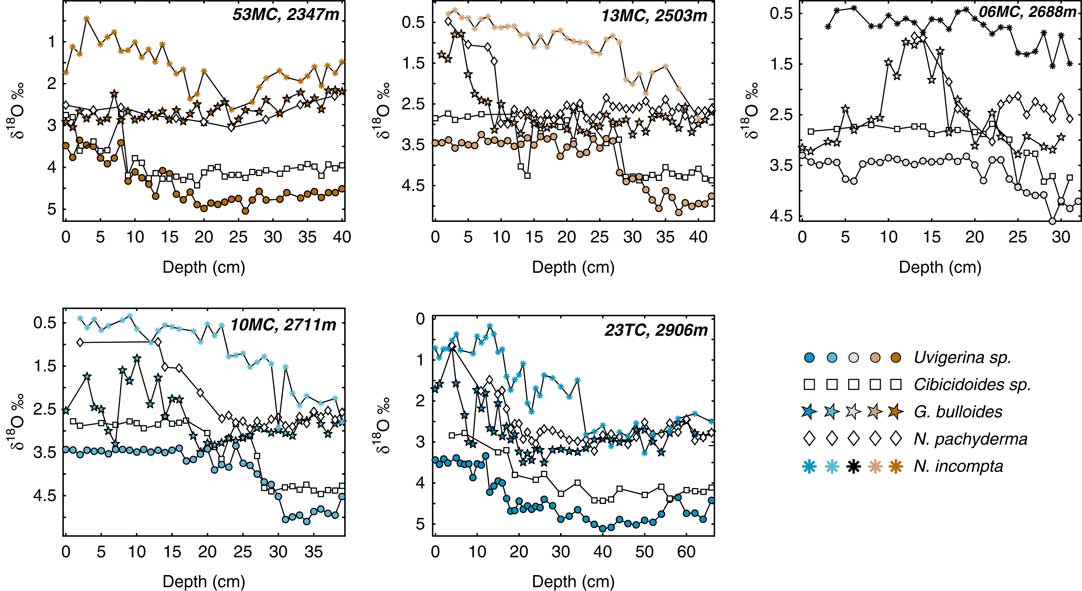
Oxygen isotope records (Uvigerina sp., Cibicidoides sp., G. bulloides, N. pachyderma, N. incompta) are presented for each core in Figure 2. Reproducibility based on complete replicate samples averages 0.23‰ for all species. The benthic δ18O records (Uvigerina sp., Cibicidoides sp.) largely correspond to the global trend that reflects changes in ice volume and temperature associated with the last deglaciation (Lisiecki and Stern Reference Lisiecki and Stern2016). The deepest samples reach glacial values (4.5–5‰, Uvigerina sp.) while shallower coretop values (3.5–4‰, Uvigerina sp.) are more consistent with an interglacial (Holocene) period. No water depth dependent isotope effect is apparent, and the absolute values as well as the temporal trends in Uvigerina sp. δ18O are equivalent across all five cores. Oxygen isotopes from Cibicidoides sp. are generally well correlated with those of Uvigerina sp. (r 2=0.73) with an average offset of –0.52‰, slightly less than the widely applied offset of –0.64‰ (Shackleton Reference Shackleton1973) but consistent with a relatively low offset (–0.4 to –0.5‰) previously observed in North Pacific sediments (Keigwin Reference Keigwin1998). Furthermore, recent re-evaluation of Cibicidoides and Uvigerina δ18O suggests that the global offset may be closer to –0.47±0.04‰ (Marchitto et al. Reference Marchitto, Curry, Lynch-stieglitz, Bryan, Cobb and Lund2014).
Oxygen isotope records for Uvigerina sp., Cibicidoides sp., G. bulloides, N. pachyderma, and N. incompta for each of the five cores. Symbols are as shown in the legend, but color-coded for each individual core. Errors (not shown for clarity) are based on replicated analyses (n values): 0.21‰ for Uvigerina sp. (n=98), 0.16‰ for Cibicidoides sp. (n=50), 0.25‰ for G. bulloides (n=57), 0.30‰ for N. pachyderma (n=29), and 0.25‰ N. incompta (n=67). (Color refers to online version.)

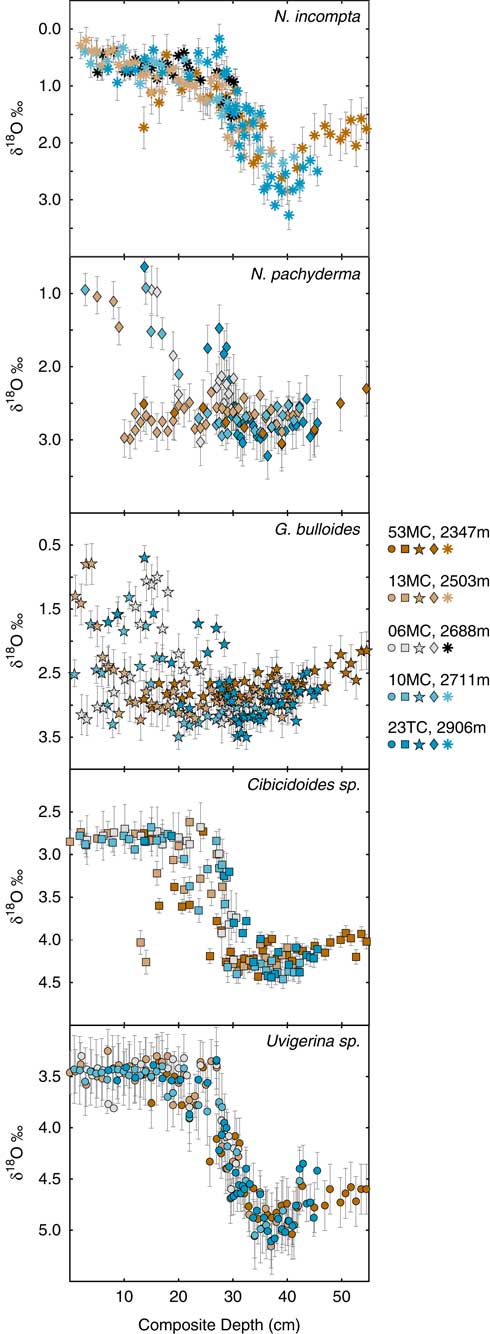
The robust glacial-interglacial transition in the Uvigerina sp. data facilitates the stratigraphic alignment of the five cores independent of any age assignment. The Uvigerina sp. δ18O were graphically correlated onto a single “composite” depth scale (Figure 3), and the depth alignment was then applied to the other isotope records. Comparisons of core depths with composite depths are provided in supplementary Figure 2. Core 13MC was used as a reference due to its clear glacial-Holocene transition and its relatively stable sedimentation rate. The composite depths of 53MC are shifted ~15 cm deeper than the core depths, but other adjustments to align 53MC with 13MC amount to small (≤1%) deviations in the original age/depth relationship. The first 20 cm of 06MC are identical (±3%) in core depth and composite depth, while deeper samples are compressed onto the composite deglacial depth trend. Aligning 10MC depth to the composite depths requires only minor adjustments on the order of ±7%, primarily in the older part of the core. The higher sedimentation rate in 23TC requires a more substantial change in the depth domain to align it with the composite depths. The first 12 cm of 23TC are shifted downwards by 7 cm and then stretched by a factor of 2/3. The rest of the core is then compressed by a factor of 2/3 in order to align the Uvigerina sp. δ 18O with those on the composite depth scale. The fidelity of these alignments is corroborated by the small range in Uvigerina sp. δ18O variability at any one composite depth interval (Figure 3). A glacial-interglacial transition is also defined by the composite Cibicidoides sp. δ18O record, but a few glacial type values appear up to 10 cm composite depth for this species. The coherency of the δ18O of these benthic species amongst the five cores is likely a function of the relatively low but stable benthic foraminiferal flux over the time interval investigated in this study.
Oxygen isotope records on a composite depth scale, aligned based on the δ18O of Uvigerina sp. The small inter-core variability in δ18O of Uvigerina sp. as well as N. incompta indicates the stratigraphic integrity on a regional scale. Composite δ18O records of Cibicidoides sp., G. bulloides, and N. pachyderma demonstrate increasing degrees of variability between the five cores. Error bars reflect the 2σ of replicate analyses.

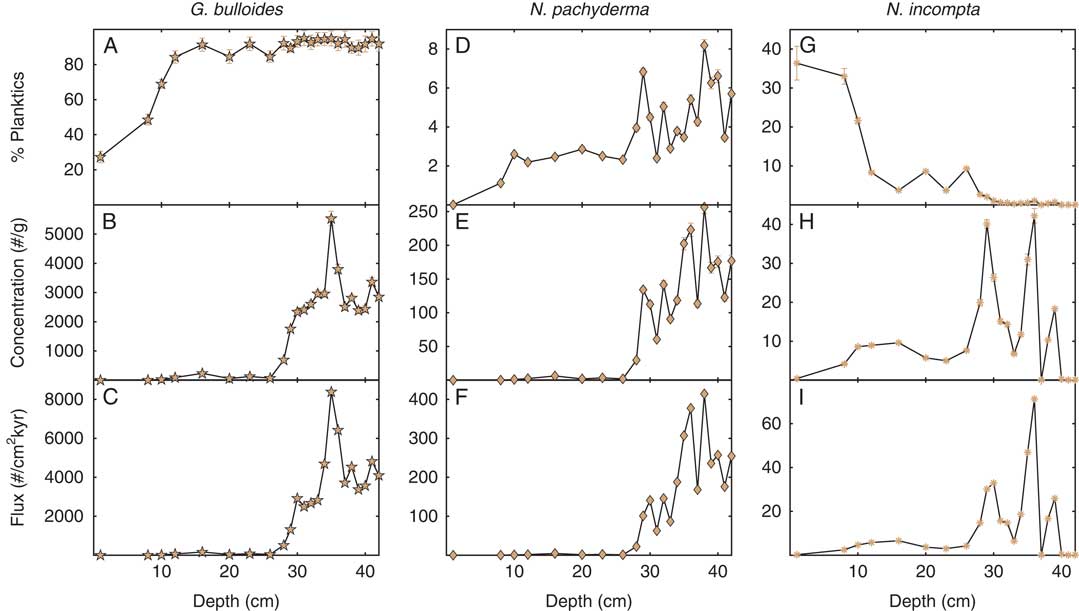
Planktonic δ18O records (G. bulloides, N. pachyderma, N. incompta) show considerable interspecies variability. Of the three species, only N. incompta demonstrates a clear glacial to Holocene transition (Figure 3), and thus its temporal trend mimics those of the benthic species (r2=0.70 with Uvigerina sp.; r 2=0.59 with Cibicidoides sp.). Deep samples have higher δ18O (2.5–3‰) while shallower coretop samples have lower δ18O (0–1‰). In 13MC (2503 m) the N. incompta proportion of the sediment assemblage increases at shallower depths, from less than 1% up to 36% of all planktic species (Figure 4G). There are several peaks in concentration and flux at 29 cm, 36 cm, and 39 cm, but the variability is small, just one order of magnitude (Figure 4H and 4I).
Foraminiferal assemblage of core 13MC. Top panels (A, D, G) show the relative composition of the total planktic population. For most of the sedimentary record, G. bulloides is the dominant (>85%) planktic species (A). In coretop samples, N. incompta becomes an important species in the sediment assemblage as well (G). Error bars reflect 1σ uncertainty derived from counting statistics of the total number of specimens identified. Middle panels (B, E, H) show the total concentration of each species per gram of sediment (dry weight). Note the different scales on the y-axis for each species. Bottom panels (C, F, I) show the 230Th-normalized total flux of each species. Again, note the different scales on the y-axis for each species.

Oxygen isotopes from neither G. bulloides nor N. pachyderma adhere to the expected deglacial changes in ice volume and temperature, as demonstrated by the benthic species and N. incompta, although poor recovery of N. pachyderma in shallower sediments may contribute to this appearance (Figure 3). N. pachyderma is a relatively minor component of the sediment assemblage, ranging from 0 to only 8.2% of the burial population (Figure 4D). G. bulloides, on the other hand, is the dominant species throughout most of the sedimentary record: it makes up greater than 85% of the planktic species up until 12 cm, after which its relative abundance decreases as N. incompta abundance rises (Figure 4A). Despite comprising a small percentage of the population, N. pachyderma achieves concentrations and fluxes that span over two orders of magnitude, reaching values as high as 257 specimens/g and 414 specimens/ cm2 kyr at 38 cm, and reflecting a general decline in flux towards shallower depths (Figures 4E and 4F). G. bulloides shows the greatest variability, so that even while it is comprising the majority of the planktic assemblage, its concentration and flux range over three orders of magnitude (Figures 4B and 4C). It shows a similar declining flux towards shallower depths as N. pachyderma, and there is a single clear abundance peak in G. bulloides at 35 cm with a concentration of 5530 specimens/g and a flux of 8390 specimens/cm2 kyr.
There is also a strong isotopic trend with water depth for G. bulloides and N. pachyderma. The shallowest core, 53MC (2347 m), shows almost no change in δ18O in these species over the entire core: N. pachyderma ranges from 2.3 to 3.0‰ while G. bulloides ranges from 2.2 to 3‰, with no defined temporal trend (Figure 3). In core 13MC (2503 m), both species show a relatively abrupt decrease from glacial (2.5–3.5‰) to interglacial (1–1.5‰) values, but this shift occurs substantially shallower (5–10 cm) than the corresponding shift in benthic and N. incompta δ18O values (25–35 cm). In core 06MC (2688 m), the two species show an intermediate depth minimum around 10–15 cm, where the δ18O values decrease by more than 1‰ from 2.5–to 3‰ to 1–1.5‰ (Figure 2). No corresponding δ18O shift is observed in the benthic δ18O records in this sediment interval. G. bulloides then returns to the deeper, higher δ18O values (2.5–3‰) in the coretop, but the absence of N. pachyderma in this interval prevents secondary confirmation of this trend. Core 10MC (2711 m) is at an almost equivalent water column depth as 06MC, but it contains a temporal trend more similar to 13MC than to 06MC. Both G. bulloides and N. pachyderma show glacial values (2.5–3.0‰) in deeper sediments, and G. bulloides shows some indication of interglacial values (1–1.5‰) near the core top. Again this shift to interglacial values occurs shallower (10–20 cm) than the corresponding shift in benthic and N. incompta δ18O values (25–30 cm). The deepest core, 23TC (2906 m), is the only one to demonstrate any temporal coherence between G. bulloides and N. pachyderma and the benthic species. The planktonic species show a decrease from glacial type values (2.5–3.5‰) to interglacial type values (1–2‰). This transition (5–20 cm) starts later than the corresponding shift in the benthics (10–40 cm), but it at least overlaps the same interval.
Radiocarbon Ages
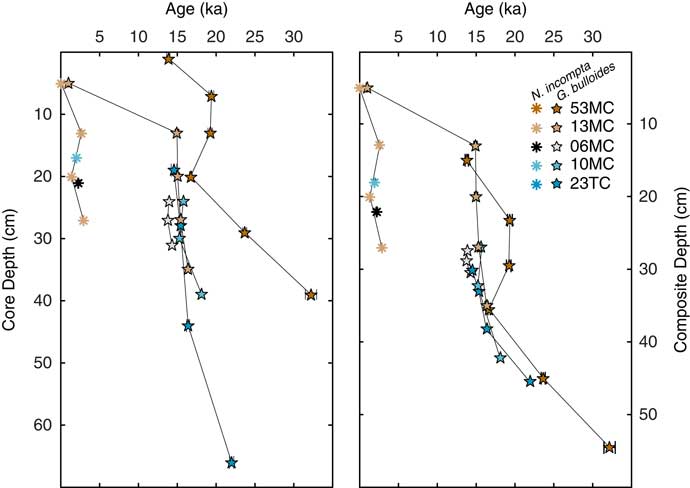
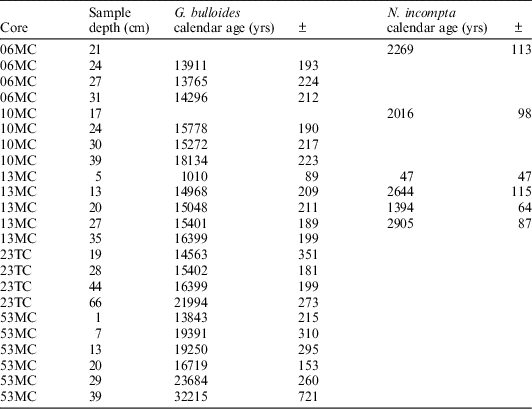
The ages derived from 14C dating generally increase with increasing depth in the sediment core, with the youngest age (~50 yr) occurring at 5 cm depth (13MC) and the oldest age (~32 ka) occurring at 39 cm depth (53MC) (Table 1, Figure 5). However, this overall pattern is not manifested as the characteristic monotonic increase in age with depth. Instead, nearly all cores show a plateau region with multiple depths returning the same age. For N. incompta, this plateau occurs ~2–2.5 ka from 5–30 cm composite depth, while for G. bulloides this plateau occurs ~15–16 ka from 12–35 cm composite depth. These plateaus occur simultaneously in the depth domain within each core, suggesting a nearly 12,000-yr difference in age between foraminiferal species found within the same sedimentary horizon.
14C-based ages versus depth profiles for the five sediment cores. All ages are presented as calendar years. Legend applies to both panels, with data shown on individual core depths on the left and composite depth (see Figure 3) on the right.

Samples analyzed for radiocarbon ages, presented as reservoir corrected calendar ages.

In sediment older than the plateau age, a more typical trend of increasing age with depth develops in G. bulloides (Figure 5). In 23TC, this trend suggests a sedimentation rate of 3.93 cm/kyr, which is about three times greater than the sedimentation rate calculated at 53MC (1.23 cm/kyr), although both are generally consistent with the range of sedimentation rates previously observed in the piston cores from this location (Costa et al. Reference Costa, McManus, Boulahanis, Carbotte, Winckler, Huybers and Langmuir2016). Higher sedimentation rates at 23TC are not unexpected given its location within a bathymetric low where sediment focusing would preferentially accumulate material. When the 14C-based ages are adjusted onto the composite depth scale, the cores give almost identical sedimentation rates (1.23 cm/kyr at 53MC and 1.29 cm/kyr at 23TC; Figure 5, 35–50 cm composite depth).
Age Model
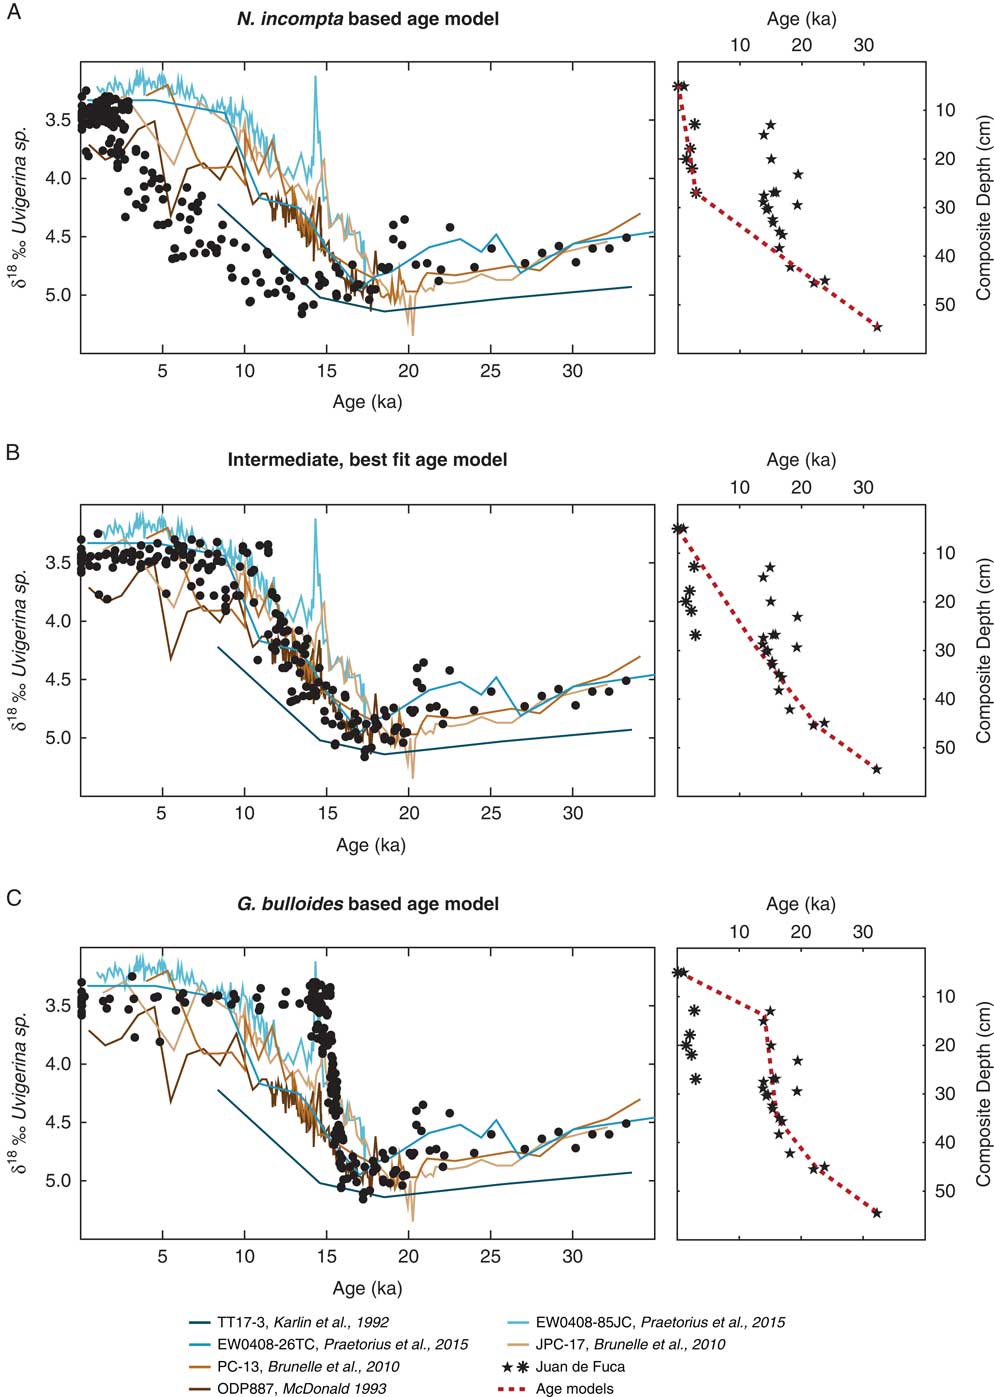
Because of the irreconcilable differences between the 14C results from the two foraminiferal species, a direct generation of a 14C-based age model is not straightforward. There is no a priori justification for trusting the N. incompta ages over the G. bulloides ages, or vice versa. Instead, a range of different 14C-based age models were applied to the composite Uvigerina sp. δ18O record to construct the best fit correspondence with other deglacial δ18O records from the Northeast Pacific (Karlin et al. Reference Karlin, Lyle and Zahn1992; McDonald Reference McDonald1993; Brunelle et al. Reference Brunelle, Sigman, Jaccard, Keigwin, Plessen, Schettler, Cook and Haug2010; Praetorius et al. Reference Praetorius, Mix, Walczak, Wolhowe, Addison and Prahl2015).
Utilizing monospecific 14C results defines two endmember age models (Figure 6). The first incorporates only the N. incompta ages for the top 20 cm, and then it transitions to the G. bulloides ages when N. incompta ages are no longer available (Figure 6A). This age-versus-depth evolution would require an extreme shift in sedimentation rates at 2.9 ka from 0.94 cm/kyr to 7.79 cm/kyr. The resulting isotopic record contains a deglacial transition in Uvigerina sp. δ18O that occurs much too late compared to the regional records, starting at ~10 ka and reaching interglacial type δ18O only at the very core top. The second endmember age model employs only the G. bulloides dates (Figure 6C), and it requires two extreme shifts in sedimentation rates: from 1.20 cm/kyr to 10.5 cm/kyr at 16 ka and then from 10.5 cm/kyr back down to 0.64 cm/kyr at 14 ka. The resulting δ18O record includes a deglacial transition that occurs too abruptly at ~15 ka relative to the other regional records.
Age model generation. Right panels present 14C data from G. bulloides (stars) and N. incompta (asterisks), as in Figure 4, with age models identified by dashed red lines. All ages are presented as calendar years, and depths are composite depth, as in Figure 3. Left panels show the results of applying the various age models to the composite δ18O of Uvigerina sp. from the JdFR (black dots). The resulting progression of δ18O with age was compared with that of other regional records (Karlin et al. Reference Karlin, Lyle and Zahn1992; McDonald Reference McDonald1993; Brunelle et al. Reference Brunelle, Sigman, Jaccard, Keigwin, Plessen, Schettler, Cook and Haug2010; Praetorius et al. Reference Praetorius, Mix, Walczak, Wolhowe, Addison and Prahl2015) in order to evaluate the success of each age model.

Instead we find that an intermediate age model provides the best fit of the composite Uvigerina sp. δ18O record to the regional δ18O records (Figure 6B). This age model also eliminates the necessity of an abrupt or extreme change in sedimentation rate, with a relatively modest increase from 0.93 cm/kyr to 1.80 cm/kyr at 22.5 ka. These sedimentation rates are within the limits observed within the piston cores from this region (Costa et al. Reference Costa, McManus, Boulahanis, Carbotte, Winckler, Huybers and Langmuir2016). However, this best fit age model does imply that in fact neither the G. bulloides nor the N. incompta 14C ages reflect the actual age of the sediment. This presents the conundrum of how to explain, for example, the simultaneous 2 ka age of N. incompta, 6 ka of the sediment, and 15 ka age of G. bulloides.
Total Particle Flux
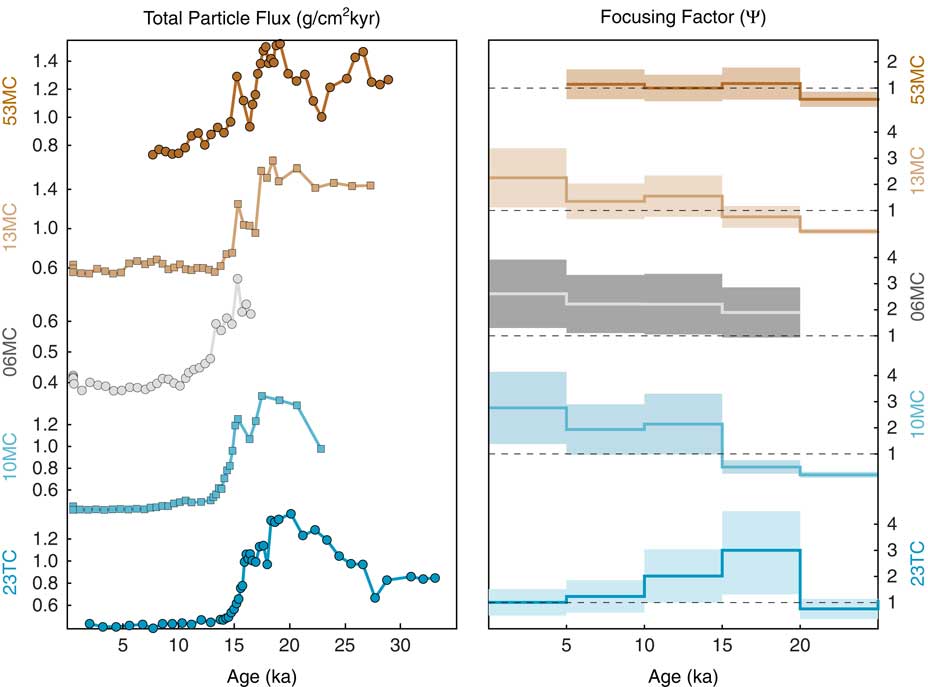
The 230Th based total particle fluxes show a coherent pattern of maximum values during the last glacial period and minimum values during the Holocene across all five cores (Figure 7, left). The last glacial period averages 1.35 g/cm2 kyr, while the average Holocene flux is nearly 2/3 lower at just 0.51 g/cm2 kyr. Fluxes are highest at the shallowest core, 53MC, and lowest at the deepest core, 23TC. This trend is most readily apparent in the Holocene, with particle flux decreasing from 0.75 g/cm2 kyr at 53MC (2347 m), 0.60 g/cm2 kyr at 13MC (2503 m), 0.43 g/cm2 kyr at 10MC (2711 m), and 0.40 g/cm2 kyr at 23TC (2906 m). The transition from the high particle flux glacial period into the low particle flux Holocene occurs fairly abruptly, but it is interrupted by a brief return to higher fluxes ~15–16 ka, possibly reflecting the expected deglacial maximum in CaCO3 preservation (Mekik et al. Reference Mekik, Anderson, Loubere, François and Richaud2012).
Total particle fluxes (left) and focusing factors (right). Total particle fluxes decrease by about 2/3 from the LGM to the Holocene, and Holocene fluxes are water depth dependent with the highest fluxes at 53MC and the lowest fluxes at 23TC. Error bars show 2σ when larger than symbol size. Focusing factors record the relative input of laterally redistributed sediment. Values greater than 1 indicate sediment focusing, or substantial lateral contributions of sediment. Values less than 1 indicate sediment winnowing, or post-depositional removal of sediment. Shaded regions show the error envelopes assuming a conservative estimate of 50% error in the age assignment.

All cores display an increase in sediment focusing over the past 30 kyr, with the exception of 23TC, although uncertainties in the age models create large error envelopes (Figure 7, right). Sediment focusing peaks in core 23TC (Ψ=2.67) during the early deglaciation (15–20 ka), and then focusing gradually decreases down to unity by the late Holocene. With the exception of 06MC, average sediment focusing over the full 30 kyr period is inversely dependent on water depth: Ψ=0.73 at 53MC (2347 m), Ψ=1.01 at 13MC (2503 m), Ψ=1.47 at 10MC (2711 m), and Ψ=1.53 at 23TC (2906 m). Core 06MC contains anomalously high sediment focusing (Ψ=2.11 on average) for its water depth (compared to 10MC), but this feature is consistent with increasing sediment focusing observed near the coretop of the corresponding piston core, AT26-19-09PC (Costa and McManus Reference Costa and McManus2017), indicating a localized sediment focusing effect. All multi-cores that reach the last glacial period show winnowing at that time in this mid-latitude study area, in contrast to evidence that suggests that high sediment focusing may have characterized glacial sediment deposition in the Equatorial Pacific (Marcantonio et al. Reference Marcantonio, Anderson, Higgins, Stute, Schlosser and Kubik2001; Higgins et al. Reference Higgins, Anderson, Marcantonio, Schlosser and Stute2002; Kienast et al. Reference Kienast, Kienast, Mix, Calvert and François2007; Mitchell and Huthnance Reference Mitchell and Huthnance2013).
DISCUSSION
Without sediment mixing, age versus depth profiles should reflect a monotonic increase with depth at a slope equivalent to the mean sedimentation rate. Bioturbation interrupts this trend by homogenizing a range of sedimentary horizons into a single unit, which can create an age plateau in the surface mixed layer. Besides bioturbation, there are many non-chronological processes that may also influence 14C ages (Mekik Reference Mekik2014), especially in low sedimentation rate sites like the JdFR. Chemical erosion (Keir Reference Keir1984), interface dissolution (Broecker et al. Reference Broecker, Klas, Clark, Bonani, Ivy and Wolfli1991; Keir and Michel Reference Keir and Michel1993), and secondary calcification in the sediment (Broecker et al. Reference Broecker, Mix, Andree and Oeschger1984, Reference Broecker, Klas, Clark, Trumbore, Bonani, Wolfli and Ivy1990, Reference Broecker, Clark, Lynch-Stieglitz, Beck, Stott, Hajdas and Bonani2000, Reference Broecker, Barker, Clark, Hajdas and Bonani2006; Barker et al. Reference Barker, Broecker, Clark and Hajdas2007) may bias all foraminiferal 14C dates simultaneously, regardless of species. Habitat depth differences (Waelbroeck et al. Reference Waelbroeck, Duplessy, Michel, Labeyrie, Paillard and Duprat2001), abundance variations (Manighetti et al. Reference Manighetti, McCave, Maslin and Shackleton1995; Barker et al. Reference Barker, Broecker, Clark and Hajdas2007), differential dissolution and fragmentation (Barker et al. Reference Barker, Broecker, Clark and Hajdas2007), degree of ontogenetic encrustation (Kozdon et al. Reference Kozdon, Ushikubo, Kita, Spicuzza and Valley2009), sediment remobilization (Broecker et al. Reference Broecker, Barker, Clark, Hajdas and Bonani2006; Barker et al. Reference Barker, Broecker, Clark and Hajdas2007), and morphologically dependent bioturbation (Peng and Broecker Reference Peng and Broecker1984) can dissociate 14C ages of different species within the same sediment interval. Age offsets between foraminiferal species are generally no more than 1–3 kyr, but larger 14C offsets on the order of 10 kyr have been observed between alkenones and foraminifera (Ohkouchi et al. Reference Ohkouchi, Eglinton, Keigwin and Hayes2002; Mollenhauer et al. Reference Mollenhauer, Eglinton, Ohkouchi, Schneider, Muller, Grootes and Rullkötter2003, Reference Mollenhauer, Kienast, Lamy, Meggers, Schneider, Hayes and Eglinton2005, Reference Mollenhauer, McManus, Benthien, Müller and Eglinton2006, Reference Mollenhauer, McManus, Wagner, McCave and Eglinton2011; Uchida et al. Reference Uchida, Shibata, Ohkushi, Yoneda, Kawamura and Morita2005), between foraminiferal species within extremely bioturbated zoophycos channels (Löwemark and Werner Reference Löwemark and Werner2001; Leuschner et al. Reference Leuschner, Sirocko, Grootes and Erlenkeuser2002; Löwemark and Grootes Reference Löwemark and Grootes2004), and between frosty and glassy tests of variably preserved foraminifera of the same species (Wycech et al. Reference Wycech, Clay Kelly and Marcott2016).
On the JdFR, the ~12 kyr offset between N. incompta and G. bulloides in the upper 30 cm coincides with simultaneous age plateaus in each species: nearly all the N. incompta ages are between 2–3 ka while all but the shallowest G. bulloides ages are 15–16 ka. The severe age discrepancy combined with this age plateau may eliminate some of the aforementioned discriminating processes as improbable. In even the most extreme habitat comparison, planktic versus benthic, 14C differences between foraminiferal species only achieve 3 kyr offsets at most (Broecker et al. Reference Broecker, Mix, Andree and Oeschger1984; Keigwin and Schlegel Reference Keigwin and Schlegel2002; Skinner and Shackleton Reference Skinner and Shackleton2004; Barker et al. Reference Barker, Broecker, Clark and Hajdas2007; Lund et al. Reference Lund, Mix and Southon2011). Ontogenetic encrustation in one species but not the other could cause an age offset but would be unlikely to return constant ages over such a large depth range, and the nearly identical average shell weights for the two species (12.2 μg for G. bulloides and 12.1 μg for N. incompta) may not be consistent (Lohmann Reference Lohmann1995; Broecker and Clark Reference Broecker and Clark2001) with this process favoring only one species (supplementary Figure 3). Preferential remobilization and bioturbation of the more rounded G. bulloides tests may contribute to the age plateau in that species (Figure 5, 5–30 cm composite depth), but a preference for G. bulloides would not explain why the same outcome at a different age is observed in the N. incompta data as well (Figure 5, 10–40 cm composite depth). Similarly, G. bulloides may be more susceptible to partial dissolution than N. incompta (Berger Reference Berger1970), which may contribute to the older ages for G. bulloides (Wycech et al. Reference Wycech, Clay Kelly and Marcott2016) and the relatively constant age offset between N. incompta and G. bulloides, but the age plateau would require an anomalously large mixing depth of ~30 cm, considerably deeper than the global average 6–16 cm (Broecker et al. Reference Broecker, Klas, Clark, Bonani, Ivy and Wolfli1991). Although these processes may contribute an ancillary influence on the age offset and age plateaus, the probability of manifesting these features is greatly increased when changes in foraminiferal assemblage and concentration, specifically an abundance peak of N. incompta at 2.5 ka and G. bulloides at 15–18 ka, are also considered (Ruddiman et al. Reference Ruddiman, Molfino, Esmay and Pokras1980; Ruddiman and McIntyre Reference Ruddiman and McIntyre1981).
The relatively young age plateau in N. incompta around 2.5 ka is consistent with its increasing dominance of the planktic foraminiferal pool at shallower sediment depths. This shift towards N. incompta during the Holocene reflects its preferred habitat for relatively warmer waters than its other subpolar counterparts (Be and Tolderlund 1971; Coulbourn et al. Reference Coulbourn, Parker and Berger1980; Žarić et al. Reference Žarić, Donner, Fischer, Mulitza and Wefer2005; Darling and Wade Reference Darling and Wade2008). In a spatial assessment of modern coretops from the North Atlantic, the sediment assemblage shifts from N. pachyderma dominated to N. incompta dominated south of the 7.2ºC isotherm (Ericson Reference Ericson1959; Pflaumann et al. Reference Pflaumann2003). A similar shift in assemblage is observed in response to warming temperatures during the deglaciation in the Northeast Pacific, with declining abundance of N. pachyderma in the coretop sediment coincident with the development of a more favorable habitat for N. incompta (Figure 3). The young age for the N. incompta plateau may be associated with the local maxima in absolute abundance around 12–15 cm, which has likely been bioturbated up and down the core. G. bulloides, unlike N. incompta, can thrive under a much wider range of environmental conditions (Be and Tolderlund 1971; McManus et al. Reference McManus, Anderson, Broecker, Fleisher and Higgins1998, Reference McManus, Oppo and Cullen1999; Oppo et al. Reference Oppo, McManus and Cullen1998; Pflaumann et al. Reference Pflaumann2003; Darling and Wade Reference Darling and Wade2008), as evidenced by its sustained abundance in all but the very core top samples. The transition from glacial to interglacial climate does not spontaneously optimize the growth conditions for G. bulloides, and the concentration only begins to drop off in the late Holocene when corrosive bottom waters more insistently dissolve the rather fragile G. bulloides tests (Berger Reference Berger1970). Peaks in G. bulloides flux at ~15 ka (30 cm) and ~18 ka (35 cm) occur simultaneously with peaks in both N. pachyderma and N. incompta, suggesting an increase in carbonate preservation at these times (Mekik et al. Reference Mekik, Anderson, Loubere, François and Richaud2012) rather than particularly favorable conditions for G. bulloides alone. However the sheer magnitude of the ~18 ka (35 cm) abundance peak, nearly double the average flux of the last glacial period and over 1000× the flux of the Holocene (Figure 3, left), suggests that bioturbation of this peak has contributed to the relatively old age plateau ~15 ka in G. bulloides.
Sediment Mixing Model
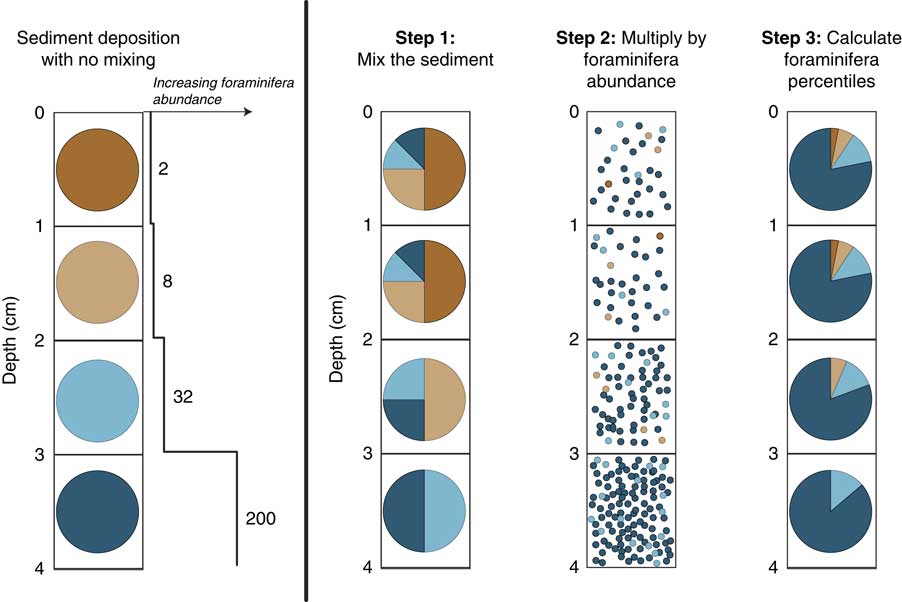
To assess the evolution of sediment mixing over the past 30 kyr, an iterative mixing model was designed and optimized to the results previously described. The model focuses on core 13MC from which the greatest number of 14C dates (n=9) is available and for which full assemblage counts were conducted. The first step of the model is to mix the sediment units over a mixed layer depth parameterized as a Tukey window (Figure 8, Step 1). A sediment unit is deposited with the initial conditions of 100% contemporaneous sediment (e.g., the 15 cm sediment unit contains 100% sediment from 15 cm), and after mixing, each unit contains a spectrum of different sedimentary units (e.g., the 15 cm sediment unit may contain 10% sediment originally from 35 cm). This process is repeated with each new sedimentary layer until the top of the sediment core is reached, generating a matrix of varying sediment assemblages with depth.
Schematic example of the sediment mixing model. Consider 4 cm of sediment composed of four 1-cm layers with decreasing foraminiferal abundance over time. With no sediment mixing, each sediment layer will contain 100% of its original sediment deposited during that time interval. The change in foraminiferal abundance (two orders of magnitude) is similar to that observed for N. pachyderma in the Juan de Fuca cores. In Step 1, the sediment is mixed assuming complete mixture in a 2 cm mixed layer from the bottom to the top. For example, after mixing, the sedimentary layer from 2–3 cm contains 50% sediment originally from 1–2 cm (light orange), 25% of its own original sediment (2–3 cm, light blue), and 25% sediment originally from 3–4 cm (dark blue). In Step 2, the sediment distributions determined at the end of Step 1 are multiplied by the foraminiferal abundance in each of those sedimentary units to determine the number of foraminifera (circles) contributed by each layer. For example, the sedimentary layer from 2–3 cm contains 4 foraminiferal tests from 1–2 cm (light orange), 8 foraminiferal tests from 2–3 cm (light blue), and 50 foraminiferal tests originally from 3–4 cm (dark blue). In Step 3, the foraminiferal assemblage from Step 2 is divided by the total number of foraminifera in each layer in order to generate foraminiferal percentiles. For example, the foraminifera in the 2–3 cm layer originate 6.5% from 1–2 cm (light orange), 12.9% from 2–3 cm (light blue), and 80.6% from 3–4 cm (dark blue). The persistently abundant foraminifera from 3–4 cm (dark blue) easily overwhelm the younger foraminifera, and they demonstrate how an age plateau may arise as a result of changes in abundance. (Colors refer to online version.)

The sediment assemblage is then converted to a foraminiferal assemblage by correcting for the density and foraminiferal concentration differences between sedimentary layers (Figure 8, Step 2). Sediment density generally decreases from glacial to interglacial periods (Costa et al. Reference Costa, McManus, Boulahanis, Carbotte, Winckler, Huybers and Langmuir2016), and so sediment from deeper (glacial) sediment layers will contain more mass than sediment from shallower (interglacial) layers. Foraminiferal concentrations similarly decrease from glacial to interglacial samples (Figure 3). The model utilizes the (post-mixing) foraminiferal concentrations as depicted in Figure 4, without performing any manipulations to reconstruct the pre-mixing concentrations. While the calculated concentrations in Figure 4 represent the abundances post-mixing, the model uses them with the assumption that these concentrations would be proportional to the concentrations that would characterize the initial sediment unit pre-mixing. For example, if 10% of the sediment in an interval comes from 15 cm depth, which has a foraminiferal concentration of 100 specimens/g, then 10 specimens within that interval originated in the 15 cm sediment unit. The individual contributions of each sediment fraction could then be summed and divided by that sum to derive the percentile foraminiferal assemblages (Figure 8, Step 3). These percentile foraminiferal assemblages are not equivalent to the sediment assemblages but are instead heavily weighted towards the contributions from the far more abundant foraminifera within glacial sediment. For example, the 15 cm sediment unit may contain 10% sediment originally from 35 cm, but the high density and foraminiferal count in that 35 cm sediment might lead to a contribution of 30% of the foraminifera in the resulting sediment mixture. This glacial bias increases as the amplitude of the glacial-interglacial shift in foraminifera abundance increases, so that it affects G. bulloides more than N. incompta.
The model then utilizes the percentile foraminiferal assemblage for Monte Carlo simulation of the foraminifera selection (picking) process for 14C and stable isotope analyses. A random sample of 300 foraminifera for 14C or 10 foraminifera for stable isotopes are selected from the population and averaged to determine the resulting mean value. Age assignments for individual foraminifera were based on their original deposition interval (e.g. foraminifera from 35 cm would be 18 ka), while δ18O assignments were based on the Uvigerina sp. δ18O trend, scaled to match the range observed in each planktonic species. The random sampling process was repeated 1000 times to return the possible age and δ18O distributions at each sediment depth.
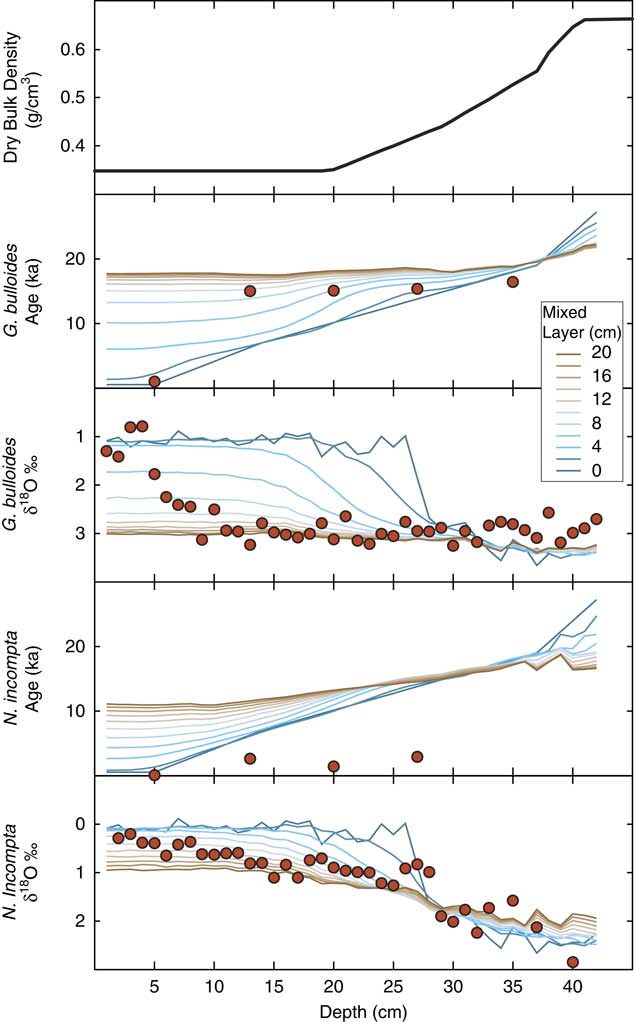
The model first assessed a range of constant mixing depths from 0 to 20 cm (Figure 9). All mixing depths greater than 3 cm generated an age plateau in G. bulloides that ranges from 10 to 18 ka, but none recreated the particularly prolonged and stable age plateau at 15 ka over ~25 cm of sediment, as observed in the data. Shallower mixing depths (0–7 cm) are better aligned with 14C data than the larger mixing depths, because the larger mixing depths sustain the abundant ~18 ka foraminifera through a greater range of the sediment column. Unfortunately, not even the 0 cm mixing depth (no mixing) simulation can recreate the very young N. incompta 14C ages, while even a very deep (30 cm) mixed layer fails to prolong an N. incompta age plateau down to 27 cm depth (supplementary Figure 4). This inconsistency between G. bulloides and N. incompta indicates that other processes in addition to the diffusive sediment mixing modeled here must be contributing the young N. incompta ages. In contrast to the 14C results, the δ18O records for G. bulloides and N. incompta instead present evidence in favor of larger mixing layers. Mixing layers that are less than 9 cm create a transition from glacial to interglacial conditions both too gradually and too early in the sediment record for both species. This disagreement between the 14C and δ18O records indicates that a single, constant mixing depth over the past 30 ka is improbable.
Simulation of foraminiferal age and δ18O profiles for G. bulloides and N. incompta from core 13MC using the iterative sediment mixing model (see Sediment Mixing Model section). Dry bulk density (top panel) interpolated from previously published records of piston cores from the same region as the multicores (Costa et al. Reference Costa, McManus, Boulahanis, Carbotte, Winckler, Huybers and Langmuir2016). Sediment was bioturbated upwards using a Tukey window, and then foraminiferal abundances were applied to determine the range of values within the foraminiferal assemblage at each depth. Foraminifera were randomly selected (n=300 for 14C, n=10 for δ18O) and averaged, and this sampling was repeated 1000 times to determine a representative value given the foraminiferal assemblage at each depth. Legend applies to all panels and identifies model output using constant mixed layers of different depths. Red dots indicate the actual data. (Color refers to online version.)

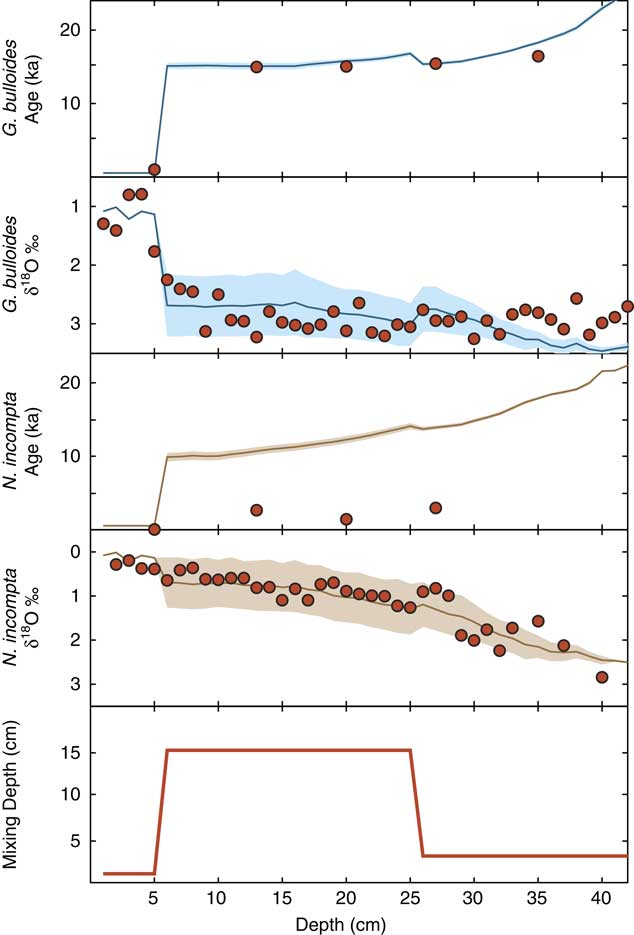
An improved fit for both the G. bulloides 14C and both species’ δ18O data can be obtained when the mixing depth is allowed to vary over the course of the depositional history (Figure 10). The optimization compromises between the earlier implications from 14C and δ18O by starting at a relatively small mixing layer (3 cm) during the glacial period followed by an abrupt transition to a large mixing layer (13–15 cm) at 24–25 cm and then returning to small mixing layers in the sediment coretop. The abrupt shift to higher mixing corresponds nominally to the early Holocene, and the timing and high magnitude are both necessary to delay the transition to interglacial values of δ18O in G. bulloides until after 10 cm and to maintain the 15 ka age plateau in G. bulloides up to at least 13 cm. The transition back to low mixing depths (≤2 cm) is required by no later than 5 cm in order to secure the young age (1 ka) of the G. bulloides at 5 cm depth. The δ18O values in N. incompta are less sensitive to one particular mixing depth over another, but they oblige the G. bulloides constraints with relative consistency to the model. Overall, an excellent agreement between the model and the G. bulloides ages and good agreements between the model and the stable isotope records can be achieved by employing a deeper mixed layer from 5–25 cm (nominally 0.5–12.7 ka).
Optimized conditions for the iterative sediment mixing model (see Figure 8 and Sediment Mixing Model section). Model outputs were calculated by employing the variation in mixing depth shown in the bottom panel. Shaded envelopes define 1σ of 1000 bootstrap sampling runs for the model output, and they are much wider for δ18O due to the smaller foraminiferal sample in the average (n=10) compared to age (n=300). Red dots indicate the actual data. The increase in mixing depth ~25 cm is necessary to prolong the 15 ka age plateau in G. bulloides to 13 cm depth. (Color refers to online version.)

While this simple model parameterizes the changes in mixing as discrete mixing depth intervals, changes in mixing could also be effected by varying the mixing rates (Peng et al. Reference Peng, Broecker and Berger1979; Demaster and Cochran Reference Demaster and Cochran1982; Cochran Reference Cochran1985). The model presented here assumes an infinite mixing rate within the mixed layer, perfectly homogenizing the sediment within that mixed layer, below which the mixing rate is zero. A more realistic transition might incorporate a depth gradient in mixing rate, and indeed more complex models of bioturbation may sometimes employ multiple mixed layers characterized by variable mixing rates (e.g., Benninger et al. Reference Benninger, Aller, Cochran and Turekian1979). The increase in mixing depth that emerges in the model used in this study could alternatively be interpreted as an equivalent increase in mixing rates, or a smaller increase in both mixing rate and mixing depth. Regardless, the model is capable of demonstrating how a change in mixing parameters can generate the particular nuances of the JdFR data, including the prolonged and stable age plateau in 14C as well as the delayed transition to interglacial δ18O values. Considering the limitations of the model, we therefore prefer the more generalized interpretation of the results as an increase in mixing “intensity” rather than specifically in terms of mixing depth.
Increased mixing intensity in the Holocene may not be inconsistent with N. incompta ages if secondary processes are also considered. In particular, underestimation of the coretop abundance of N. incompta may largely explain the model’s failure to reconstruct the young N. incompta age plateau. The model parameterizes the N. incompta abundance after the post-mixing concentrations counted in the sediment (Figure 4H), in which coretop abundances (0.4 specimens/g) are two orders of magnitude lower than the maximum abundances (40 specimens/g) at depth. If instead the coretop abundance (0–5 cm) were 300–500× greater, a deep mixing layer in the Holocene would indeed recreate the young N. incompta age plateau (supplementary Figure 5). This hypothetical evolution in N. incompta absolute abundance would mirror that of its relative abundance (Figure 4G), in which N. incompta becomes more dominant in the Holocene due to a more favorable (i.e., warmer) surface environment. Underestimation of the N. incompta abundance may be a result of preferential dissolution of the younger tests, while secondary precipitation of that calcite onto older N. incompta tests would retain the young 14C signature in the species. Why this mechanism would apply to N. incompta but not G. bulloides is unclear. Regardless, such a mechanism would imply the testable hypothesis that leached N. incompta tests from depth would return older ages, and the ongoing development of small sample size 14C analyses (Bush et al. Reference Bush, Santos, Xu, Southon, Thiagarajan, Hines and Adkins2013) may make this assessment feasible in the near future.
Possible Drivers of Changes in Mixing Intensity over the Last 30 kyr
A shift towards more intense sediment mixing in the Holocene suggests a corresponding amelioration of environmental conditions previously limiting mixing in the glacial period. This interval corresponds with a slight decrease in sediment focusing, at least in core 13MC, and terminates with a near doubling of sediment focusing at 5 ka. Sediment mixing intensity may be obscured by inverse changes in sedimentation rates, and a sudden increase in the lateral influx of sediment would require an increase in the mixing intensity in order to maintain the same level of temporal homogeneity of the sediment. For example, an 8 cm mixing depth of sediment that accumulates at 1 cm/kyr would result in sediment with an average age of ~3 ka. If that 8 cm mixing depth persisted as accumulation rates increased to 2 cm/kyr, then the average age of the sediment in the mixed layer would only be 1.4 ka. Without knowledge of changes in sediment influx, this shift in the mixed layer could instead be inferred as a decrease in the mixing depth from 8 cm to 4 cm. Thus, the decrease in mixing intensity inferred in the late Holocene may be partly a result of the increase in sediment focusing and sediment influx at this time, although further mechanisms are likely required to explain the large amplitude.
The benthic community may have provided the extra boost in sediment mixing from enhanced bioturbation in response to increased oxygen conditions. An increase in deepwater oxygen concentrations might increase the mixing by allowing aerobic heterotrophs to overturn deeper stratigraphic layers of sediment in search for food. Previous studies have identified hypoxic (low-oxygen) events during the Bolling-Allerod (15 ka) across the North Pacific (Zheng et al. Reference Zheng, Van Geen, Anderson, Gardner and Dean2000; Crusius et al. Reference Crusius, Pedersen, Kienast, Keigwin and Labeyrie2004; Cook et al. Reference Cook, Keigwin and Sancetta2005; Jaccard and Galbraith Reference Jaccard and Galbraith2012; Lam et al. Reference Lam, Robinson, Blusztajn, Li, Cook, M cmanus and Keigwin2013; Rae et al. Reference Rae, Sarnthein, Foster, Ridgewell, Grootes and Elliott2014; Praetorius et al. Reference Praetorius, Mix, Walczak, Wolhowe, Addison and Prahl2015) generally associated with a peak in productivity (Kohfeld and Chase Reference Kohfeld and Chase2011), but observations during the Holocene are sparse and somewhat contradictory. In the Gulf of Alaska, shallow water depths (<400 m) experience hypoxic events in the Bolling-Allerod and in the early Holocene, but deeper sites (<2000 m) demonstrate similarly oxygenated glacial and Holocene sediment (Praetorius et al. Reference Praetorius, Mix, Walczak, Wolhowe, Addison and Prahl2015). Relatively shallow waters (800 m) along the California Coast suggest oxygen levels may have been slightly lower in the Holocene than in the glacial period (Zheng et al. Reference Zheng, Van Geen, Anderson, Gardner and Dean2000), but deep waters (3300 m) in the Northwest Pacific show oxygen concentrations equal to or greater than that of the glacial period (Lam et al. Reference Lam, Robinson, Blusztajn, Li, Cook, M cmanus and Keigwin2013). Intermediate waters in the Northeast Pacific do not show a clear difference between oxygen conditions in the glacial period (20–22 ka) compared to the Early Holocene (5–10 ka) (Jaccard and Galbraith Reference Jaccard and Galbraith2012), when the model would predict the greatest change in mixing intensity.
Oxygen concentrations may be affected by changes in the circulation regime. The JdFR currently resides below the North Pacific oxygen minimum zone, with oxygen concentrations increasing with water depth from as low as 17.5 μmol at 1000 m water depth to 90–100 μmol/L at the core sites (2300–2900 m) (World Ocean Atlas 2013). If the oxygen minimum zone deepened to intersect the JdFR, it would enforce the low oxygen concentrations on the benthic ecology and stifle sediment mixing, but it is unclear why the oxygen minimum zone would have then shoaled in the Holocene. Alternatively, oxygen concentrations in deepwater may vary in response to transit time from the Southern Ocean northward. Relatively younger water masses would retain greater oxygen concentrations as they would experience relatively lower levels of net respiration. Studies of benthic-planktic 14C differences have found substantial changes in ventilation age of North Pacific bottom waters during the deglaciation (Okazaki et al. Reference Okazaki, Timmermann, Menviel, Harada, Abe-Ouchi, Chikamoto, Mouchet and Asahi2010; Lund et al. Reference Lund, Mix and Southon2011; Rae et al. Reference Rae, Sarnthein, Foster, Ridgewell, Grootes and Elliott2014), but few data are available to track changes in ventilation within the Holocene interval. Future work reconstructing oxygen concentrations across the North Pacific throughout the Holocene may be necessary to confirm whether variations in deep circulation can account for the changes in mixing intensity proposed here over the last 30 kyr.
CONCLUSIONS
Sediment mixing is omnipresent throughout the global ocean but poorly constrained beyond the observation and modeling of modern sedimentary mixed layers. Because sediment mixing can respond to environmental parameters, it is likely to have varied in the past under different paleoceanographic and paleoclimatic conditions. Here, diverging 14C and oxygen isotopic records from two species, G. bulloides and N. incompta, at five study sites in the Northeast Pacific provide evidence for substantial changes in sediment mixing since the last ice age. These records indicate that mixing intensity increased during the early Holocene after a period of relatively weaker mixing in the glacial period. The early Holocene shift may have occurred in response to increasing bottom water oxygen concentrations during this time, possibly related to a change in ventilation, although records of oxygen concentrations during the Holocene are currently inconclusive. Changes in the extent of sediment mixing have the greatest influence on the δ18O and 14C of planktonic foraminifera species that vary dramatically in abundance during the study interval. Despite the observed changes in mixing, substantial age control is nevertheless provided by benthic δ18O so that a reliable chronology for these cores can still be constructed.
ACKNOWLEDGMENTS
The authors thank Wei Huang, Nicholas Mehmel, and Grace Cushman for assistance with δ18O sample processing and analysis at LDEO. The data are archived on the NOAA paleoclimate database. This research was funded by NSF-AGS-#1338832 to JFM and a NSF Graduate Research Fellowship to KMC.
SUPPLEMENTARY MATERIAL
To view supplementary material for this article, please visit https://doi.org/10.1017/RDC.2017.91