Introduction
Cancer is the leading cause of death among Canadians and responsible for approximately 28.2% of all mortalities. 1,Reference Brenner, Poirier and Smith2 The primary intent of cancer treatment is curative, prolong patients’ life and improve patients’ quality of life. However, cancer treatments are associated with various adverse side effects that may impact patients’ quality of life depending on the severity. These side effects can burden patients’ physical and psychological wellbeing to the extent that in some cases treatment may be postponed or discontinued. Reference Cleeland and Sloan3–Reference Browall, Mijwel, Rundqvist and Wengström17 Therefore, it is essential for patients to be able to effectively communicate any adverse effects they are experiencing to their healthcare providers. Several studies Reference Yokomichi, Morita and Nitto4–Reference Hui, Shamieh and Paiva6,Reference Yamaguchi, Morita and Nitto8,Reference Baan, Koldenhof and Nijs10,Reference Khan, Cramarossa and Chen12,Reference Tran, Zomer and Chadder18–Reference Barbera, Seow and Howell30 have reported that systematic self-reporting of patients’ symptoms during their cancer journey has facilitated appropriate intervention, allowed patients to communicate their most relevant physical symptoms and psychosocial concerns to their healthcare providers and revealed the impact of cancer and treatment from patients’ perspective. According to Basch et al. Reference Basch, Deal and Kris19 and Cleeland et al. Reference Cleeland, Wang and Shi20 , systematic symptom reporting by patients correlates with decreased symptom severity, reduced hospital and emergency room visits, and an improved reported wellbeing. Denis et al. Reference Denis, Basch and Septans31 also reported that patient survival probability was higher for patients who participated in systematic symptom reporting. According to Goyal et al. Reference Goyal, Riegert and Davuluri32 , the incorporation of patient self-reported symptom scoring tools into treatment visits improved provider management of common cancers and radiotherapy-related symptoms and allowed for earlier referrals to supportive care clinics. Palm et al. Reference Palm, Jim, Boulware, Johnstone and Naghavi27 also reviewed the Edmonton Symptom Assessment System (ESAS) symptom records of retroperitoneal sarcoma patients and concluded that the reporting of symptoms during radiotherapy using patient-reported outcomes for symptom management facilitates timely management of patients’ symptoms. In a study by Schulman-Green et al. Reference Schulman-Green, Cherlin and McCorkle33 , they reported that using the ESAS has several benefits including being an easy tool capable of identifying areas of concern, engaging patients in symptom assessment, and monitoring symptom changes over time. Thus, routine patient-reported outcomes have been considered a significant keystone of the shift from disease-centred to person-centred care. Reference Yokomichi, Morita and Nitto4,Reference Yamaguchi, Morita and Nitto8,Reference Tran, Zomer and Chadder18–Reference Cleeland, Wang and Shi20,Reference Richardson and Jones23,Reference Ganesh, Zhang and Chan29,Reference Dai, Beca and Guo34
Consequently, several different tools have been designed to collect patient-reported outcomes to enable clear and timely communication of patients’ symptoms to their healthcare providers. Reference Cleeland and Sloan3–Reference Hui, Shamieh and Paiva6,Reference Yamaguchi, Morita and Nitto8,Reference Baan, Koldenhof and Nijs10,Reference Khan, Cramarossa and Chen12,Reference Tran, Zomer and Chadder18–Reference Howell, Keshavarz and Esplen26,Reference Denis, Basch and Septans31,Reference Goyal, Riegert and Davuluri32,Reference Subbiah, Charone and Roszik35–Reference Stern49 The World Health Organisation Five Well-Being Index first introduced in 1998 is a positively worded self-reported measure for assessing emotional wellbeing. Reference Lowe, Spitzer and GrÃfe41–Reference Moschopoulou, Deane and Duncan44 The Functional Assessment of Cancer Therapy-General is a 27-item questionnaire designed to measure patient physical, social, emotional and functional wellbeing. Reference Moschopoulou, Deane and Duncan44–Reference Yanez, Pearman, Lis, Beaumont and Cella46 The European Organisation for the Research and Treatment of Cancer Quality of Life Questionnaire is a 30-item cancer-specific questionnaire developed to assess the quality of life of cancer patients. Reference Moschopoulou, Deane and Duncan44,Reference Giesinger, Kuijpers and Young47,Reference Fayers and Bottomley48 The Impact of Cancer Scale is also a self-assessment questionnaire designed to measure the unique and multidimensional aspects of the quality of life of long-term cancer survivors. Reference Moschopoulou, Deane and Duncan44 The Hospital Anxiety and Depression Scale is a 14-item self-report questionnaire which assesses both anxiety and depression and has been well tested in cancer patients. Reference Stern49 The ESAS is used for self-assessment and evaluation of symptom burden related to cancer and captures information about nine common symptoms experienced by cancer patients. The ESAS is a validated standardised patient-centred symptom assessment tool used to evaluate the severity of nine physical and psychological symptoms of distress related to cancer. Reference Yokomichi, Morita and Nitto4–Reference Hui, Shamieh and Paiva6,Reference Yamaguchi, Morita and Nitto8,Reference Hallet, Davis and Isenberg-Grzeda15,Reference Tran, Zomer and Chadder18,Reference Cleeland, Wang and Shi20,Reference Richardson and Jones23–Reference McKenzie, Zhang and Zaki25,Reference Palm, Jim, Boulware, Johnstone and Naghavi27–Reference Ganesh, Zhang and Chan29,Reference Denis, Basch and Septans31,Reference Schulman-Green, Cherlin and McCorkle33,Reference Cuthbert, Boyne, Yuan, Hemmelgarn and Cheung40,Reference Pereira, Green and Molloy50–Reference Chang, Hwang and Feuerman64
Cancer Care Ontario implemented the ESAS symptom assessment tool in 2008 to improve patients’ symptom management. Reference Hallet, Davis and Isenberg-Grzeda15,Reference Schulman-Green, Cherlin and McCorkle33,Reference Pereira, Green and Molloy50 The goal of this study is to report on our clinical experience with the ESAS questionnaire responses by patients. We examined patients’ demographics (age and gender) variations and primary disease sites on symptom intensity and pattern. Using these data, we sought to determine areas that could benefit from improved measurement of patient-reported outcomes and whether patient-reported outcomes could help characterise patients with the highest supportive care needs and symptom burden. The knowledge will help provide targeted support for patients, determine areas of opportunities to facilitate suitable follow-up interventions and improve patient satisfaction and clinical encounters during patients’ cancer journey.
Materials and Methods
At the Cancer Centre, patients complete the ESAS questionnaire, as a routine component of their clinic visits, for monitoring patient-reported symptoms over the course of treatments and follow-ups. Completing the ESAS is considered part of standard of care, which means that each patient during each out-patient treatment or clinic visit will complete the ESAS as a basis for tailoring care. Although the completion rate of the ESAS questionnaire varies from year to year, the average completion rate for the study period was about 68%. The ESAS tool enables patients to rate each symptom severity using an 11-point numerical rating scale ranging from 0 to 10, where 0 means complete absence of the symptom or best overall wellbeing and 10 means worst possible symptom or worst overall wellbeing. The data are captured electronically using the Interactive Symptom Assessment and Collection (ISAAC) system. The ISAAC allows patients to report the nine common symptoms via kiosks (PC or tablet computers) directly to clinicians in real time at the hospital during their scheduled visits. At the hospital, volunteers are always available to assist patients with technological difficulties or older patients who are not able to complete the ESAS themselves. Patients with access to personal computers or mobile devices receive directives to report their symptoms at home prior to their clinic visits. The attending physicians are able to access the patient-reported symptom via the hospital’s electronic medical records, and staff also receive email alerts when patients report severe or worsening symptoms based on a set cut-off value. Through the implementation of the ISAAC, Ontario possesses a unique data source that collects patient-reported symptom information that is available both at the local hospitals and centrally at Ontario Health-Cancer Care Ontario (OH-CCO), in electronic form, and is linkable to the cancer registry. This quantitative symptom assessment tool allows for simple and rapid simultaneous documentation of multiple patient-reported symptoms. In this study, patients’ responses to the ESAS questionnaires from 1 April 2014 to 30 September 2020 were electronically obtained from the OH-CCO database. The data included patient-reported physical symptoms (nausea, shortness of breath, lack of appetite, pain, drowsiness and tiredness), psychological symptoms (depression and anxiety) and overall wellbeing. Patient demographics (age and gender), primary disease sites and clinic visit characteristics were also collected.
Data analysis
A total of 19,288 cancer patients completed 201,839 ESAS questionnaires as part of routine care during various visits to the Cancer Centre. To keep the presented data to a reasonable format, patient responses to symptom severity are stratified as no symptom (score of 0), mild (scores: 1–3), moderate (scores: 4–6) and severe (scores: 7–10), and symptom prevalence was calculated as the percentage of patients reporting at least 1 or greater on a specific symptom, consistent with other studies. Reference Hui, Shamieh and Paiva6,Reference Tran, Zomer and Chadder18,Reference Seow, Sussman, Martelli-Reid, Pond and Bainbridge21,Reference Selby, Cascella and Gardiner22,Reference Goyal, Riegert and Davuluri32,Reference Schulman-Green, Cherlin and McCorkle33,Reference Newcomb, Nipp and Waldman51,Reference Graham, Gingerich, Lambert, Alamri and Czaykowski53,Reference Nekolaichuk, Watanabe and Beaumont55–Reference Cheung, Le, Gagliese and Zimmermann58 Statistical analyses were performed using the IBM SPSS Statistics version 26.0, and we report on the prevalence and severity of the nine patient-reported symptoms. We computed the ESAS total (ESAS-TOT, range: 0–90) symptom distress score by adding the individual scores from each of the nine symptoms. The individual scores from the six physical symptoms and the two psychological symptoms were added to generate the ESAS physical (ESAS-PHY, range: 0–60) and ESAS psychological (ESAS-PSY, range: 0–20) symptom sub-scores, respectively. The overall wellbeing was excluded from the physical and the psychological symptom distress sub-scores as it can be influenced by both physical and psychological manifestations of the disease, consistent with other studies. Reference Hui and Bruera5–Reference Hui, Shamieh and Paiva7,Reference Schulman-Green, Cherlin and McCorkle33,Reference Cheung, Le and Zimmermann56–Reference Zimmermann, Burman and Bandukwala59 Additionally, we calculated the mean values of the ESAS-TOT scores, and ESAS-PHY and ESAS-PSY symptom distress sub-scores. Furthermore, we used the concept of the scoring stratification of 0 (no symptom), 1–3 (mild), 4–6 (moderate) and 7–10 (severe) Reference Hui and Bruera5,Reference Tran, Zomer and Chadder18,Reference Seow, Sussman, Martelli-Reid, Pond and Bainbridge21,Reference Selby, Cascella and Gardiner22,Reference Goyal, Riegert and Davuluri32,Reference Dai, Beca and Guo34,Reference Newcomb, Nipp and Waldman51,Reference Graham, Gingerich, Lambert, Alamri and Czaykowski53,Reference Nekolaichuk, Watanabe and Beaumont55–Reference Cheung, Le, Gagliese and Zimmermann58,Reference Oldenmenger, De Raaf, De Klerk and Van Der Rijt60 , to stratify the calculated ESAS-TOT symptom scores into TOT-low (0–8), TOT-mild (9–35), TOT-moderate (36–62) and TOT-severe (63–90); ESAS-PHY sub-scores into PHY-low (0–5), PHY-mild (6–23), PHY-moderate (24–41) and PHY-severe (42–60) and the ESAS-PSY sub-scores into PSY-low (0–1), PSY-mild (2–7), PSY-moderate (8–13) and PSY-severe (14–20), consistent with other studies. Reference Yokomichi, Morita and Nitto4,Reference Hannon, Dyck and Pope28,Reference Dai, Beca and Guo34,Reference Cuthbert, Boyne, Yuan, Hemmelgarn and Cheung40,Reference Newcomb, Nipp and Waldman51,Reference Graham, Gingerich, Lambert, Alamri and Czaykowski53,Reference Battaglia, Zerbinati and Piazza54,Reference Cheung, Barmala, Zarinehbaf, Rodin, Le and Zimmermann57 The patients’ study cohort was stratified by age (17–35, 36–55, 56–75 and 76–102 years), gender, primary disease site and type of clinic visit subgroups to examine ESAS prevalence and severity scores within subgroups. We evaluated the differences in symptom severity between subgroups using the analysis of variance (ANOVA) test.
Results
Patients, primary disease sites and clinic visit characteristics
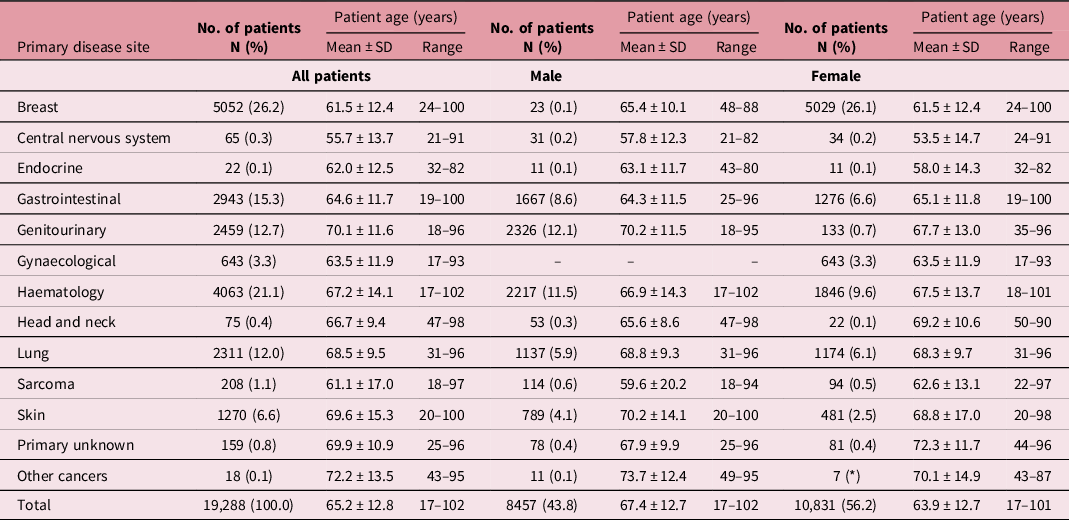
Descriptive statistics including means, standard deviations, medians and interquartile ranges are used to describe patients’ demographics, primary disease site characteristics, clinic visit characteristics and patient-reported symptom severity and prevalence. A summary of patients and primary disease site characteristics is shown in Table 1, and the clinic visit characteristics for the primary disease sites are shown in Table S2. The overall mean age is 65.2 ± 12.8 years (range: 17–102 years). There were 8,457 (43.8%) male patients compared to 10,831 (56.2%) female patients. The most common primary disease sites are breast (26.2%), haematology (21.1%), gastrointestinal (15.3%), genitourinary (12.7%) and lung (12.0%) cancers (Table 1). The most prevalent clinic visits are systemic clinic (34.9%), radiation treatment (15.8%), systemic treatment (15.2%) and radiation clinic (12.3%) (Table S2).
A summary of patients and primary disease site characteristics

* = Value < 0.1%; SD = Standard deviation; N = Number of patients, (%) = Number of patients as a percentage.
ESAS symptom burden for all patients
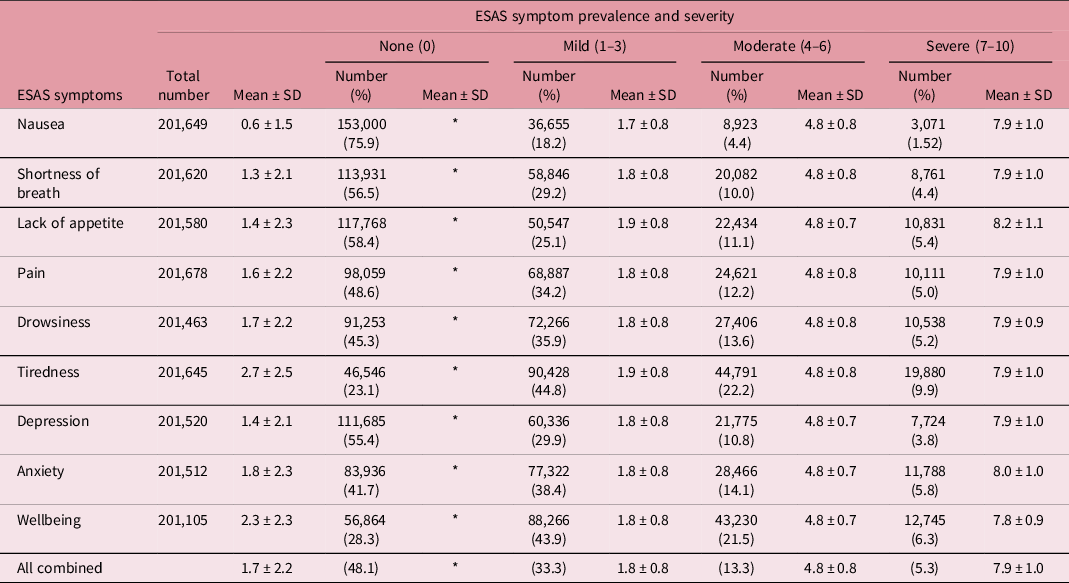
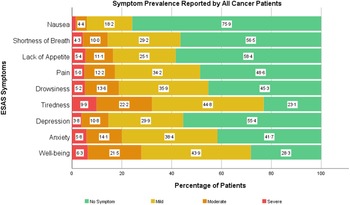
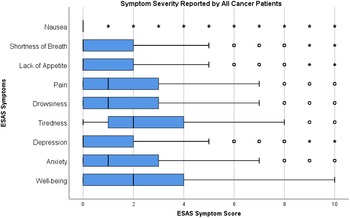
The distribution of symptom burden, including type, prevalence and severity of symptoms for the entire cohort of patients, is summarised in Table 2. A symptom was considered to be present if the score for that particular symptom was ranked >0, and the mean severity for each of the nine symptoms was evaluated using mean ± SD scores. Figure 1 shows a stacked bar chart of patient-reported symptom prevalence, and Figure 2 shows the distribution of the symptom severity as boxplots for all patients. Overall, 48.1% of scores were ranked 0 (i.e., complete absence of symptoms), whereas the prevalence of severity levels of symptom distress was ranked as mild (1–3) – 33.3%, moderate (4–6) – 13.3% and severe (7–10) – 5.3% (Table 2). The mean severity for each symptom distress was all in the mild range (score: 1–3). Tiredness (2.7 ± 2.5) was the only symptom where the mean severity approached the upper limit of the mild range. When we considered only the scores ranked as severe (score: 7–10), the symptoms with high mean scores are lack of appetite (8.2 ± 1.1) and anxiety (8.0 ± 1.0) and the most prevalent reported severe symptoms are tiredness, poor overall wellbeing and anxiety (Table 2). While the mean severity scores are low, we observed that the prevalence of symptoms was high for some symptoms. For example, among the 76.9% of responses on tiredness, patients reported experiencing various levels of the symptom (mild: 44.8%, moderate: 22.2% and severe: 9.9%). Among the 58.3% responses on anxiety, patients reported various levels of anxiety (mild: 38.4%, moderate: 14.1% and severe: 5.8%), and among the 71.7% responses on wellbeing, patients reported changes to overall wellbeing (mild: 43.9%, moderate: 21.5% and severe: 6.3%) (Table 2, Figure 1). The most common reported symptom distress is tiredness (76.9%), and the least reported symptom is nausea (24.1%). The median scores of all the symptoms are ≤2 (Figure 2), indicating that at least 50% of the symptom scores are ≤2. For example, about 50% of each of the scores for nausea, shortness of breath, lack of appetite and depression are 0 (median = 0), whereas 50% of the scores for pain, drowsiness and anxiety are ≤1 (median = 1). Tiredness and overall wellbeing are the only symptoms showing higher median scores (median = 2) compared to the other symptoms. We observed that the first quartile is 0 for all symptoms except for tiredness, indicating that at least 25% of the scores for these symptoms are all 0. In contrast, tiredness has a first quartile of 1, indicating that about 25% of the scores for tiredness are ≤1. The interquartile range, which gives the span of scores between the first and third quartiles, is smallest for nausea but larger for overall wellbeing, indicating a wider spread of scores for overall wellbeing.
A summary of patient-reported ESAS symptom burden including type, symptom prevalence and severity of symptoms for entire cohort of patients stratified by no symptom (0), mild symptom (1–3), moderate symptom (4–6) and severe symptom (7–10). 0 indicates no symptoms or best possible wellbeing, and 10 indicates worst possible symptom or wellbeing

* = Mean value is zero; ESAS = Edmonton Symptom Assessment System.
Stacked bar chart of symptom prevalence reported by all cancer patients. The symptom severity is categories into “No Symptom” (score: 0); “Mild” (scores: 1–3); “Moderate” (scores: 4–6); “Severe” (scores: 7–10).

The distribution of the reported symptom severity for all patients shown as boxplots. The boxplots show the overall spread of the reported symptom severity (minimum-maximum), the lower quartile (Q1, i.e., 25th percentile), upper quartile (Q3, i.e., 75th percentile), the interquartile range (IQR, Q3–Q1), the median and severity outliers (i.e., severity data points that are located outside the whiskers of the boxplots). The interquartile range (i.e., the box) describes the middle 50% of the reported symptom severity when ordered from the lowest to highest, and it is often seen as a better measure of spread than the range as it is not influenced by severity outliers. Minor outliers are represented by circles and are defined as values greater than (Q3 + 1.5 * IQR). The major outliers are represented by asterisks and are defined as values greater than (Q3 + 3 * IQR).

ESAS symptom severity by patient demographics
The ESAS symptom mean severity scores by all patients stratified by patient demographics (i.e., gender and age) are shown in Table S4a. The results of ANOVA test to evaluate the differences in symptom severity between subgroups are also included in the Table. All symptom mean severity scores when stratified by gender and age are mild (0 < scores ≤ 3) (Table S4a). Tiredness was the highest ranked symptom distress by both genders: males (2.7/10) and females (2.8/10), and nausea was ranked the least severe: males (0.7/10) and females (0.6/10). The ANOVA test shows statistically significant differences (p-value < 0.01) between genders with respect to the reported symptom mean severity scores, except for pain where there was no significant difference (p-value=0.01) between the genders (Table S4a). The mean severity scores when stratified by age are also all mild (0 < scores ≤ 3). The 76–102 year subgroup ranked shortness of breath (1.7 ± 2.4), lack of appetite (1.6 ± 2.5), drowsiness (1.9 ± 2.4), tiredness (3.0 ± 2.7) and overall wellbeing (2.5 ± 2.4) higher than all other age subgroups (Table S4a). The ANOVA test shows statistically significant differences (p-value < 0.01) between the age subgroups with respect to the reported symptom mean severity scores (Table S4a).
ESAS symptom severity by primary disease site
The ESAS symptom mean severity scores by all patients stratified by primary disease sites are shown in Table S4b. The results of ANOVA test to evaluate the differences in symptom severity between the primary disease sites are also included in the Table. The reported symptom mean severity scores when stratified by primary disease sites are all mild (0< scores ≤3) except for the following: tiredness (3.9/10) and overall wellbeing (3.4/10) for the ‘primary unknown’ disease site subgroup; tiredness (3.9/10), anxiety (3.4/10) and overall wellbeing (3.7/10) for the ‘other cancers’ subgroup; and lack of appetite (3.8/10), tiredness (4.1/10), anxiety (3.3/10) and overall wellbeing (3.9/10) for the head and neck cancers (Table S4b). Patients with head and neck cancers had the highest mean severity score for nausea (1.6/10), lack of appetite (3.8/10), pain (2.9/10), tiredness (4.1/10) and overall wellbeing (3.9/10), whereas breast cancer patients had the lowest symptom mean severity score for nausea (0.4/10), shortness of breath (0.9/10), lack of appetite (1.0/10) and drowsiness (1.4/10). Patients with lung cancer had the highest mean severity score (2.9/10) for shortness of breath. The ANOVA test shows statistically significant differences (p-value < 0.01) between the primary disease site with respect to the reported mean severity scores (Table S4b).
ESAS-TOT, ESAS-PHY and ESAS-PSY symptom burden for all patients
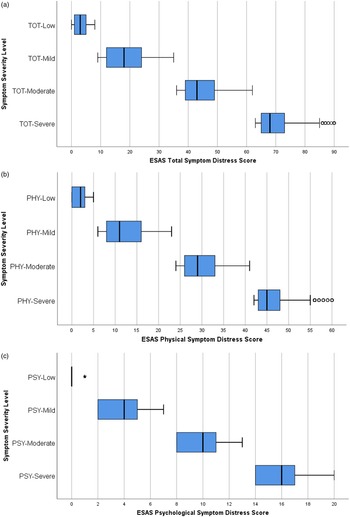
Figure 3 shows boxplots of ESAS-TOT symptom distress score, and ESAS-PHY and ESAS-PSY symptom distress sub-scores stratified into the corresponding severity levels of TOT-low, TOT-mild, TOT-moderate and TOT-severe; PHY-low, PHY-mild, PHY-moderate and PHY-severe; and PSY-low, PSY-mild, PSY-moderate and PSY-severe, respectively. The boxplots show the overall spread of the reported symptom severity (minimum-maximum), lower quartile (Q1, i.e., 25th percentile), upper quartile (Q3, i.e., 75th percentile), interquartile range (Q1–Q3), median and the severity outliers (i.e., severity data points that are located outside the whiskers of the boxplots). The interquartile range describes the middle 50% of the symptom severity when ordered from the lowest to highest, and it is often seen as a better measure of spread than the range as it is not influenced by outliers. In Figure 3, we observed that about 75% (upper quartile) of the scores classified as low, mild, moderate and severe are ≤5, ≤24, ≤49 and ≤73, respectively, for ESAS-TOT; ≤3, ≤16, ≤33 and ≤48, respectively, for ESAS-PHY and 0, ≤5, ≤11 and ≤17, respectively, for ESAS-PSY.
Boxplot of (a) ESAS total symptom distress score (ESAS-TOT), (b) ESAS physical symptom distress (ESAS-PHY) sub-score and (c) ESAS psychological symptom distress sub-score (ESAS-PSY) stratified into four severity levels: TOT-low (0–8), TOT-mild (9–35), TOT-moderate (36–62) and TOT-severe (63–90) for ESAS-TOT; PHY-low (0–5), PHY-mild (6–23), PHY-moderate (24–41) and PHY-severe (42–60) for ESAS-PHY; and PSY-low (0–1), PSY-mild (2–7), PSY-moderate (8–13) and PSY-severe (14–20) for ESAS-PSY. The boxplots show the spread of the symptom severity (minimum–maximum), the lower quartile (Q1, i.e., 25th percentile), upper quartile (Q3, i.e., 75th percentile), the interquartile range (IQR, Q3–Q1), the median and any severity outliers (i.e., severity scores that are located outside the whiskers of the boxplots) for each severity level. The minor outliers are represented by circles and are defined as values greater than (Q3 + 1.5 * IQR). The major outliers are represented by asterisks and are defined as values greater than (Q3 + 3 * IQR).

ESAS-TOT, ESAS-PHY and ESAS-PSY symptom severity by patient demographics
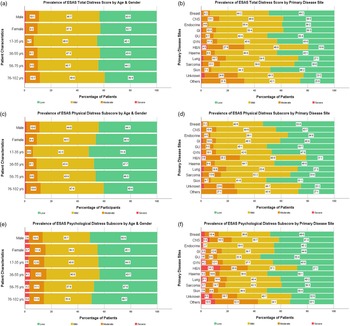
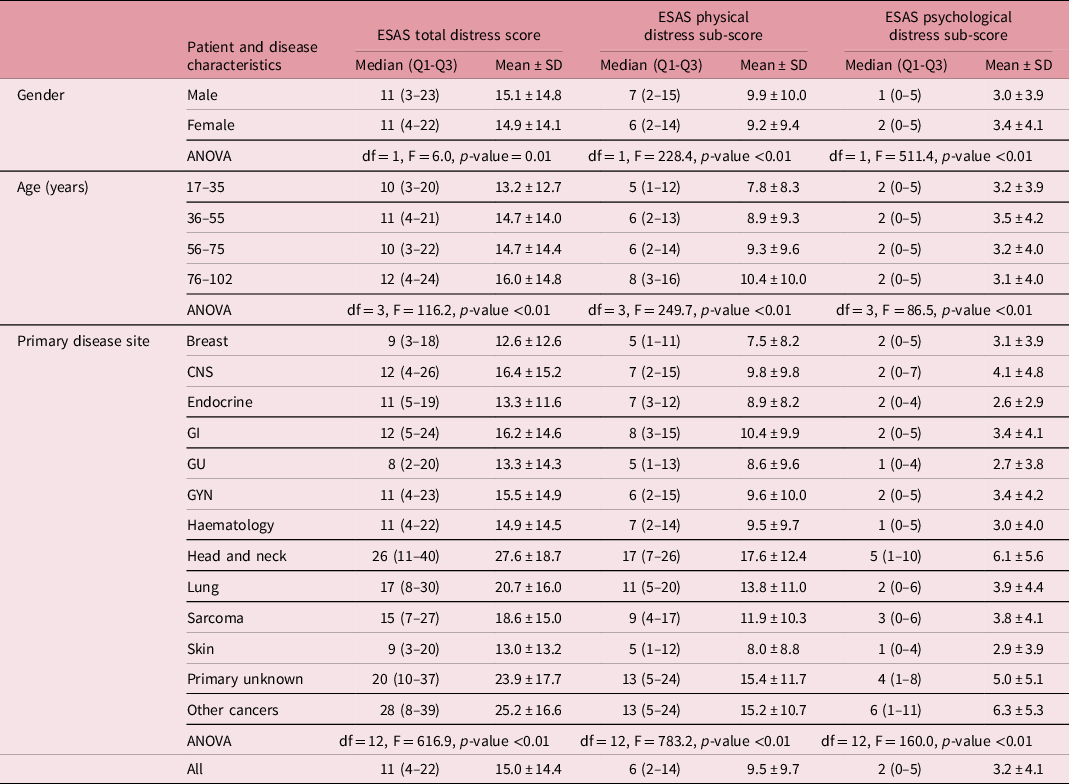
Figure 4 (a, c, e) shows stacked bar charts of the prevalence of the ESAS-TOT symptom distress score and ESAS-PHY and ESAS-PSY symptom distress sub-scores for all patients stratified by gender and age. Furthermore, the ESAS-TOT symptom distress score and the ESAS-PHY and ESAS-PSY symptom distress sub-scores have been stratified into the respective low, mild, moderate and severe levels. The mean, median and interquartile range of the ESAS-TOT symptom distress scores, and ESAS-PHY and ESAS-PSY symptom distress sub-scores stratified by gender and age are shown in Table 3. We also stratified the severities of ESAS-TOT symptom distress scores into TOT-low (data not shown), TOT-mild, TOT-moderate and TOT-severe; ESAS-PHY symptom distress sub-scores into PHY-low (data not shown), PHY-mild, PHY-moderate and PHY-severe; and ESAS-PSY symptom distress sub-scores into PSY-low (data not shown), PSY-mild, PSY-moderate and PSY-severe, and the results are shown in Table S6a when stratified by patient demographics. The prevalence of ESAS-TOT, ESAS-PHY and ESAS-PSY symptom distress scores is mostly in the low-mild range for all genders and age (Figure 4a, c, e). The ESAS-TOT symptom mean severity score and the ESAS-PHY and ESAS-PSY symptom mean severity sub-scores when stratified by gender and age are all mild (Table 3). The ESAS-TOT symptom mean severity score is 15.1 for males and 14.9 for females (out of 90), the ESAS-PHY symptom mean severity sub-score is 9.9 for males and 9.2 for females (out of 60), and the ESAS-PSY symptom mean severity sub-scores is 3.0 for males and 3.4 for females (out of 20). Patients’ ages 76–102 years had the highest symptom burden compared to all other age subgroups. The highest mean severity scores of the ESAS-TOT symptoms (16.0/90) and the ESAS-PHY symptoms (10.4/60) are reported by the 76–102 years subgroup, whereas they also reported the lowest ESAS-PSY symptom mean severity score (3.1/20). The ESAS-PSY symptom mean severity score was ranked highest by the 36–55 years subgroup. The 17–35 years subgroup had the lowest mean severity scores for all three ESAS-TOT, ESAS-PHY and ESAS-PSY symptom subgroups (Table 3). The ANOVA test shows that except for ESAS-TOT mean severity for male and female (p-value = 0.01), the ESAS-TOT symptom scores which represent the overall symptom burden and the ESAS-PHY and ESAS-PSY symptom severity sub-scores are all statistically different (p-value < 0.01) among all genders and age (Table 3), consistent with other studies. Reference Dai, Beca and Guo34,Reference Cuthbert, Boyne, Yuan, Hemmelgarn and Cheung40 When the ESAS-TOT symptom scores ESAS-PHY and ESAS-PSY symptom sub-scores are stratified into low, mild, moderate and severe, we observed that the mean scores in each classification are all on the lower end of each range for all genders and ages (Table S6a).
Stacked bar chart of the prevalence of the ESAS total distress score (a) and (b), physical distress sub-score (c) and (d), and psychological distress sub-score (e) and (f) for all cancer patients stratified by gender, age and primary disease site. The ESAS total symptom distress score is stratified into TOT-low (0–8), TOT-mild (9–35), TOT-moderate (36–62) and TOT-severe (63–90); the physical sub-scores is stratified into PHY-low (0–5), PHY-mild (6–23), PHY-moderate (24–41) and PHY-severe (42–60), and the psychological sub-scores is stratified into PSY-low (0–1), PSY-mild (2–7), PSY-moderate (8–13) and PSY-severe (14–20).

The ESAS total (ESAS-TOT) symptom distress score, ESAS physical (ESAS-PHY) symptom distress sub-score and ESAS psychological (ESAS-PSY) symptom distress sub-score stratified by gender, age and primary disease site. ANOVA test was used to evaluate the differences in symptom severity between the subgroups. ESAS-TOT symptom score includes summation of all symptom scores and ranges from 0 (best) to 90 (worst). ESAS-PHY symptom sub-score includes summation of nausea, shortness of breath, lack of appetite, pain, drowsiness, tiredness scores and ranges from 0 (best) to 60 (worst). ESAS-PSY symptom sub-score includes summation of depression and anxiety scores and ranges from 0 (best) to 20 (worst)

ESAS = Edmonton Symptom Assessment System, (Q1–Q3) = interquartile range.
ESAS-TOT, ESAS-PHY and ESAS-PSY symptom severity by primary disease site
Figure 4 (b, d, f) shows stacked bar charts of the prevalence of the ESAS-TOT symptom distress score and ESAS-PHY and ESAS-PSY symptom distress sub-scores for all patients stratified by primary disease site and into the respective low, mild, moderate and severe levels. The mean, median and interquartile range of the ESAS-TOT symptom distress scores and ESAS-PHY and ESAS-PSY symptom distress sub-scores stratified by primary disease site are shown in Table 3. Table S6b shows the ESAS-TOT-low (data not shown), TOT-mild, TOT-moderate and TOT-severe; ESAS-PHY-low (data not shown), PHY-mild, PHY-moderate and PHY-severe; and ESAS-PSY-low (data not shown), PSY-mild, PSY-moderate and PSY-severe when stratified by primary disease site. The ESAS-TOT symptom mean severity score and ESAS-PHY and ESAS-PSY symptom mean severity sub-scores when stratified by primary disease site are all mild (score: 9–35), (score: 6–23) and (score: 2–7), respectively (Table 3). Patients with head and neck cancers had the highest ESAS-TOT symptom mean severity score (27.6/90) and ESAS-PHY symptom mean severity sub-score (17.6/60). Patients with ‘other cancers’ had the highest ESAS-PSY symptom mean severity sub-score (6.3/20). Breast cancer patients had the lowest ESAS-TOT symptom mean severity score (12.6/90), ESAS-PHY symptom mean severity sub-score (7.5/60), and patients with endocrine cancer had the lowest ESAS-PSY symptom mean severity sub-score (2.6/20) (Table 3). The ANOVA test shows that the ESAS-TOT symptom scores, ESAS-PHY and ESAS-PSY symptom severity sub-scores are all statistically different (p-value < 0.01) among the primary disease sites (Table 3), consistent with other studies. Reference Cuthbert, Boyne, Yuan, Hemmelgarn and Cheung40,Reference Newcomb, Nipp and Waldman51 When the ESAS-TOT symptom scores, ESAS-PHY and ESAS-PSY symptom sub-scores are stratified into low, mild, moderate and severe, we observed that the mean scores in each classification were all on the lower end of each range for all primary disease sites (Table S6b).
Discussion
The systematic collection of patient self-reported symptoms using standardised patient-reported outcome questionnaires is considered an effective patient-centred care to improve symptom control, patient-healthcare provider communication, overall wellbeing and patient satisfaction. Reference Yokomichi, Morita and Nitto4,Reference Tran, Zomer and Chadder18–Reference Cleeland, Wang and Shi20,Reference Palm, Jim, Boulware, Johnstone and Naghavi27,Reference Goyal, Riegert and Davuluri32,Reference Dai, Beca and Guo34,Reference Cuthbert, Boyne, Yuan, Hemmelgarn and Cheung40,Reference Battaglia, Zerbinati and Piazza54,Reference Cheung, Le and Zimmermann56–Reference Cheung, Le, Gagliese and Zimmermann58 We evaluated patient-reported symptom burden and factors associated with higher symptom burden to determine opportunities to improve patient symptom management, overall wellbeing and potentially improve patient satisfaction. The ESAS responses by patients show that 51.9% reported experiencing mild to severe symptom distress levels, although the mean severity scores for each symptom are all mild (0 < score ≤ 3). The three symptoms reported as causing most distress are tiredness, poor overall wellbeing and anxiety. This observation in the study is similar to what has also been reported in similar studies. Reference Cuthbert, Boyne, Yuan, Hemmelgarn and Cheung40,Reference Tjong, Doherty and Tan65 Cuthbert et al. Reference Cuthbert, Boyne, Yuan, Hemmelgarn and Cheung40 conducted a retrospective, population-based cohort study on ESAS scores completed by 1,310 patients. They reported that, although the severity of symptoms was low, the prevalence of specific symptoms such as tiredness, anxiety, pain and low wellbeing was high. In a similar study by Tjong et al. Reference Tjong, Doherty and Tan65 who assessed ESAS scores completed by 13,289 patients, they also observed that the most prevalent symptoms causing patient distress are tiredness, low wellbeing, low appetite and shortness of breath.
ESAS symptom severity and prevalence by patient demographic
Tiredness was the most commonly reported symptom distress and had the highest mean severity score across all ages and genders. This observation is similar to other studies on symptom burden in cancer patients which shows that tiredness is common among cancer patients at all ages and genders. Reference Basch, Deal and Kris19,Reference Palm, Jim, Boulware, Johnstone and Naghavi27–Reference Barbera, Seow and Howell30,Reference Cuthbert, Boyne, Yuan, Hemmelgarn and Cheung40,Reference Newcomb, Nipp and Waldman51,Reference Battaglia, Zerbinati and Piazza54,Reference Cheung, Le and Zimmermann56,Reference Hertler, Seiler, Gramatzki, Schettle and Blum66,Reference Blais, St-Hilaire, Fillion, De Serres and Tremblay67 In a study by Blais et al. Reference Blais, St-Hilaire, Fillion, De Serres and Tremblay67 , when 911 cancer patients were screened at the time of their first visit by a nurse navigator using different symptom assessment tools. They reported tiredness as the most prevalent symptom among patients who completed the ESAS questionnaire. Barbera et al. Reference Barbera, Seow and Howell30 have also reported that the highest mean symptom scores were for tiredness and wellbeing.
In our current study, male patients scored nausea, shortness of breath, lack of appetite and drowsiness higher than female patients and reported the highest ESAS-TOT and ESAS-PHY mean severity scores. Cheung et al. Reference Cheung, Le, Gagliese and Zimmermann58 also observed higher scores for drowsiness by males. In a study by Bubis et al. Reference Bubis, Davis and Mahar68 , they also reported that males had significantly higher odds of reporting higher scores for shortness of breath but lower scores for nausea, lack of appetite and drowsiness, and Palm et al. Reference Palm, Jim, Boulware, Johnstone and Naghavi27 reported that females were more likely to report higher mean scores for nausea. We observed that female patients reported the highest mean severity scores for tiredness, depression, anxiety and overall wellbeing. Similar studies Reference Palm, Jim, Boulware, Johnstone and Naghavi27,Reference Barbera, Seow and Howell30,Reference Cheung, Le, Gagliese and Zimmermann58,Reference Hertler, Seiler, Gramatzki, Schettle and Blum66,Reference Bubis, Davis and Mahar68–Reference Hope-Stone, Brown, Heimann, Damato and Salmon70 have also reported similar high scores for these symptoms by females. Bubis et al. Reference Bubis, Davis and Mahar68 performed a retrospective observational study on 729,861 ESAS symptom assessment scores that were recorded within 12 months of patients’ diagnosis. They reported that females had significantly higher odds of reporting higher scores for anxiety, depression, tiredness and poor overall wellbeing. In another study by Cheung et al. Reference Cheung, Le, Gagliese and Zimmermann58 comparing ESAS symptom scores between males and females, they observed that females reported poorer scores than males for pain, tiredness, anxiety and poor wellbeing. Röhrl et al. Reference Röhrl, Guren, Småstuen and Rustøen69 conducted a study of 120 patients with colorectal cancer receiving chemotherapy with curative or palliative intent. They reported significantly higher severity scores for anxiety and tiredness in women compared with men. In a prospective longitudinal study of 411 patients with uveal melanoma by Hope-Stone et al. Reference Hope-Stone, Brown, Heimann, Damato and Salmon70 , females reported significantly higher scores on anxiety and depression.
We also observed that patients aged 76–102 years reported the highest mean severity scores for shortness of breath, lack of appetite, drowsiness, tiredness and poor overall wellbeing and had the highest ESAS-TOT and ESAS-PHY mean severity scores. Patients aged 36–55 years reported the highest mean severity scores for depression and anxiety, and patients aged 17–35 years had the lowest ESAS-TOT and ESAS-PHY mean severity scores. Several studies investigating symptom intensity among different age groups have reported similar results. Reference Palm, Jim, Boulware, Johnstone and Naghavi27,Reference Barbera, Seow and Howell30,Reference Cheung, Barmala, Zarinehbaf, Rodin, Le and Zimmermann57,Reference Cheung, Le, Gagliese and Zimmermann58,Reference Oldenmenger, De Raaf, De Klerk and Van Der Rijt60,Reference Bubis, Davis and Mahar68–Reference Schmidt, Bestmann, Kuchler, Longo and Kremer73 Palm et al. Reference Palm, Jim, Boulware, Johnstone and Naghavi27 reviewed the records of 47 patients with retroperitoneal sarcoma and reported that age was associated with worse ESAS scores. Röhrl et al. Reference Röhrl, Guren, Småstuen and Rustøen69 investigated the relationship between age and cancer symptom severity and observed that older cancer patients experience worse overall physical function including tiredness, whereas younger patients reported significantly higher severity scores for anxiety and tiredness. According to Bubis et al. Reference Bubis, Davis and Mahar68 , patients aged >61 years old had significantly higher odds of reporting higher ESAS scores for shortness of breath and Hope-Stone et al. Reference Hope-Stone, Brown, Heimann, Damato and Salmon70 also observed that younger patients (aged <64 years) reported higher scores on anxiety and depression. Cheung et al. Reference Cheung, Le, Gagliese and Zimmermann58 investigated symptom scores by ESAS among 1,358 patients, and symptom intensity was compared between individuals aged ≤60 and >60 years. They observed that older patients (>60 years) reported high mean scores for tiredness, lack of appetite, poor overall wellbeing and had the highest mean scores for ESAS-TOT and ESAS-PHY. The younger patients (≤60 years) on the other hand reported worse pain and better appetite.
The awareness of gender and age-related symptom variations and knowledge of specific groups with higher risks of specific symptoms is very important in cancer care and will enable clinician and healthcare providers to develop and provide appropriate symptom-directed patient-focused interventions for the specific subgroups of patients. According to Cheung et al. Reference Cheung, Barmala, Zarinehbaf, Rodin, Le and Zimmermann57 , patient age at diagnosis is a factor that could determine a patient’s psychological response to a cancer diagnosis, and younger patients with younger children would react differently than relatively older patients. Several studies have reported that there is much evidence that supports positive treatment outcomes for cancer patients who are identified and treated for their symptoms. Reference Somerset, Stout, Miller and Musselman74–Reference Su, Yeh and Chang76 Somerset et al. Reference Somerset, Stout, Miller and Musselman74 reviewed studies that investigated pathophysiologic alterations in patients with cancer and comorbid depression and examined the treatment of depression and related symptoms in women with breast cancer. They reported that the treatment of depression in women with breast cancer improves dysphoria and other depressive symptoms, enhances quality of life and improves survivorship, overall wellbeing and treatment outcomes. According to Howell et al. Reference Howell, Keshavarz and Esplen26 , psychosocial distress that goes untreated is correlated to worsening symptom severity and lower adherence to treatments.
ESAS symptom severity and prevalence by primary disease site
Across all primary disease sites, we observed that tiredness was the most commonly reported symptom distress and had the highest mean severity score. This observation is similar to other studies on symptom burden in cancer patients which shows that tiredness is common among cancer patients for all cancer types and stages. Reference Barbera, Seow and Howell30,Reference Cuthbert, Boyne, Yuan, Hemmelgarn and Cheung40,Reference Bubis, Davis and Mahar68 In this study, lung cancer patients reported the highest mean score for shortness of breath. Head and neck cancer patients reported the highest mean scores for nausea, lack of appetite, pain, tiredness and overall wellbeing and had the highest ESAS-TOT and ESAS-PHY mean severity scores. Breast cancer patients had the lowest ESAS-TOT and ESAS-PHY mean severity scores. In a study by Cuthbert et al. Reference Cuthbert, Boyne, Yuan, Hemmelgarn and Cheung40 , they observed that lung cancer patients reported the highest mean severity scores for shortness of breath, ESAS-TOT, ESAS-PHY and ESAS-PSY, and breast cancer patients had the lowest ESAS-PHY and ESAS-PSY and ESAS-TOT. In a retrospective observational study of cancer patients by Bubis et al. Reference Bubis, Davis and Mahar68 , they reported that breast cancer patients are less likely to score moderate-to-severe scores for all the ESAS symptoms. Barbera et al. Reference Barbera, Seow and Howell30 investigated the ESAS scores in a population-based cross-section of cancer patients and the relation of the scores to sociodemographic and disease sites. They observed that lung cancer patients reported the highest mean score for shortness of breath and breast cancer patients generally scored low for most of the symptoms. The awareness of primary disease site-related symptom variations and knowledge of the specific groups with higher risks of specific symptoms is essential and should help design interventions tailored for symptoms that are more prominent in specific patient subgroups and potentially help offer improved therapeutic clinical benefits.
Clinical Benefits of Systematic Patients’ Self-Reporting Symptoms
Several studies have reported that higher ESAS symptom burden is associated with increased emergency room visits, hospitalisation, shorter survival and could also lead to functional impairment; however, improved symptom management has the potential to improve survival and treatment outcome. Reference Yokomichi, Morita and Nitto4,Reference Hui and Bruera5,Reference Hamer, McDonald and Zhang14,Reference Tran, Zomer and Chadder18,Reference Basch, Deal and Kris19,Reference Richardson and Jones23,Reference Goyal, Riegert and Davuluri32,Reference Dai, Beca and Guo34,Reference Subbiah, Charone and Roszik35,Reference Pereira, Green and Molloy50,Reference Graham, Gingerich, Lambert, Alamri and Czaykowski53,Reference Cheung, Barmala, Zarinehbaf, Rodin, Le and Zimmermann57,Reference Zeng, Zhang and Culleton63,Reference Barbera, Sutradhar and Seow77,Reference Barbera, Atzema and Sutradhar78 Barbera et al. Reference Barbera, Sutradhar and Seow77 conducted a population-based retrospective cohort study of 128,893 pairs of well-matched patients diagnosed with cancer and completed the ESAS at least once during the period of the study. Each patient who completed the ESAS was matched randomly to a cancer patient who did not complete the ESAS. They reported that the probability of survival within the first 5 years was higher among those who completed the ESAS and was significantly associated with a decreased mortality risk. They concluded that participation in ESAS symptoms reporting was associated with improved survival in cancer patients. Basch et al. Reference Basch, Deal and Kris19 conducted a study among 766 cancer patients to test if systematic collection of patient-reported symptoms during chemotherapy with alerts to clinicians for severe or worsening symptoms improves health-related quality of life, survival, emergency room visit and hospitalisation. Among patients in the intervention group (where nurses performed direct interventions upon an alert for severe or worsening symptoms), they reported improved health-related quality of life, less frequent admissions to emergency clinics or hospitalised, and improved quality-adjusted survival. According to Yokomichi et al. Reference Yokomichi, Morita and Nitto4 , regular symptom assessment has potentially identified overlooked symptoms, facilitated treatment and promoted patient and family satisfaction. Tran et al. Reference Tran, Zomer and Chadder18 reported that the integration of patient-reported outcome measures into routine oncologic care can improve patient–clinician communication, satisfaction with care, symptom management, quality of life and overall survival. In a retrospective single-centre cohort study, Graham et al. Reference Graham, Gingerich, Lambert, Alamri and Czaykowski53 investigated symptom burden measured using ESAS among 68 patients. They concluded that symptom burden measured by ESAS score provides prognostic information for survival in patients with metastatic renal cell carcinoma.
Strengths and limitations of the study
The major strengths of our study lie in 1) large number of patients to improve its generalisability, 2) a balanced ratio between male and female, 3) a wider range of patient age, 4) different primary disease sites, 5) the inclusion of patients receiving care in different clinical settings, 6) the ESAS is a well-validated patient reporting tool which has been used successfully in several oncologic setting and 7) the availability of volunteers in the clinic to help patients who may be computer-inexperienced. However, the main limitations of the study are as follows: 1) it was conducted at a single institution, and the findings may not be generalisable to other institutions with different patients’ demographics, 2) the ESAS questionnaires are generic and not symptom-specific, 3) the ESAS assesses symptom intensity only quantitatively, 4) the completion of the ESAS was voluntarily, and certain patients are more likely to complete an assessment, 5) the ESAS completion may be associated with other factors such as increased health literacy or ability to self-manage symptoms, and 6) the symptom severity in this study was evaluated based on ESAS intensity scores alone, and differences in symptom reporting may not necessarily reflect the true differences in the symptom being experienced by the patient.
Conclusions
Integration of patient-reported symptom outcome measures in routine oncologic care is useful to determine patterns of symptom burden and the design of patient-centred supportive care needs. Thus, patient symptom management is an important component of comprehensive oncologic care. Our study on symptom severity shows that symptom patterns of cancer patients differ according to age, gender and primary disease site. Tiredness was the most commonly reported symptom distress with the highest mean severity score across all gender, age and primary disease sites. Older cancer patients reported worse overall physical function including shortness of breath, lack of appetite, drowsiness, tiredness and overall wellbeing, and female patients reported the highest mean severity scores for tiredness, depression, anxiety and overall wellbeing compared to male patients. The awareness of gender, age and primary disease site-related symptom variations and knowledge of specific groups with higher risks of specific symptoms is very important in cancer care and will enable clinicians and healthcare providers to develop and provide appropriate symptom-directed patient-focused interventions for the specific subgroups of patients. In our clinical practice, the ESAS is used for symptom screening and monitoring, and the results are reviewed by clinicians to establish baselines in patients’ symptoms and/or to trigger further in-depth patient assessments. The assessments may lead to interventions at the clinic level or result in referrals to the appropriate services such as pain and symptom management, psychiatry, registered dietitian, social worker or spiritual care. Furthermore, reviewing the results could highlight the fluctuating nature of symptom intensity, which is related to disease trajectory, effectiveness of symptom management strategies and variations in symptom expression, which according to Barbera et al. Reference Barbera, Sutradhar and Seow77 relates to improved survival in cancer patients as well as better outcomes in patient satisfaction. In a changing oncologic healthcare delivery system where patient-centeredness is prioritised, self-reporting symptom engages patients as actively involved in their care provision and could improve patients’ experience and outcomes of care delivery.
Supplementary Material
To view supplementary material for this article, please visit https://doi.org/10.1017/S1460396922000255
Acknowledgement
The authors would like to acknowledge with much gratitude the support from OH-CCO staff for supplying the data. We also would like to express our gratitude to Stephanie Swanson, MSc student at the University of Waterloo for her guidance during the data analysis.
Conflict of Interest
The authors declare that the research was conducted in the absence of any commercial or financial relationships that could be construed as a potential conflict of interest.
Ethics Approval
This study was approved by the Tri-Hospital Research Ethics Board