1 Introduction
One promising means of reducing the atmospheric emissions of carbon dioxide (
 $\text{CO}_{2}$
) is to store it in deep geological formations (Metz et al.
Reference Metz, Davidson, de Coninck, Loos and Meyer2005; Orr Reference Orr2009). When
 $\text{CO}_{2}$
is injected into a saline aquifer, it forms an immiscible
 $\text{CO}_{2}$
-rich vapour phase which is lighter than the aqueous brine and accumulates at the top of the storage formation. The
 $\text{CO}_{2}$
dissolves into the underlying brine and forms a diffusive boundary layer beneath the gas–water contact. The brine density increases with aqueous
 $\text{CO}_{2}$
concentration and the boundary layer can become unstable and lead to convective overturn within the brine (Weir, White & Kissling Reference Weir, White and Kissling1995; Ennis-King, Preston & Paterson Reference Ennis-King, Preston and Paterson2005). Convective mass transfer can greatly increase the dissolution rate of the injected buoyant
 $\text{CO}_{2}$
vapour and hence contributes to safe long-term storage (Neufeld et al.
Reference Neufeld, Hesse, Riaz, Hallworth, Tchelepi and Huppert2010; Sathaye et al.
Reference Sathaye, Hesse, Cassidy and Stockli2014).
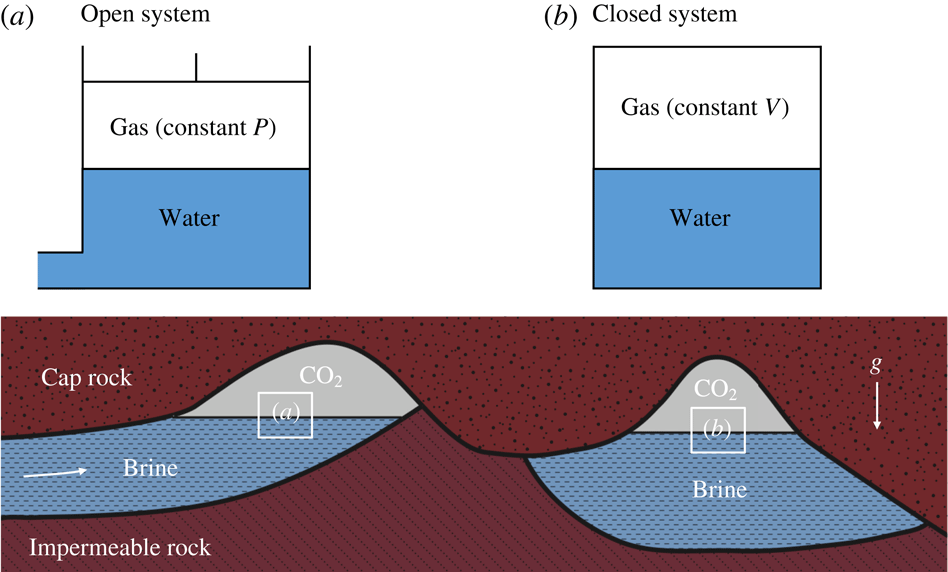
Schematic showing natural
 $\text{CO}_{2}$
reservoirs with and without structural closure. In system (a), the brine can easily move laterally due to the open structure: as
 $\text{CO}_{2}$
dissolves in the brine, new brine will be filled into the reservoir, thereby raising the
 $\text{CO}_{2}$
–brine interface and keeping the gas pressure constant; in system (b), no brine can escape from or be filled into the reservoir due to the structural closure, so that the interface is fixed and the dissolution of
 $\text{CO}_{2}$
will reduce the gas pressure. We refer to the systems (a) and (b) as open and closed systems, respectively, and the corresponding idealised rectangular systems are shown at the top.

This application has motivated a large amount of recent work on convection in porous media (Huppert & Neufeld Reference Huppert and Neufeld2014; Riaz & Cinar Reference Riaz and Cinar2014; Emami-Meybodi et al. Reference Emami-Meybodi, Hassanzadeh, Green and Ennis-King2015). Work in fluid dynamics has focused on a simplified model problem that considers convection in the brine driven by a constant concentration applied at the top of the domain. At high Rayleigh numbers, the mass transfer is generally characterised by the succession of three dynamic regimes: an initial diffusive decline until the boundary layer becomes unstable, followed by convective dissolution at constant rate, and finally a rapid decline in dissolution rate as the brine saturates and convection shuts down. Most work has focused on determining the onset of convection (Ennis-King et al. Reference Ennis-King, Preston and Paterson2005; Hassanzadeh, Pooladi-Darvish & Keith Reference Hassanzadeh, Pooladi-Darvish and Keith2006; Riaz et al. Reference Riaz, Hesse, Tchelepi and Orr2006; Xu, Chen & Zhang Reference Xu, Chen and Zhang2006), the convective dissolution rate (Neufeld et al. Reference Neufeld, Hesse, Riaz, Hallworth, Tchelepi and Huppert2010; Pau et al. Reference Pau, Bell, Pruess, Almgren, Lijewski and Zhang2010; Hewitt, Neufeld & Lister Reference Hewitt, Neufeld and Lister2012; Hidalgo et al. Reference Hidalgo, Fe, Cueto-Felgueroso and Juanes2012), and the shut-down of convection (Slim & Ramakrishnan Reference Slim and Ramakrishnan2010; Hewitt, Neufeld & Lister Reference Hewitt, Neufeld and Lister2013; Slim et al. Reference Slim, Bandi, Miller and Mahadevan2013).
A geological storage site can either be an open or a closed system (see figure 1). Open sites are typically laterally extensive and allow the compensation of pressure changes by brine migration. In an open system,
 $\text{CO}_{2}$
dissolution typically leads to a reduction in the volume of the
 $\text{CO}_{2}$
vapour over time, while the
 $\text{CO}_{2}$
pressure remains approximately constant due to inflow of brine. The aqueous
 $\text{CO}_{2}$
concentration beneath the gas–water contact and, therefore, the density difference driving convective dissolution remain constant. In an open system an infinite volume of brine is available, so that all injected
 $\text{CO}_{2}$
dissolves eventually. Convective dissolution in an open system therefore proceeds at a constant rate until the dense
 $\text{CO}_{2}$
saturated fingers begin to interact with the base of the aquifer and dissolution becomes limited by lateral
 $\text{CO}_{2}$
transport (Szulczewski, Hesse & Juanes Reference Szulczewski, Hesse and Juanes2013; Unwin, Wells & Woods Reference Unwin, Wells and Woods2016).
Closed sites are typically fault bounded and do not allow compensation of pressure changes by brine migration. Therefore, the volume of
 $\text{CO}_{2}$
vapour in a closed system remains essentially constant over time, and consequently
 $\text{CO}_{2}$
dissolution reduces the pressure in the vapour phase (Akhbari & Hesse Reference Akhbari and Hesse2017). This leads to a decline of the aqueous
 $\text{CO}_{2}$
concentration beneath the gas–water contact and therefore reduces the density difference driving convective dissolution. In addition, the volume of brine in a closed system is finite and may further limit the dissolution into the brine. Convective dissolution of
 $\text{CO}_{2}$
in a closed system is therefore limited by both the pressure drop in the vapour and the saturation of the underlying brine. Previous studies of convection in a closed system have assumed a constant
 $\text{CO}_{2}$
concentration at the top boundary, and hence focused on the latter (Slim & Ramakrishnan Reference Slim and Ramakrishnan2010; Hewitt et al.
Reference Hewitt, Neufeld and Lister2013; Slim et al.
Reference Slim, Bandi, Miller and Mahadevan2013; Slim Reference Slim2014; Paoli, Zonta & Soldati Reference Paoli, Zonta and Soldati2016, Reference Paoli, Zonta and Soldati2017). Here we show that the pressure drop in the gas can limit
 $\text{CO}_{2}$
dissolution long before saturation of the brine becomes a limiting factor. These negative feedbacks in closed systems are common in experiments on
 $\text{CO}_{2}$
dissolution with a pressure range of 0.1–7.0 MPa (Tse & Sandall Reference Tse and Sandall1979; Riazi Reference Riazi1996; Wang, Lang & Guo Reference Wang, Lang and Guo1996; Zhang, Hyndman & Maini Reference Zhang, Hyndman and Maini2000; Sheikha, Pooladi-Darvish & Mehrotra Reference Sheikha, Pooladi-Darvish and Mehrotra2005; Farajzadeh, Zitha & Bruining Reference Farajzadeh, Zitha and Bruining2007, Reference Farajzadeh, Zitha and Bruining2009; Moghaddam et al.
Reference Moghaddam, Rostami, Pourafshary and Fallahzadeh2012; Azin et al.
Reference Azin, Mahmoudy, Raad and Osfouri2013; Mojtaba et al.
Reference Mojtaba, Behzad, Rasoul and Mohammad2014; Raad, Azin & Osfouri Reference Raad, Azin and Osfouri2015; Ma et al.
Reference Ma, Abe, Kaneko, Fujimoto and Murakami2017; Shi et al.
Reference Shi, Wen, Hesse, Tsotsis and Jessen2018), and in some natural
 $\text{CO}_{2}$
reservoirs that serve as analogues for geological
 $\text{CO}_{2}$
storage (Akhbari & Hesse Reference Akhbari and Hesse2017).
It is remarkable that many natural
 $\text{CO}_{2}$
reservoirs in the continental USA are at pressures significantly less than the critical value 7.39 MPa for a supercritical state, and hence contain
 $\text{CO}_{2}$
in a gaseous state (Miocic et al.
Reference Miocic, Gilfillan, Roberts, Edlmann, McDermott and Haszeldine2016; Akhbari & Hesse Reference Akhbari and Hesse2017). In particular, this is the case for the Bravo Dome natural
 $\text{CO}_{2}$
reservoir (with the pressure mostly between 2 MPa and 4 MPa), which is commonly considered as an analogue for engineered
 $\text{CO}_{2}$
storage (Broadhead Reference Broadhead1987, Reference Broadhead1990; Gilfillan et al.
Reference Gilfillan, Ballentine, Holland, Blagburn, Lollar, Stevens, Schoell and Cassidy2008, Reference Gilfillan, Lollar, Holland, Blagburn, Stevens, Schoell, Cassidy, Ding, Zhou, Lacrampe-Couloume and Ballentine2009; Sathaye et al.
Reference Sathaye, Hesse, Cassidy and Stockli2014; Akhbari & Hesse Reference Akhbari and Hesse2017). Therefore, to simplify the analysis and emphasise the essential new feedback, in this study we focus on the low-pressure case (below 1 MPa) and assume that phase behaviour in the closed system is ideal. However, we have used the same modelling approach to describe higher-pressure dissolution experiments for
 $\text{CO}_{2}$
in Shi et al. (Reference Shi, Wen, Hesse, Tsotsis and Jessen2018) (with the initial pressure
 ${\approx}\,6~\text{MPa}$
), so that the analysis presented here is not limited to the ideal case, but has practical significance for exploring the dynamics of convective
 $\text{CO}_{2}$
dissolution in both laboratory experiments and several underpressured natural
 $\text{CO}_{2}$
reservoirs, where
 $\text{CO}_{2}$
behaves as a real gas.
Below we give units to avoid confusion that can arise from multiple definitions used for the Henry’s law constant. The
 $\text{CO}_{2}$
vapour is assumed to be an ideal gas,
 $$\begin{eqnarray}\displaystyle P_{g}^{\ast }V_{g}^{\ast }=n_{g}RT, & & \displaystyle\end{eqnarray}$$
where
 $P_{g}^{\ast }$
(Pa) is the gas pressure,
 $V_{g}^{\ast }$
(
 $\text{m}^{3}$
) is the gas volume,
 $n_{g}$
(mol) is the amount of gas in moles,
 $R$
(
 $\text{kg}~\text{m}^{2}~\text{s}^{-2}~\text{K}^{-1}~\text{mol}^{-1}$
) is the universal gas constant, and
 $T$
(K) is the absolute temperature. The aqueous solution is dilute, so that the local equilibrium between this gas and the dissolved aqueous
 $\text{CO}_{2}$
at the gas–water contact is given by Henry’s law
 $$\begin{eqnarray}\displaystyle C_{s}^{\ast }=P_{g}^{\ast }K_{h}, & & \displaystyle\end{eqnarray}$$
where
 $C_{s}^{\ast }$
(
 $\text{mol}~\text{m}^{-3}$
) is the dissolved gas concentration and
 $K_{h}$
(
 $\text{mol}~\text{m}^{-3}~\text{Pa}^{-1}$
) is the Henry’s law solubility constant. The amount of
 $\text{CO}_{2}$
dissolved into a volume of water,
 $V_{w}^{\ast }$
(
 $\text{m}^{3}$
), in equilibrium with the gas is therefore given by
 $n_{w}=V_{w}^{\ast }K_{h}P_{g}^{\ast }$
(mol). Since our study is performed in a closed system, the total volume, i.e.
 $V_{g}^{\ast }+V_{w}^{\ast }$
, and the total amount of
 $\text{CO}_{2}$
, i.e.
 $n_{g}+n_{w}$
, remain constant. We note that in modelling of convection, our analysis ignores the slight change in water volume upon
 $\text{CO}_{2}$
dissolution as well as the evaporation of water into the gas, both of which are negligible for ideal-gas and certain high-pressure real-gas systems due to the low solubility of
 $\text{CO}_{2}$
in water and the low vapour pressure of water at a given temperature of interest in many previous studies (Ma et al.
Reference Ma, Abe, Kaneko, Fujimoto and Murakami2017; Shi et al.
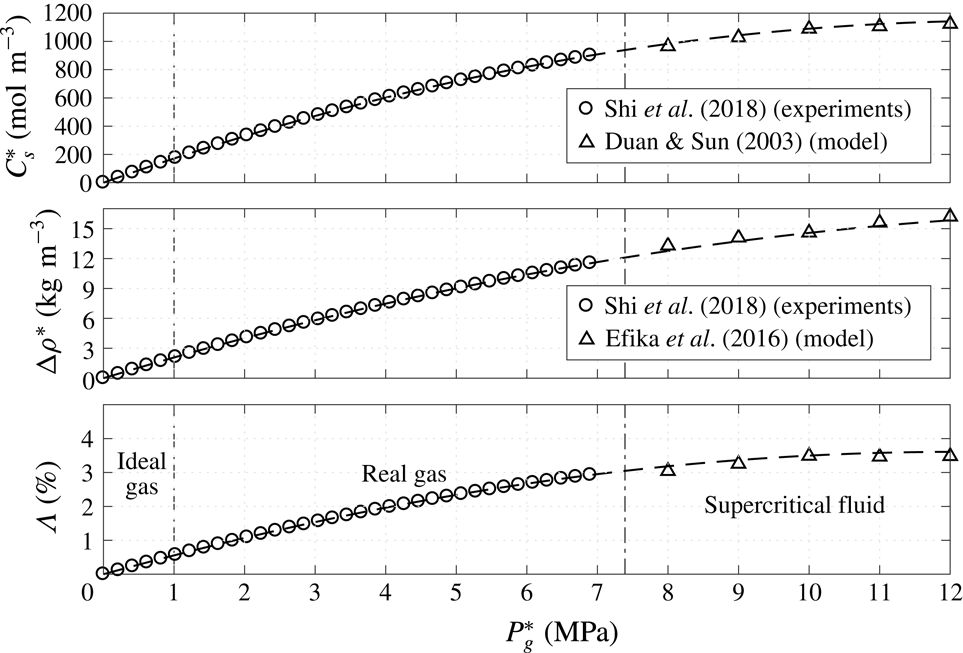
Reference Shi, Wen, Hesse, Tsotsis and Jessen2018). In appendix A, we show that the volume change of the aqueous phase due to the
 $\text{CO}_{2}$
dissolution is negligible under ideal conditions and less than 3 % for
 $P_{g}^{\ast }\leqslant 7$
MPa at
 $T=50\,^{\circ }\text{C}$
.
Consider a closed system that is initially out of equilibrium and contains a gas with a pressure
 $P_{g,0}^{\ast }$
in contact with a finite volume of water containing no dissolved gas. Once the system reaches equilibrium, the normalised final gas pressure and dissolved concentration are given by
 $$\begin{eqnarray}\displaystyle \frac{P_{g,e}^{\ast }}{P_{g,0}^{\ast }}=\frac{C_{s,e}^{\ast }}{C_{s,0}^{\ast }}=\frac{n_{g,e}}{n_{g,e}+n_{w,e}}=\frac{1}{1+n_{w,e}/n_{g,e}}, & & \displaystyle\end{eqnarray}$$
where the subscript ‘
 $e$
’ denotes the final equilibrium state, and
 $C_{s,0}^{\ast }=K_{h}P_{g,0}^{\ast }$
is the dissolved concentration at the interface in local equilibrium with the initial pressure. We define the ratio of dissolved to gaseous
 $\text{CO}_{2}$
molecules at global equilibrium as a new dimensionless parameter
 $$\begin{eqnarray}\displaystyle \unicode[STIX]{x1D6F1}=\frac{n_{w,e}}{n_{g,e}}=\frac{V_{w}^{\ast }}{V_{g}^{\ast }}K_{h}RT. & & \displaystyle\end{eqnarray}$$
This dissolution capacity is a new dimensionless parameter governing both diffusive and convective mass transport in an ideal closed system. The pressure drop in a closed system increases with the dissolution capacity. In the limit of small
 $\unicode[STIX]{x1D6F1}$
, the pressure drop in the gas becomes negligible and some open system behaviour (i.e. constant
 $C_{s}^{\ast }$
) is recovered. Thus, most previous investigations (Ennis-King et al.
Reference Ennis-King, Preston and Paterson2005; Riaz et al.
Reference Riaz, Hesse, Tchelepi and Orr2006; Pau et al.
Reference Pau, Bell, Pruess, Almgren, Lijewski and Zhang2010; Hewitt et al.
Reference Hewitt, Neufeld and Lister2013; Slim Reference Slim2014; Paoli et al.
Reference Paoli, Zonta and Soldati2017), which assume a constant
 $\text{CO}_{2}$
concentration at the top boundary without new water filled into or moved out of the system, correspond to the particular case
 $\unicode[STIX]{x1D6F1}=0$
of closed systems.
The remainder of this paper is organised as follows. In the next section, we formulate the dimensional model of convection in the closed porous media system, non-dimensionalise the governing equations, and describe the numerical method to solve these dimensionless equations. In § 3, we give analytic solutions for diffusion in a closed system at early and late times and then investigate the effect of
 $\unicode[STIX]{x1D6F1}$
on the onset of convection using direct numerical simulations (DNS). In § 4, DNS results are reported for high-Rayleigh-number solutal convection in closed systems, and the corresponding mathematical models of various dissolution quantities are developed for both the quasi-steady convective and the shut-down regimes. In § 5, we use our models to qualitatively estimate the dissolution process in reservoirs with typical parameter values obtained from geological storage sites, and show some moderate-Rayleigh-number DNS results to more comprehensively understand the dynamics of
 $\text{CO}_{2}$
dissolution in Bravo Dome natural gas reservoir. Finally, we summarise the key results in § 6.
2 Problem formulation
2.1 Dimensional equations
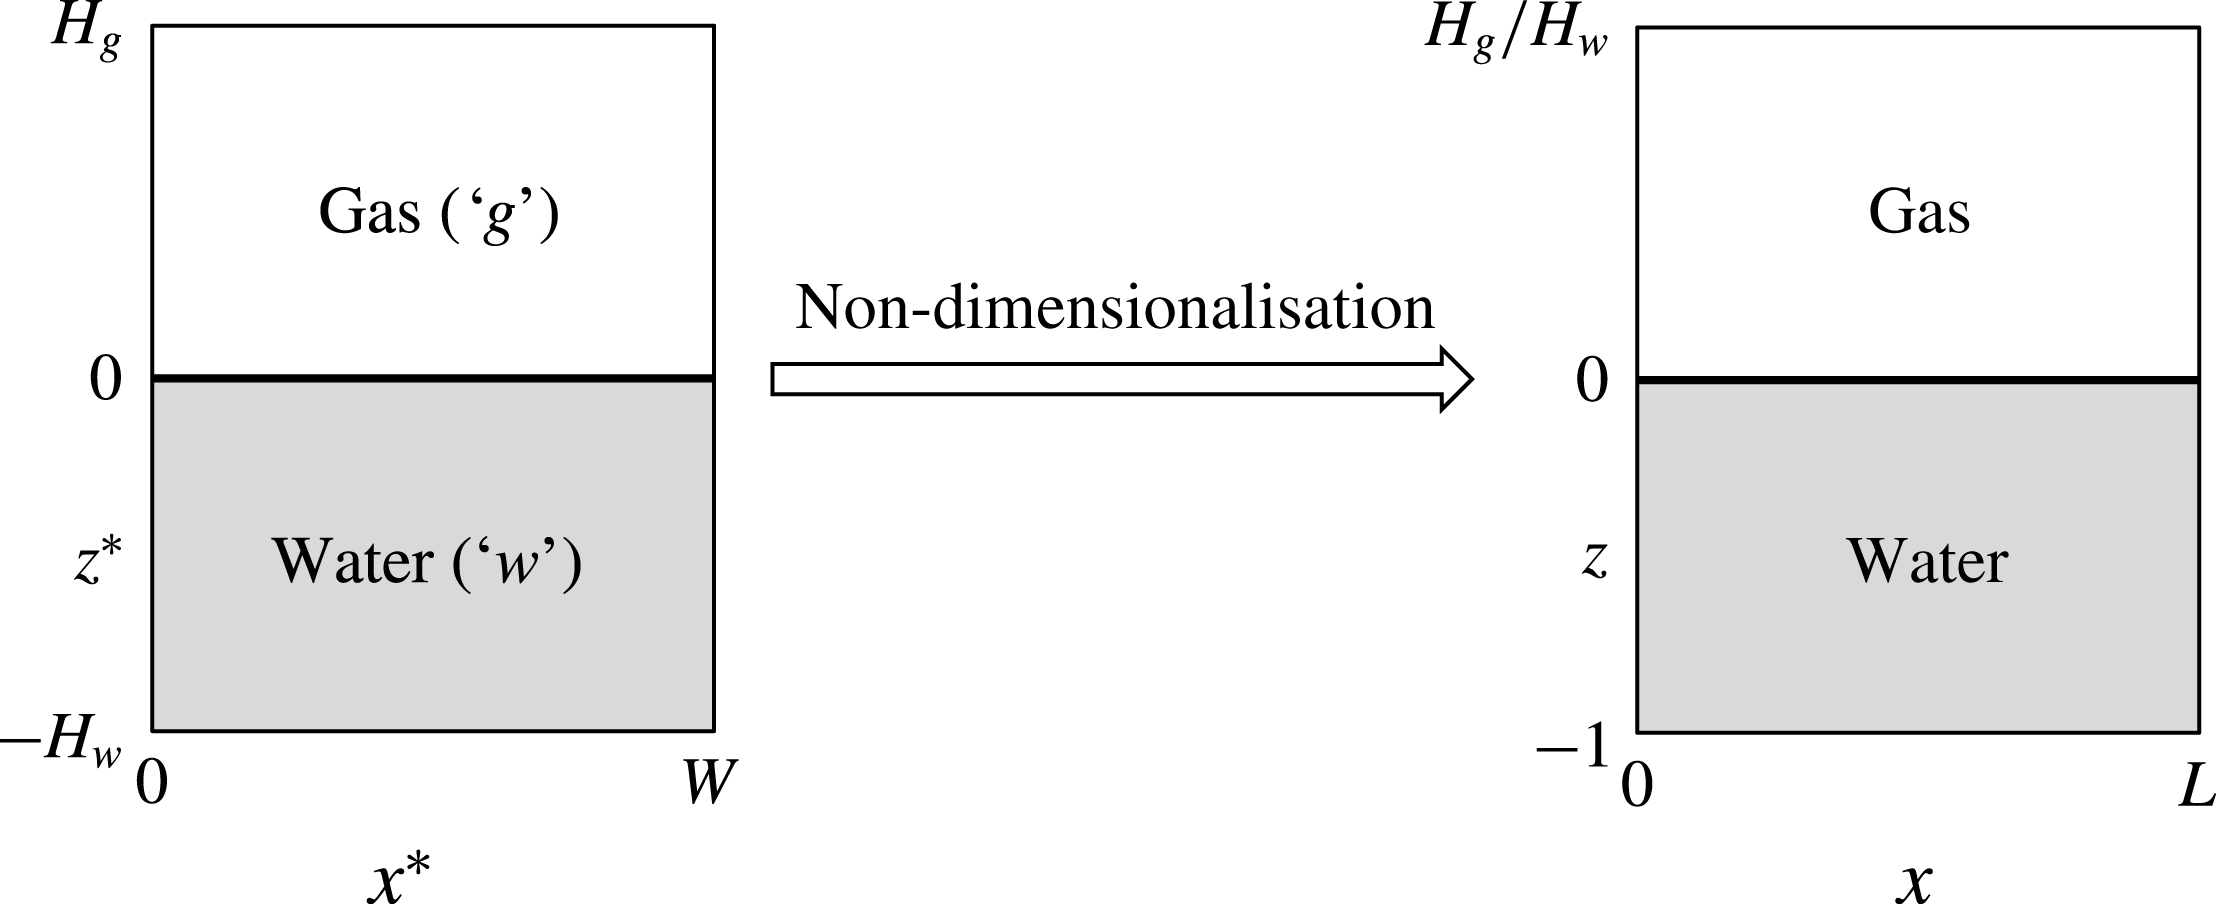
Consider a two-dimensional (2D), homogeneous, and isotropic porous medium containing gas overlying water (see figure 2). In the limit of negligible capillary forces, the phases are segregated by buoyancy and separated by a sharp interface at
 $z^{\ast }=0$
(Golding et al.
Reference Golding, Neufeld, Hesse and Huppert2011; Martinez & Hesse Reference Martinez and Hesse2016). Therefore, the upper part of the domain,
 $0<z^{\ast }<H_{g}$
, is occupied only by gas and the lower part,
 $-H_{w}<z^{\ast }<0$
, is occupied solely by water. Instead of a laterally closed domain we consider a
 $W$
-periodic domain to simplify the DNS in § 2.3. In terms of the overall mass balance the periodic system is identical to the closed system.
Geometry for 2D closed porous media system. The dimensional periodic domain (left) has heights
 $H_{g}$
and
 $H_{w}$
for the gas and water fields, respectively, and width
 $W$
.
 $L=W/H_{w}$
is the domain aspect ratio for the water field. The continuous dissolution of the gas into the underlying water reduces the gas pressure and then decreases the saturated concentration of water.

We assume the gas is ideal and well-mixed, so that the pressure is uniform and given by (1.1). The water is incompressible and Boussinesq approximation is valid. We neglect the volume change of water due to the
 $\text{CO}_{2}$
dissolution in the modelling of convection (see appendix A), so that the domains containing water and gas are fixed,
 $H_{g}$
and
 $H_{w}$
are constant, and the interface remains at
 $z^{\ast }=0$
. The system is closed, so that gas and water are coupled through a global mass balance and the local chemical equilibrium along the interface, given by (1.2). Therefore, the governing equations for convection in a closed system comprise a system of partial differential equations (PDEs) describing the convective mass transport in the water and an ordinary differential equation (ODE) for the evolution of the gas. The ODE is coupled to the system of PDEs though the mass flux,
 $F^{\ast }$
, across the interface.
The solute-driven convection in the water is governed by the mass balance of the dissolved gas and the mass and momentum balance of the water itself. The concentration of dissolved gas in the water,
 $C_{w}^{\ast }$
, evolves due to both diffusive and convective transport following
 $$\begin{eqnarray}\displaystyle {\displaystyle \frac{\unicode[STIX]{x2202}C_{w}^{\ast }}{\unicode[STIX]{x2202}t^{\ast }}}+\unicode[STIX]{x1D735}^{\ast }\boldsymbol{\cdot }(\boldsymbol{u}_{w}^{\ast }C_{w}^{\ast })=D\unicode[STIX]{x1D6FB}^{\ast 2}C_{w}^{\ast }, & & \displaystyle\end{eqnarray}$$
where
 $D$
is the diffusivity and
 $\boldsymbol{u}_{w}^{\ast }=(u^{\ast },w^{\ast })$
the volume-averaged pore velocity. The latter is given by Darcy’s law and continuity, so that
 $$\begin{eqnarray}\displaystyle & \displaystyle \boldsymbol{u}_{w}^{\ast }=-{\displaystyle \frac{K}{\unicode[STIX]{x1D707}\unicode[STIX]{x1D711}}}(\unicode[STIX]{x1D735}^{\ast }P_{w}^{\ast }+\unicode[STIX]{x1D70C}_{w}^{\ast }g\boldsymbol{e}_{z^{\ast }}), & \displaystyle\end{eqnarray}$$
 $$\begin{eqnarray}\displaystyle & \displaystyle \unicode[STIX]{x1D735}^{\ast }\boldsymbol{\cdot }\boldsymbol{u}_{w}^{\ast }=0, & \displaystyle\end{eqnarray}$$
where
 $K$
is the medium permeability,
 $\unicode[STIX]{x1D707}$
is the dynamic viscosity of the fluid,
 $\unicode[STIX]{x1D711}$
is the porosity,
 $P_{w}^{\ast }$
is the pressure in the water field,
 $g$
is the acceleration of gravity and
 $\boldsymbol{e}_{z^{\ast }}$
is a unit vector in the
 $z^{\ast }$
direction. The density,
 $\unicode[STIX]{x1D70C}_{w}^{\ast }$
, is assumed to be a linear function of the concentration
 $$\begin{eqnarray}\displaystyle \unicode[STIX]{x1D70C}_{w}^{\ast }=\unicode[STIX]{x1D70C}_{0}^{\ast }+\unicode[STIX]{x0394}\unicode[STIX]{x1D70C}_{0}^{\ast }{\displaystyle \frac{C_{w}^{\ast }}{C_{s,0}^{\ast }}}, & & \displaystyle\end{eqnarray}$$
where
 $\unicode[STIX]{x1D70C}_{0}^{\ast }$
is density of the fresh water and
 $\unicode[STIX]{x0394}\unicode[STIX]{x1D70C}_{0}^{\ast }$
is the density difference between the fresh water and the saturated water at the initial pressure. The water contains no dissolved gas so that the initial condition is
 $$\begin{eqnarray}\displaystyle C_{w}^{\ast }|_{t^{\ast }=0}=0\quad \text{for}~z^{\ast }<0. & & \displaystyle\end{eqnarray}$$
The domain is
 $W$
-periodic in the
 $x^{\ast }$
direction and impermeable to flow at top and bottom. At the bottom of the domain, the boundary conditions are homogeneous:
 $$\begin{eqnarray}\displaystyle \left.{\displaystyle \frac{\unicode[STIX]{x2202}C_{w}^{\ast }}{\unicode[STIX]{x2202}z^{\ast }}}\right|_{z^{\ast }=-H_{w}}=0\quad \text{and}\quad w^{\ast }|_{z^{\ast }=-H_{w}}=0. & & \displaystyle\end{eqnarray}$$
The dissolved concentration at the interface is determined by local equilibrium with the gas, so that the boundary conditions at the top are given by
 $$\begin{eqnarray}\displaystyle C_{w}^{\ast }|_{z^{\ast }=0}=C_{s}^{\ast }(t^{\ast })\quad \text{and}\quad w^{\ast }|_{z^{\ast }=0}=0. & & \displaystyle\end{eqnarray}$$
The evolution of the dissolved gas concentration at the interface,
 $C_{s}^{\ast }$
, is determined by mass balance of the gas, given by
 $$\begin{eqnarray}\displaystyle \frac{\text{d}n_{g}}{\text{d}t^{\ast }}=-AF^{\ast }, & & \displaystyle\end{eqnarray}$$
where
 $A$
is the area of the interface at
 $z^{\ast }=0$
(in the 2D system,
 $A=W$
) and
 $F^{\ast }$
is the mole flux from the gas into the water. This flux can be evaluated as
 $$\begin{eqnarray}\displaystyle F^{\ast }=\left.D\frac{\unicode[STIX]{x2202}\overline{C_{w}^{\ast }}}{\unicode[STIX]{x2202}z^{\ast }}\right|_{z^{\ast }=0}=\frac{D}{W}\int _{0}^{W}\left.\frac{\unicode[STIX]{x2202}C_{w}^{\ast }}{\unicode[STIX]{x2202}z^{\ast }}\right|_{z^{\ast }=0}\,\text{d}x^{\ast }, & & \displaystyle\end{eqnarray}$$
where the overline denotes the horizontal average as defined above. Combining (1.1), (1.2), (2.5), with (2.6) results in the ODE for the evolution of the dissolved concentration at the interface
 $$\begin{eqnarray}\displaystyle \frac{\text{d}C_{s}^{\ast }}{\text{d}t^{\ast }}=-\frac{K_{h}RT}{H_{g}}F^{\ast }=-\frac{K_{h}RTD}{H_{g}}\left.\frac{\unicode[STIX]{x2202}\overline{C_{w}^{\ast }}}{\unicode[STIX]{x2202}z^{\ast }}\right|_{z^{\ast }=0}, & & \displaystyle\end{eqnarray}$$
with the initial condition
 $$\begin{eqnarray}\displaystyle C_{s}^{\ast }|_{t^{\ast }=0}=C_{s,0}^{\ast }=K_{h}P_{g,0}^{\ast }. & & \displaystyle\end{eqnarray}$$
This ODE is coupled to the system (2.1) through the flux (2.6).
2.2 Dimensionless equations
A uniform non-dimensionalisation of the model problem is difficult, since the dominant length scales change with time (Riaz et al.
Reference Riaz, Hesse, Tchelepi and Orr2006; Hewitt et al.
Reference Hewitt, Neufeld and Lister2013; Slim et al.
Reference Slim, Bandi, Miller and Mahadevan2013). Porous media convection is governed by the Rayleigh–Darcy number,
 $Ra={\mathcal{U}}{\mathcal{H}}/D$
, where
 ${\mathcal{U}}$
and
 ${\mathcal{H}}$
are suitable velocity and length scales, respectively (Horton & Rogers Reference Horton and Rogers1945; Lapwood Reference Lapwood1948). The Rayleigh–Darcy number is effectively a Péclet number and can be interpreted as the ratio between diffusive,
 ${\mathcal{T}}_{d}={\mathcal{H}}^{2}/D$
, and advective,
 ${\mathcal{T}}_{a}={\mathcal{H}}/{\mathcal{U}}$
, time scales,
 $Ra={\mathcal{T}}_{d}/{\mathcal{T}}_{a}$
.
The natural velocity scale in the convecting system is the buoyancy velocity,
 ${\mathcal{U}}=K\unicode[STIX]{x0394}\unicode[STIX]{x1D70C}_{0}^{\ast }g/(\unicode[STIX]{x1D707}\unicode[STIX]{x1D711})$
. Convection initiates along the top boundary and penetrates into the domain at a speed proportional to
 ${\mathcal{U}}$
. At early time, after onset of convection but before convection spans the entire domain, the thickness of the diffusive boundary layer,
 $D/{\mathcal{U}}$
, provides an natural length scale (Riaz et al.
Reference Riaz, Hesse, Tchelepi and Orr2006). At later time, convection interacts with the bottom boundary and the domain height,
 $H_{w}$
, is the appropriate length scale. Advection and diffusion balance across the boundary layer, so that the advective and diffusive time scales are identical at early time,
 ${\mathcal{T}}_{ad}=D/{\mathcal{U}}^{2}$
(Slim Reference Slim2014). Scaling the system by the thickness of the diffusive boundary layer sets the Rayleigh number to unity and highlights the universal behaviour of the early convecting system.
Below we assume that
 ${\mathcal{T}}_{d}$
and
 ${\mathcal{T}}_{a}$
are based on
 $H_{w}$
, appropriate for the long-term evolution of the convecting system. These two late time scales are related to the early time scale as follows:
 $$\begin{eqnarray}\displaystyle {\mathcal{T}}_{ad}={\mathcal{T}}_{a}/Ra_{0}={\mathcal{T}}_{d}/Ra_{0}^{2},\quad \text{where}~Ra_{0}=\frac{K\unicode[STIX]{x0394}\unicode[STIX]{x1D70C}_{0}^{\ast }gH_{w}}{\unicode[STIX]{x1D711}\unicode[STIX]{x1D707}D} & & \displaystyle\end{eqnarray}$$
is the Rayleigh–Darcy number based on the initial density difference. In a convecting system
 $Ra_{0}\gg 1$
, so that the magnitudes of these time scales differ significantly.
To allow reduction of the governing equations to a purely diffusive system we choose the diffusive time,
 ${\mathcal{T}}_{d}=H_{w}^{2}/D$
, as characteristic time scale and define the following dimensionless variables:
 $$\begin{eqnarray}\displaystyle \boldsymbol{x}={\displaystyle \frac{\boldsymbol{x}^{\ast }}{H_{w}}},\quad \unicode[STIX]{x1D70C}={\displaystyle \frac{\unicode[STIX]{x1D70C}_{w}^{\ast }}{\unicode[STIX]{x0394}\unicode[STIX]{x1D70C}_{0}^{\ast }}},\quad t={\displaystyle \frac{t^{\ast }}{{\mathcal{T}}_{d}}},\quad \boldsymbol{u}={\displaystyle \frac{\boldsymbol{u}_{w}^{\ast }}{{\mathcal{U}}}},\quad \tilde{P}={\displaystyle \frac{P_{w}^{\ast }}{\unicode[STIX]{x0394}\unicode[STIX]{x1D70C}_{0}^{\ast }gH_{w}}},\quad C={\displaystyle \frac{C_{w}^{\ast }}{C_{s,0}^{\ast }}}. & & \displaystyle\end{eqnarray}$$
Substituting these scales into (2.1) leads to the following dimensionless governing equations:
 $$\begin{eqnarray}\displaystyle & \displaystyle {\displaystyle \frac{\unicode[STIX]{x2202}C}{\unicode[STIX]{x2202}t}}+Ra_{0}\boldsymbol{u}\boldsymbol{\cdot }\unicode[STIX]{x1D735}C=\unicode[STIX]{x1D6FB}^{2}C, & \displaystyle\end{eqnarray}$$
 $$\begin{eqnarray}\displaystyle & \displaystyle \boldsymbol{u}=-\unicode[STIX]{x1D735}P-C\boldsymbol{e}_{z}, & \displaystyle\end{eqnarray}$$
 $$\begin{eqnarray}\displaystyle & \displaystyle \unicode[STIX]{x1D735}\boldsymbol{\cdot }\boldsymbol{u}=0, & \displaystyle\end{eqnarray}$$
 $P=\tilde{P}+(\unicode[STIX]{x1D70C}_{0}^{\ast }/\unicode[STIX]{x0394}\unicode[STIX]{x1D70C}_{0}^{\ast })z$
and
 $Ra_{0}$
is the initial Rayleigh–Darcy number defined in (2.9). This system of equations is solved subject to the dimensionless initial condition
 $$\begin{eqnarray}\displaystyle C|_{t=0}=0\quad \text{for}~z<0, & & \displaystyle\end{eqnarray}$$
and boundary conditions
 $$\begin{eqnarray}\displaystyle \left.{\displaystyle \frac{\unicode[STIX]{x2202}C}{\unicode[STIX]{x2202}z}}\right|_{z=-1}=w|_{z=-1}=0;\quad C|_{z=0}=C_{s}(t)\quad \text{and}\quad w|_{z=0}=0, & & \displaystyle\end{eqnarray}$$
where
 $C_{s}$
is the dimensionless dissolved concentration at the interface. Note that here
 $C_{s}$
is also identical to the normalised gas pressure from Henry’s law and ideal-gas law, i.e.
 $C_{s}=P_{g}^{\ast }/P_{g,0}^{\ast }$
. The evolution of
 $C_{s}$
is given by the following ODE and initial condition:
 $$\begin{eqnarray}\displaystyle {\displaystyle \frac{\text{d}C_{s}}{\text{d}t}}=-\unicode[STIX]{x1D6F1}\left.\frac{\unicode[STIX]{x2202}\overline{C}}{\unicode[STIX]{x2202}z}\right|_{z=0}\quad \text{and}\quad C_{s}|_{t=0}=1, & & \displaystyle\end{eqnarray}$$
where
 $\unicode[STIX]{x1D6F1}$
is the dissolution capacity, defined by (1.4). The equation (2.14) actually works as a Robin boundary condition for the concentration field in the water. Similar boundary conditions are also utilised in some thermal porous media convection with imperfectly conducting boundaries (Wilkes Reference Wilkes1995; Kubitschek & Weidman Reference Kubitschek and Weidman2003; Barletta & Storesletten Reference Barletta and Storesletten2012; Barletta, Tyvand & Nygøard Reference Barletta, Tyvand and Nygøard2015; Hitchen & Wells Reference Hitchen and Wells2016), where the heat flux depends linearly on the surface temperature and a dimensionless parameter
 $Bi$
, the Biot number, is characterised to represent the rate of thermal transport across the boundary. However, unlike those thermal convection studies, here the time-dependent equation (2.14) couples a global mass balance between two subsystems (i.e. the gas and the water) and is always uniform along the gas–water interface.
The dimensionless dissolution flux
 $F$
that couples (2.11) and (2.14) can be expressed as
 $$\begin{eqnarray}\displaystyle F(t)=\left.{\displaystyle \frac{\unicode[STIX]{x2202}\overline{C}}{\unicode[STIX]{x2202}z}}\right|_{z=0}={\displaystyle \frac{1}{L}}\int _{0}^{L}\left.{\displaystyle \frac{\unicode[STIX]{x2202}C}{\unicode[STIX]{x2202}z}}\right|_{z=0}\,\text{d}x. & & \displaystyle\end{eqnarray}$$
Comparing (2.6) and (2.15), the scale for the flux is
 ${\mathcal{F}}=DC_{s,0}^{\ast }/H_{w}$
, so that
 $F=F^{\ast }/{\mathcal{F}}$
. To measure the magnitude of the
 $\text{CO}_{2}$
dissolution, we define the volume-averaged concentration in the water
 $$\begin{eqnarray}\displaystyle \overline{\overline{C}}(t)={\displaystyle \frac{\displaystyle \int C\,\text{d}\boldsymbol{x}}{V_{w}}}, & & \displaystyle\end{eqnarray}$$
and mass conservation of the whole system requires that
 $$\begin{eqnarray}\displaystyle C_{s}+\unicode[STIX]{x1D6F1}\overline{\overline{C}}\equiv 1. & & \displaystyle\end{eqnarray}$$
While the governing equations have been scaled by the diffusion time
 ${\mathcal{T}}_{d}$
, other scales may be appropriate for the discussion of early and late phenomena. Therefore, we define the following diffusive, advective (or convective), and advective–diffusive dimensionless times:
 $$\begin{eqnarray}\displaystyle t=t_{d}=t^{\ast }/{\mathcal{T}}_{d},\quad t_{a}=t^{\ast }/{\mathcal{T}}_{a},\quad \text{and}\quad t_{ad}=t^{\ast }/{\mathcal{T}}_{ad}, & & \displaystyle\end{eqnarray}$$
respectively.
2.3 Numerical method
To solve these governing equations numerically, it is convenient to first introduce a stream function
 $\unicode[STIX]{x1D713}$
to describe the 2D fluid velocity, so that
 $\boldsymbol{u}=(u,w)=(\unicode[STIX]{x2202}_{z}\unicode[STIX]{x1D713},-\unicode[STIX]{x2202}_{x}\unicode[STIX]{x1D713})$
and the continuity equation (2.11c
) is satisfied. Then the dimensionless equations (2.11b
) and (2.11a
) can be written as
 $$\begin{eqnarray}\displaystyle & \displaystyle \unicode[STIX]{x1D6FB}^{2}\unicode[STIX]{x1D713}=\unicode[STIX]{x2202}_{x}C, & \displaystyle\end{eqnarray}$$
 $$\begin{eqnarray}\displaystyle & \displaystyle \unicode[STIX]{x2202}_{t}C+Ra_{0}(\unicode[STIX]{x2202}_{z}\unicode[STIX]{x1D713}\unicode[STIX]{x2202}_{x}C-\unicode[STIX]{x2202}_{x}\unicode[STIX]{x1D713}\unicode[STIX]{x2202}_{z}C)=\unicode[STIX]{x1D6FB}^{2}C, & \displaystyle\end{eqnarray}$$
where
 $\unicode[STIX]{x1D713}$
satisfies
 $L$
-periodic boundary conditions in
 $x$
and homogeneous Dirichlet boundary conditions in
 $z$
.
In our study, the equations (2.19) and (2.20) were solved numerically using a Fourier–Chebyshev-tau pseudospectral algorithm (Boyd Reference Boyd2000). For temporal discretisation, a third-order-accurate semi-implicit Runge–Kutta scheme (Nikitin Reference Nikitin2006) was utilised for computations of the first three steps, and then a four-step fourth-order-accurate semi-implicit Adams–Bashforth/backward-differentiation scheme (Peyret Reference Peyret2002) was used for computation of the remaining steps. At each step, we updated
 $C_{s}$
by solving (2.14a
) explicitly using a two-step Adams–Bashforth algorithm.
3 Diffusion solution and onset of convection
At sufficiently small Rayleigh number, the system is stable to perturbations and mass transfer is purely diffusive. When the Rayleigh number is above some critical value, the diffusive boundary layer becomes unstable and induces downward moving convective fingers which significantly increase the rate of
 $\text{CO}_{2}$
dissolution into the water. In § 3.1 we provide analytic approximations for the diffusive base state in the closed system and then study the onset of the convection using DNS in § 3.2.
3.1 Diffusion solution
In a stable system
 $\boldsymbol{u}=0$
and mass transport is purely diffusive, so that (2.11) reduces to the one-dimensional diffusion equation
 $$\begin{eqnarray}\displaystyle {\displaystyle \frac{\unicode[STIX]{x2202}C}{\unicode[STIX]{x2202}t}}={\displaystyle \frac{\unicode[STIX]{x2202}^{2}C}{\unicode[STIX]{x2202}z^{2}}}\quad \text{on}~z\in [-1,0], & & \displaystyle\end{eqnarray}$$
with (2.12) and (2.13) as initial and boundary conditions, respectively. A complete closed form solution is not available, but solutions in different limiting cases can be obtained by using a Laplace transform. For
 $\unicode[STIX]{x1D6F1}=0$
, the classic series solution for diffusion in a finite domain can be written as
 $$\begin{eqnarray}\displaystyle C(z,t)=\mathop{\sum }_{n=0}^{\infty }(-1)^{n}\left[2-\text{erf}\left({\displaystyle \frac{-z}{2\sqrt{t}}}+{\displaystyle \frac{n}{\sqrt{t}}}\right)-\text{erf}\left({\displaystyle \frac{z}{2\sqrt{t}}}+{\displaystyle \frac{n+1}{\sqrt{t}}}\right)\right], & & \displaystyle\end{eqnarray}$$
on
 $z\in [-1,0]$
(Crank Reference Crank1975). This solution reduces to simple error function solution for diffusion in a semi-infinite domain at early time,
 $t\ll 1$
. For
 $\unicode[STIX]{x1D6F1}>0$
, a closed form solution can only be found at early time when the domain is effectively semi-infinite. This solution is then given by
 $$\begin{eqnarray}\displaystyle C(z,t)=\text{e}^{\unicode[STIX]{x1D6F1}^{2}t-\unicode[STIX]{x1D6F1}z}\left[1+\text{erf}\left(-\unicode[STIX]{x1D6F1}\sqrt{t}+{\displaystyle \frac{z}{2\sqrt{t}}}\right)\right]\quad \text{on}~z\in (-\infty ,0], & & \displaystyle\end{eqnarray}$$
and reduces to the standard error function solution in the limit
 $\unicode[STIX]{x1D6F1}=0$
(Sheikha et al.
Reference Sheikha, Pooladi-Darvish and Mehrotra2005; Kim, Yoon & Choi Reference Kim, Yoon and Choi2006). Hereafter, (3.3) is referred to as the early-time solution. We note that these solutions are not self-similar in
 $z/\sqrt{t}$
, if
 $\unicode[STIX]{x1D6F1}>0$
.
At late time, the diffusive front interacts with the bottom boundary and the finiteness of the domain affects the solution. For
 $\unicode[STIX]{x1D6F1}>0$
, the full solution in the Laplace transform variable is given by
 $$\begin{eqnarray}\displaystyle {\hat{C}}(z,s)=\frac{\cosh (\sqrt{s}(z+1))}{s\cosh (\sqrt{s})+\unicode[STIX]{x1D6F1}\sqrt{s}\sinh (\sqrt{s})}\quad \text{on}~z\in [-1,0], & & \displaystyle\end{eqnarray}$$
but the inverse Laplace transform of this expression does not lead to a closed form expression. Instead, a series solutions can be obtained via Cauchy’s residue theorem (Duffy Reference Duffy2004). This requires the poles,
 $s_{k}$
, of (3.4), which are given implicitly by the roots of
 $$\begin{eqnarray}\displaystyle \tan (p)=-\frac{p}{\unicode[STIX]{x1D6F1}}, & & \displaystyle\end{eqnarray}$$
where
 $s=-p^{2}$
(Zhang, Hesse & Wang Reference Zhang, Hesse and Wang2017). From the definition of the inverse Laplace transform and Jordan’s lemma (Schiff Reference Schiff1999), the solution is then given by
 $$\begin{eqnarray}\displaystyle C(z,t)={\mathcal{L}}^{-1}\{{\hat{C}}(z,s)\}=\frac{1}{2\unicode[STIX]{x03C0}\text{i}}\lim _{\widetilde{T}\rightarrow \infty }\int _{r-\text{i}\widetilde{T}}^{r+\text{i}\widetilde{T}}{\hat{C}}(z,s)\text{e}^{st}\,\text{d}s=\mathop{\sum }_{n=0}^{\infty }a_{n}\text{e}^{-p_{n}^{2}t}, & & \displaystyle\end{eqnarray}$$
where the coefficients of the residues for the simple poles are
 $$\begin{eqnarray}\displaystyle a_{n}=\lim _{s\rightarrow s_{n}}(s-s_{n}){\hat{C}}(z,s)=\left\{\begin{array}{@{}ll@{}}\displaystyle {\displaystyle \frac{1}{1+\unicode[STIX]{x1D6F1}}} & n=0,\\ \displaystyle {\displaystyle \frac{2\unicode[STIX]{x1D6F1}\cos (p_{n}z)+2p_{n}\sin (p_{n}z)}{\unicode[STIX]{x1D6F1}^{2}+\unicode[STIX]{x1D6F1}+p_{n}^{2}}} & n\geqslant 1.\end{array}\right. & & \displaystyle\end{eqnarray}$$
At late times (3.6) is dominated by lowest-order terms and the equilibrium solution is given by the zeroth-order term
 $$\begin{eqnarray}\displaystyle \lim _{t\rightarrow \infty }C={\displaystyle \frac{1}{1+\unicode[STIX]{x1D6F1}}}. & & \displaystyle\end{eqnarray}$$
The equilibrium solution is constant and entirely determined by the dissolution capacity,
 $\unicode[STIX]{x1D6F1}$
. At equilibrium,
 $C=C_{s}=\overline{\overline{C}}$
, so that (3.8) is consistent with the equilibrium condition from overall mass balance (1.3) and mass conservation (2.17). The equilibrium concentration declines rapidly with increasing dissolution capacity, as a decreasing amount of gas dissolves into an increasing amount of water.
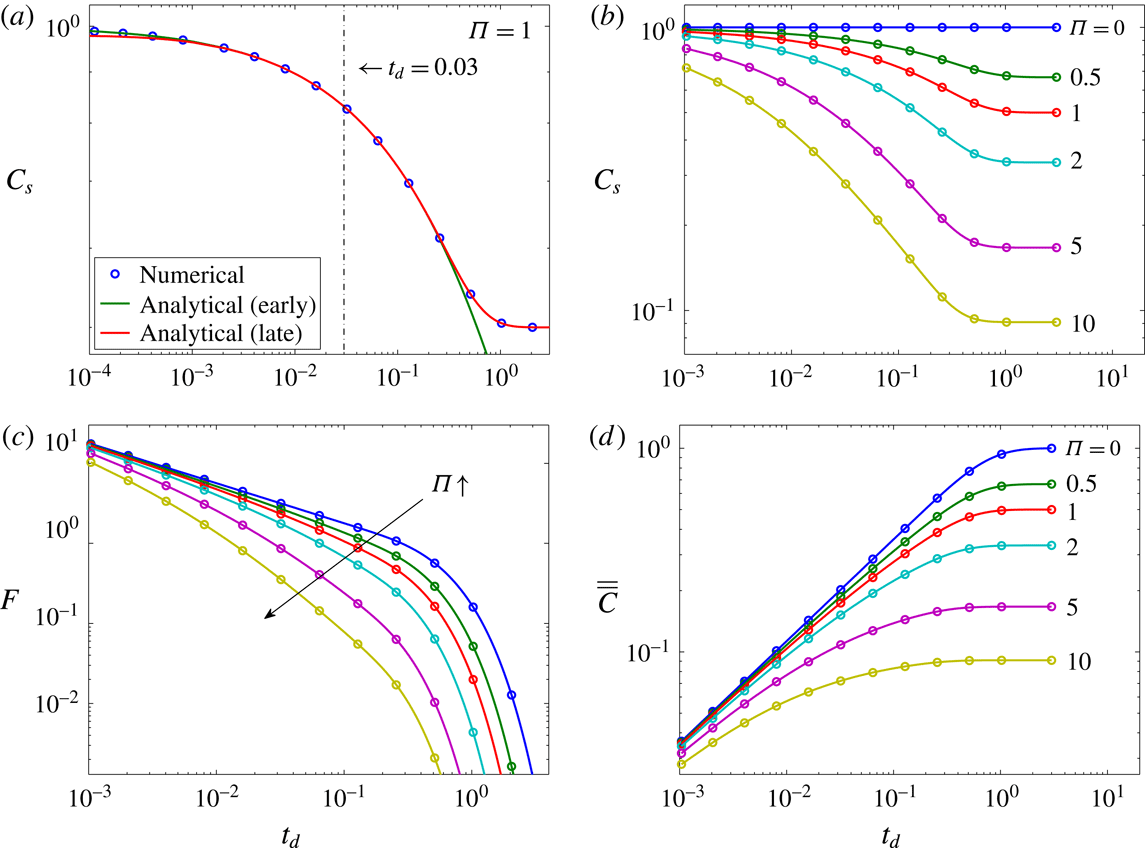
The low-order terms in (3.6) generally capture the late-time behaviour, but a large number of modes is needed to describe the solution at early time. We therefore truncate the sum in (3.6) to obtain a late-time approximation and combine it with the early-time solution, given by (3.3), to describe the full evolution. Figure 3(a) shows this composite solution for the concentration on the interface,
 $C_{s}(t)=C|_{z=0}$
, and a numerical solution using the algorithms described in § 2.3 matches this composite analytic solution well. For this comparison, the numerical solution was initialised with (3.3) evaluated at
 $t=4\times 10^{-5}$
to avoid oscillations arising from the discontinuity between the initial and the boundary conditions.
Comparisons between numerical and analytic diffusion solutions in the closed system. Circles, numerical solution (the spacing of symbols does not reflect the time steps used in computations); solid lines, analytic solution. In (a), the solutions (3.3) and (3.6) are valid, respectively, at early and late times; in (b–d) and for
 $\unicode[STIX]{x1D6F1}>0$
, the early-time solution is used as the composite analytic solution at
 $t_{d}\leqslant 0.03$
and the late-time solution is used at
 $t_{d}>0.03$
. Ten modes (i.e.
 $0\leqslant n\leqslant 9$
) are utilised to calculate the analytic solutions (3.2) and (3.6). However, our study indicates that for
 $t_{d}\geqslant 0.1$
, two modes (i.e.
 $n=0$
, 1) of the late-time solution (3.6) are enough to retain a 99 % accuracy of the quantities showing in (b–d).

The early-time solution gives insight into the effect that
 $\unicode[STIX]{x1D6F1}$
has on the diffusive mass transport in a closed system. The concentration on the interface and the flux across the interface are given by
 $$\begin{eqnarray}\displaystyle C_{s}(t) & = & \displaystyle C(t,0)=\text{e}^{\unicode[STIX]{x1D6F1}^{2}t}[1+\text{erf}(-\unicode[STIX]{x1D6F1}\sqrt{t})],\end{eqnarray}$$
 $$\begin{eqnarray}\displaystyle F(t,0) & = & \displaystyle -\unicode[STIX]{x1D6F1}\text{e}^{\unicode[STIX]{x1D6F1}^{2}t}[1+\text{erf}(-\unicode[STIX]{x1D6F1}\sqrt{t})]+{\displaystyle \frac{1}{\sqrt{\unicode[STIX]{x03C0}t}}},\end{eqnarray}$$
 $t\ll 1$
. In the limit of
 $\unicode[STIX]{x1D6F1}=0$
,
 $C_{s}$
becomes constant, while for
 $\unicode[STIX]{x1D6F1}>0$
,
 $C_{s}$
declines ever more rapidly with increasing
 $\unicode[STIX]{x1D6F1}$
, as shown in figure 3(b). For
 $\unicode[STIX]{x1D6F1}>0$
, the period for which
 $C_{s}>0.99$
, i.e. approximately constant, is
 $t<0.009/\unicode[STIX]{x1D6F1}$
, so that the decline in
 $C_{s}$
begins earlier with increasing
 $\unicode[STIX]{x1D6F1}$
. At
 $\unicode[STIX]{x1D6F1}=0$
,
 $F$
declines as
 $t^{-1/2}$
at
 $t\ll 1$
, but figure 3(c) shows that the flux in the closed system with
 $\unicode[STIX]{x1D6F1}>0$
does not follow a simple power law, since the rapid decline of
 $C_{s}$
at early time reduces the diffusive flux much faster.
The negative feedback introduced by the mass balance constraint in a closed system significantly slows down both the rate of dissolution and the total amount that can be dissolved. However, the time required to reach global equilibrium,
 $t\approx 1$
, remains approximately constant for different
 $\unicode[STIX]{x1D6F1}$
, as the reduction in flux is offset by the reduction in the equilibrium concentration (see figure 3
d).
3.2 Onset of convection
The diffusive boundary layer will grow with time as the
 $\text{CO}_{2}$
continuously dissolves into the water. When the diffusion layer becomes thick enough, the
 $\text{CO}_{2}$
-rich water, which is heavier than the underlying fresh water, can become unstable under the influence of gravity and sink in plumes of heavy
 $\text{CO}_{2}$
-rich fluid. This phenomenon, known as onset of convection, has been studied extensively by using linear stability analysis and DNS (Ennis-King et al.
Reference Ennis-King, Preston and Paterson2005; Hassanzadeh et al.
Reference Hassanzadeh, Pooladi-Darvish and Keith2006; Riaz et al.
Reference Riaz, Hesse, Tchelepi and Orr2006; Xu et al.
Reference Xu, Chen and Zhang2006; Kim et al.
Reference Kim, Song, Choi and Yeo2008; Javaheri, Abedi & Hassanzadeh Reference Javaheri, Abedi and Hassanzadeh2010; Pau et al.
Reference Pau, Bell, Pruess, Almgren, Lijewski and Zhang2010; Slim & Ramakrishnan Reference Slim and Ramakrishnan2010; Elenius & Johannsen Reference Elenius and Johannsen2012; Kim & Choi Reference Kim and Choi2012; Elenius, Nordbotten & Kalisch Reference Elenius, Nordbotten and Kalisch2014; Slim Reference Slim2014; Tilton & Riaz Reference Tilton and Riaz2014; Kim Reference Kim2015). A full hydrodynamic stability analysis for the closed system is beyond the scope of this contribution, but we provide DNS that illustrate the effect of
 $\unicode[STIX]{x1D6F1}$
on the onset of convection. Simulations are conducted for a discrete set of
 $Ra_{0}$
and
 $\unicode[STIX]{x1D6F1}$
in a 2D domain with aspect ratio
 $L=10^{5}/Ra_{0}$
.
The concentration field
 $C(\boldsymbol{x},t)$
can be decomposed into a transient diffusive base state
 $C_{d}(z,t)$
plus a fluctuation
 $\widetilde{C}(\boldsymbol{x},t)$
, namely,
 $$\begin{eqnarray}\displaystyle C(\boldsymbol{x},t)=C_{d}(z,t)+\widetilde{C}(\boldsymbol{x},t), & & \displaystyle\end{eqnarray}$$
where the diffusion solution
 $C_{d}$
is a composite analytic solution as in figure 3 and the fluctuation term can be expressed as
 $$\begin{eqnarray}\displaystyle \widetilde{C}(\boldsymbol{x},t)=\mathop{\sum }_{n=-N/2}^{N/2}{\hat{C}}_{n}(z,t)\text{e}^{\text{i}nkx}, & & \displaystyle\end{eqnarray}$$
where
 $k=2\unicode[STIX]{x03C0}/L$
is the fundamental wavenumber and
 $N$
is the horizontal truncation mode number. In our DNS, the initial condition is the early-time solution at
 $t=1/Ra_{0}^{2}$
, corresponding to
 $t_{ad}=1$
, with random perturbations within the top diffusion layer. For the purpose of this study we define the onset of convection as the earliest time when the norm of the amplitude
 ${\hat{C}}_{n}$
starts to grow.
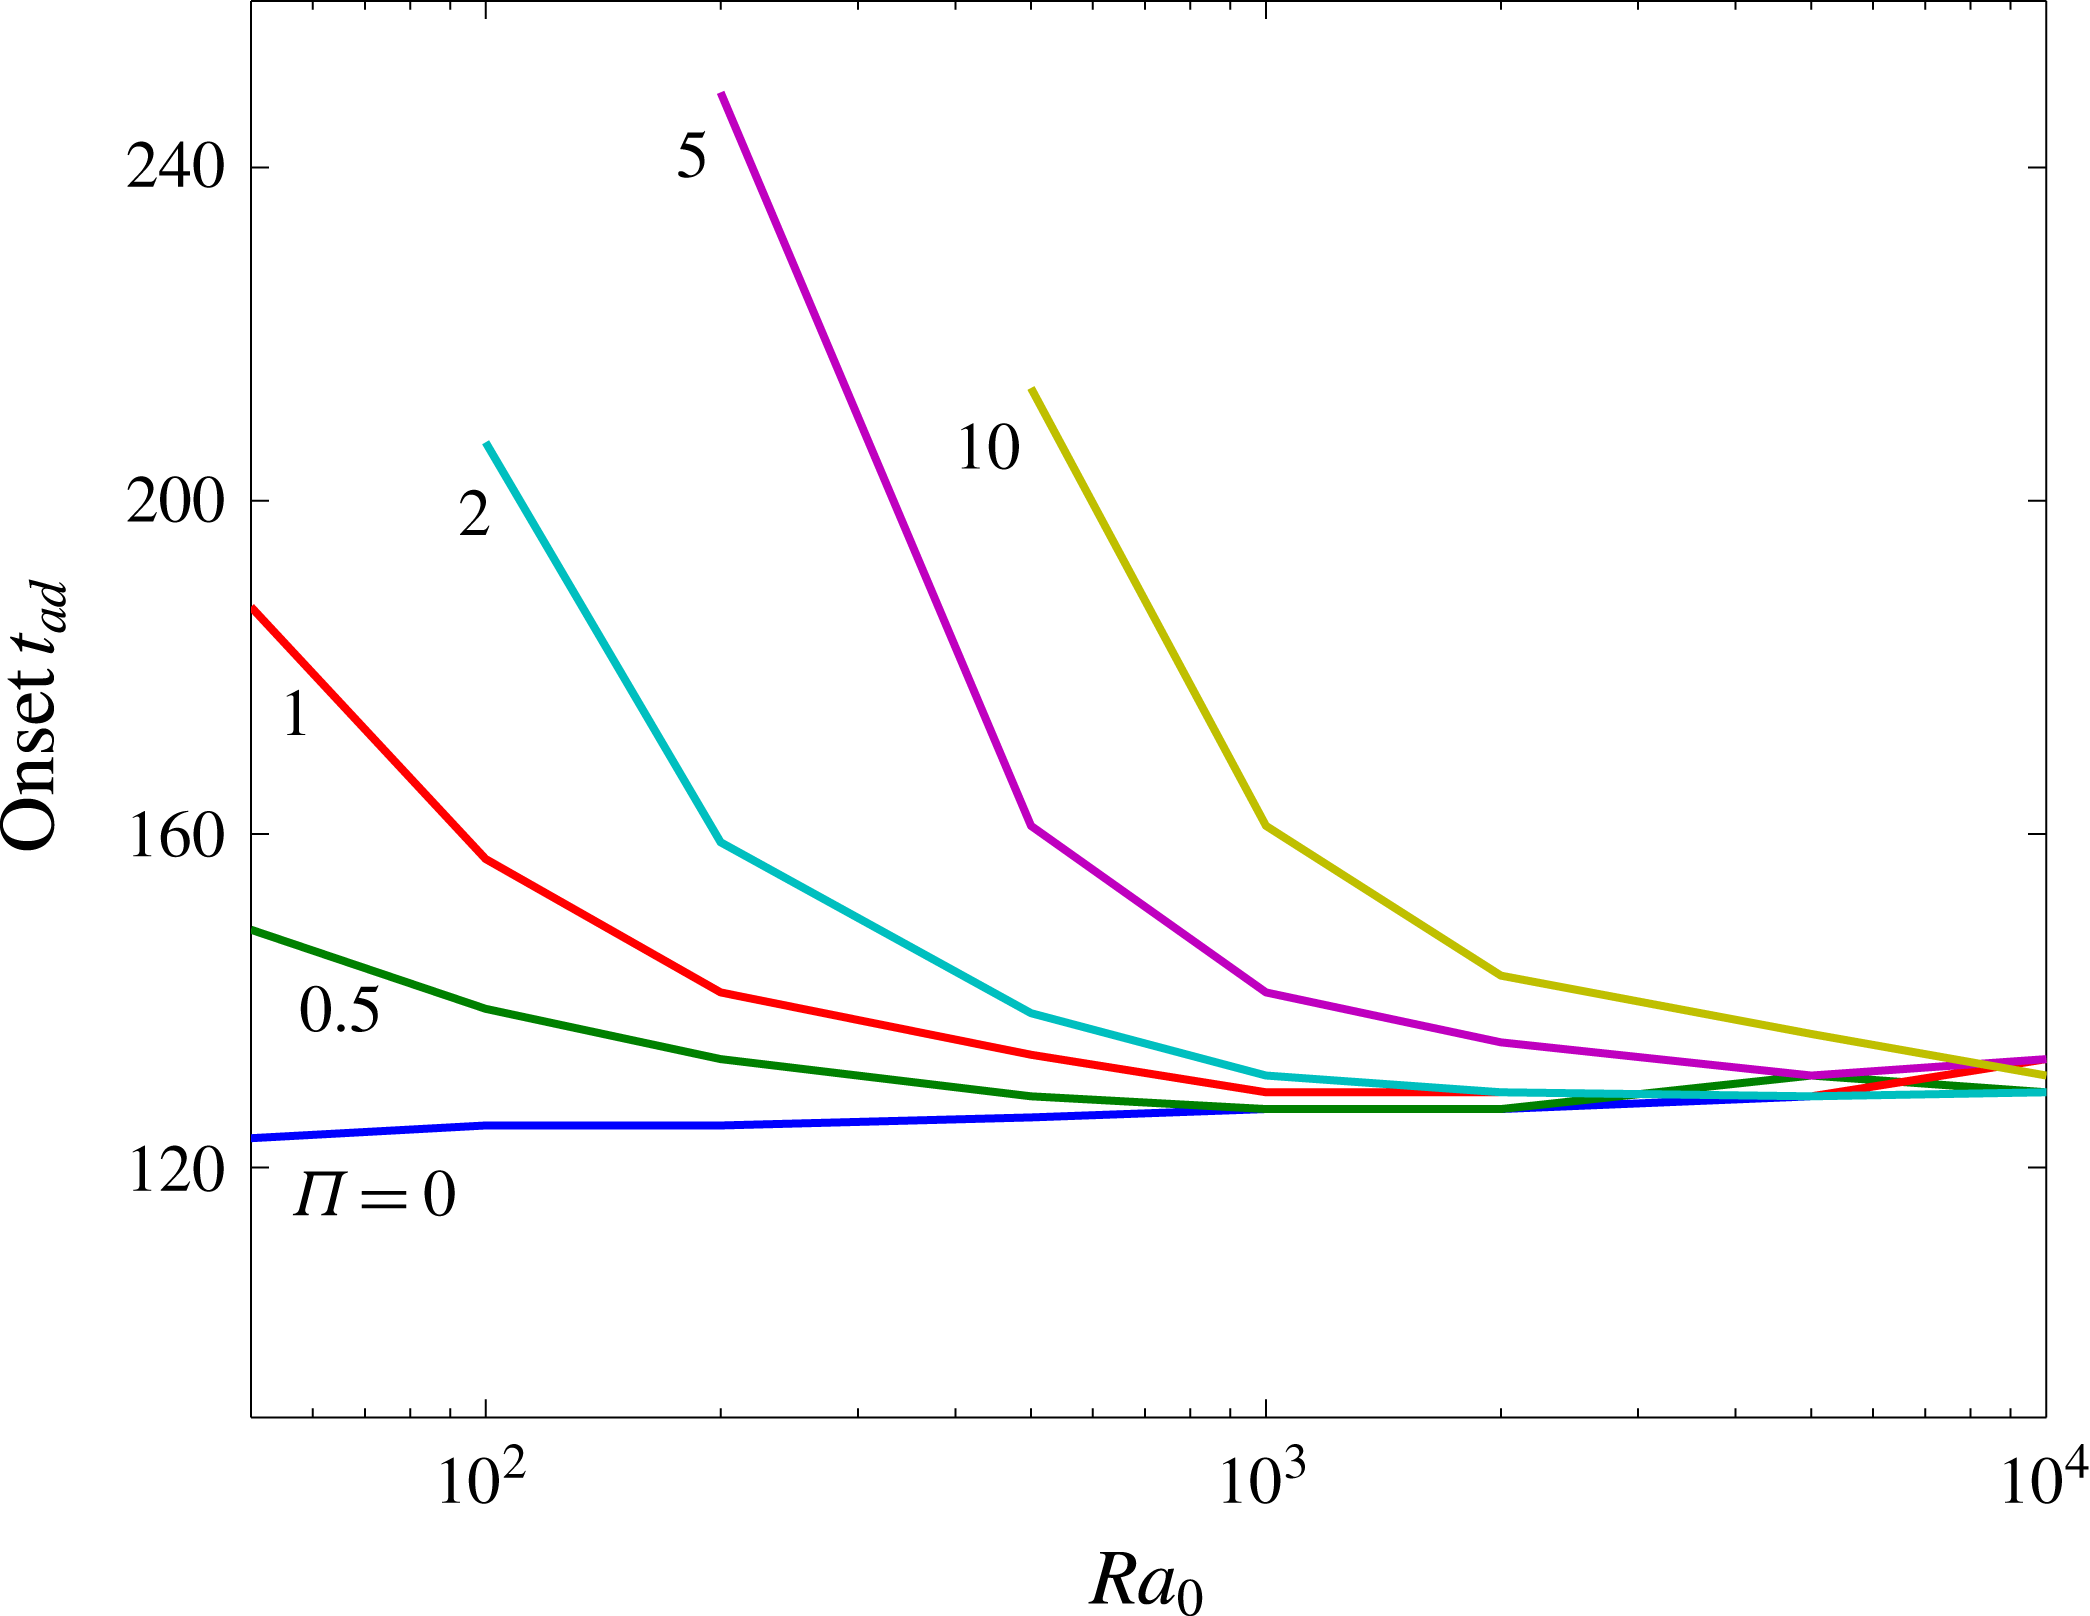
Variation of onset time as a function of Rayleigh number and dissolution capacity. For
 $\unicode[STIX]{x1D6F1}\geqslant 2$
, The diffusion solution becomes stable at sufficiently small
 $Ra_{0}$
where instability has set in for
 $\unicode[STIX]{x1D6F1}=0$
. In closed systems, the onset of convection is not affected by
 $\unicode[STIX]{x1D6F1}$
at large
 $Ra_{0}$
, but delayed at small
 $Ra_{0}$
with increasing
 $\unicode[STIX]{x1D6F1}$
due to the reduction of dissolution flux from the negative feedback of the pressure drop in gas.

For
 $\unicode[STIX]{x1D6F1}=0$
, the system of equations (2.11) becomes parameterless in the advective–diffusive scheme by rescaling
 $\boldsymbol{x}=\boldsymbol{x}_{ad}/Ra_{0}$
and
 $t=t_{ad}/Ra_{0}^{2}$
, so that
 $Ra_{0}$
becomes the height of the rescaled layer and the solution is universal before the fingertips reach the bottom boundary. As shown in figure 4, our DNS results indicate that the diffusion solution becomes unstable at
 $t_{ad}\approx 130$
for
 $\unicode[STIX]{x1D6F1}=0$
. This is consistent with previous work on linear stability analysis, which gives
 $t_{ad}\approx 146$
(Riaz et al.
Reference Riaz, Hesse, Tchelepi and Orr2006; Javaheri et al.
Reference Javaheri, Abedi and Hassanzadeh2010; Elenius et al.
Reference Elenius, Nordbotten and Kalisch2014). Nevertheless, for
 $\unicode[STIX]{x1D6F1}>0$
, the system is
 $Ra_{0}$
-dependent even in the advective–diffusive scaling, as
 $Ra_{0}$
appears in (2.14) (for advective–diffusive scalings, the time
 ${\mathcal{T}}_{ad}={\mathcal{T}}_{d}/Ra_{0}^{2}$
and the length
 ${\mathcal{H}}_{ad}=H_{w}/Ra_{0}$
). The onset time in a closed system therefore depends on both
 $Ra_{0}$
and
 $\unicode[STIX]{x1D6F1}$
(see figure 4). For small
 $Ra_{0}$
the diffusive boundary layer has to grow to a larger thickness before instability occurs. This allows the negative feedback in a closed system to reduce the diffusive flux and to increase the onset time with increasing
 $\unicode[STIX]{x1D6F1}$
(see figures 3
c and 4). At sufficiently large
 $Ra_{0}$
, however, the onset occurs before the negative feedback in a closed system has reduced the diffusive flux, so that the onset time is independent of
 $\unicode[STIX]{x1D6F1}$
.
4 Numerical simulations and mathematical models at large
 $Ra_{0}$

To study the dynamics and mass transport of solutal convection in the closed porous media system, DNS were performed at
 $Ra_{0}=20\,000$
for
 $\unicode[STIX]{x1D6F1}=0$
, 0.5, 1, 2, 5 and 10 in a 2D domain with the aspect ratio
 $L=10^{5}/Ra_{0}$
. In these computations, 8192 Fourier modes were utilised in the lateral discretisation, 385 Chebyshev modes were used in the vertical discretisation, and the time step is
 $\unicode[STIX]{x0394}t=10^{-8}$
. Moreover, the early-time solution for the diffusive base state, given by (3.3), at time
 $t=25/Ra_{0}^{2}$
(or
 $t_{ad}=25$
) was used as the initial condition for the concentration field, and a small random perturbation was added as a noise within the upper diffusive boundary layer to induce the convective instability. Although the results only from
 $Ra_{0}=20\,000$
were utilised for following analysis, it will be shown at the end of § 4.2 that our mathematical models are also applicable to other large Rayleigh numbers.
4.1 DNS results
Evolution of the dissolution flux
 $F$
and the interface concentration
 $C_{s}$
in time at
 $Ra_{0}=20\,000$
for different
 $\unicode[STIX]{x1D6F1}$
. Solid lines, DNS results; dashed lines in (a), purely diffusive flux
 $F\sim (\unicode[STIX]{x03C0}t)^{-1/2}$
for
 $\unicode[STIX]{x1D6F1}=0$
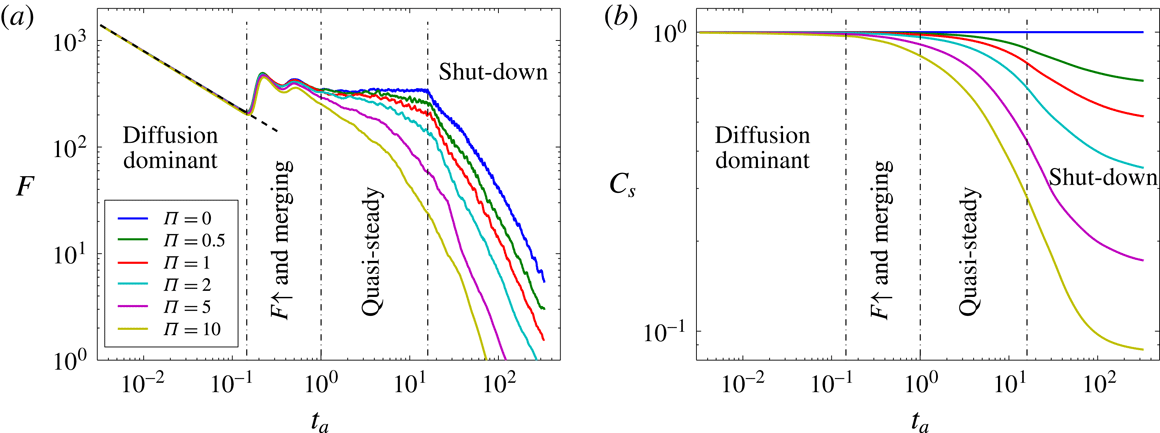
. In both (a) and (b), the four dynamical regimes are delineated using dot-dashed lines based on the flow characteristics at
 $\unicode[STIX]{x1D6F1}=0$
. Generally, these four regimes still exist for
 $\unicode[STIX]{x1D6F1}>0$
; however, for various
 $\unicode[STIX]{x1D6F1}$
the time of transitions may be different, e.g. as analysed below the onset of the shut-down regime will be delayed at a higher
 $\unicode[STIX]{x1D6F1}$
. At sufficiently large
 $Ra_{0}$
,
 $\unicode[STIX]{x1D6F1}$
starts to affect the convection in the flux-growth and plume-merging regime; and in the quasi-steady convective regime, the flux for
 $\unicode[STIX]{x1D6F1}>0$
does not remain constant due to the decay of the interface concentration
 $C_{s}$
.

Numerical results on
 $z=-0.01$
at
 $Ra_{0}=20\,000$
for different
 $\unicode[STIX]{x1D6F1}$
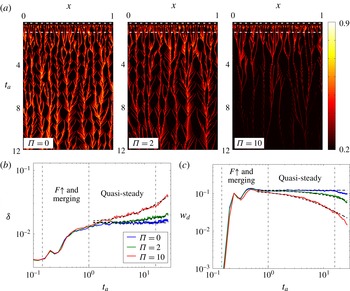
: evolution in time of (a) the concentration profile
 $C$
, (b) the horizontal-mean finger width
 $\unicode[STIX]{x1D6FF}$
, and (c) the magnitude of horizontal-mean downward velocity
 $w_{d}$
. In (a), only a small portion of
 $x$
is shown and the two (white) dot-dashed lines indicate the times of transition to the flux-growth and plume-merging regime and the quasi-steady convective regime, respectively, for
 $\unicode[STIX]{x1D6F1}=0$
. In (b), the finger width is measured using
 $\unicode[STIX]{x1D6FF}=\unicode[STIX]{x03C0}/[\overline{(\unicode[STIX]{x2202}C^{\prime }/\unicode[STIX]{x2202}x)^{2}}/\overline{C^{\prime 2}}]^{1/2}$
, where
 $C^{\prime }=(C-\overline{C})$
is the fluctuation of the concentration field (see more details in Slim Reference Slim2014). In (b) and (c), the dynamical regimes are delineated as in figure 5, and we can fit the functional of the mathematical model developed later in (4.5) for
 $C_{s}$
in the quasi-steady convective regime to the DNS data of
 $\unicode[STIX]{x1D6FF}$
and
 $w_{d}$
, i.e.
 $\unicode[STIX]{x1D6FF}=0.015(0.006\unicode[STIX]{x1D6F1}t_{a}+1)$
(dashed) and
 $w_{d}=1/[8.1(0.0168\unicode[STIX]{x1D6F1}t_{a}+1)]$
(dashed). Before transition to the quasi-steady convective regime, the dynamics are generally not affected by
 $\unicode[STIX]{x1D6F1}$
. However, in the quasi-steady convective regime, the increase of
 $\unicode[STIX]{x1D6F1}$
enhances the reduction of the concentration field near the upper wall, resulting in a less vigorous convection in the boundary layer: the plumes become wider, the descending velocity is decreased, and fewer ribs (which represent the protoplumes) exist in the ‘fish-bone’ pattern and merge with the primary finger roots.

Convection at
 $\unicode[STIX]{x1D6F1}=0$
exhibits a succession of different flow regimes defined by the behaviour of the solute flux (Riaz et al.
Reference Riaz, Hesse, Tchelepi and Orr2006; Slim Reference Slim2014; Tilton & Riaz Reference Tilton and Riaz2014). In this study, we distinguish the following regimes defined in figure 5(a): an initial ‘diffusion-dominant’ regime, followed by the ‘flux-growth and plume-merging’ and ‘quasi-steady’ convective regimes, and the final ‘shut-down’ of convection. Below we consider the effect of dissolution capacity,
 $\unicode[STIX]{x1D6F1}$
, on these regimes in turn and show that the effect increases with time.
The ‘diffusion-dominant’ regime is not significantly affected by
 $\unicode[STIX]{x1D6F1}$
, due to the early onset of convection at high
 $Ra_{0}$
. This prevents the reduction of
 $C_{s}$
at the interface (see figure 5
b), so that the flux exhibits a diffusive decay,
 $F\sim (\unicode[STIX]{x03C0}t)^{-1/2}$
. This behaviour continues up to
 $t_{a}\approx 3000/Ra_{0}$
(i.e.
 $t_{ad}\approx 3000$
) even after perturbations have begun to grow linearly, since the nascent fingers are still encompassed within the relatively thick diffusive boundary layer.
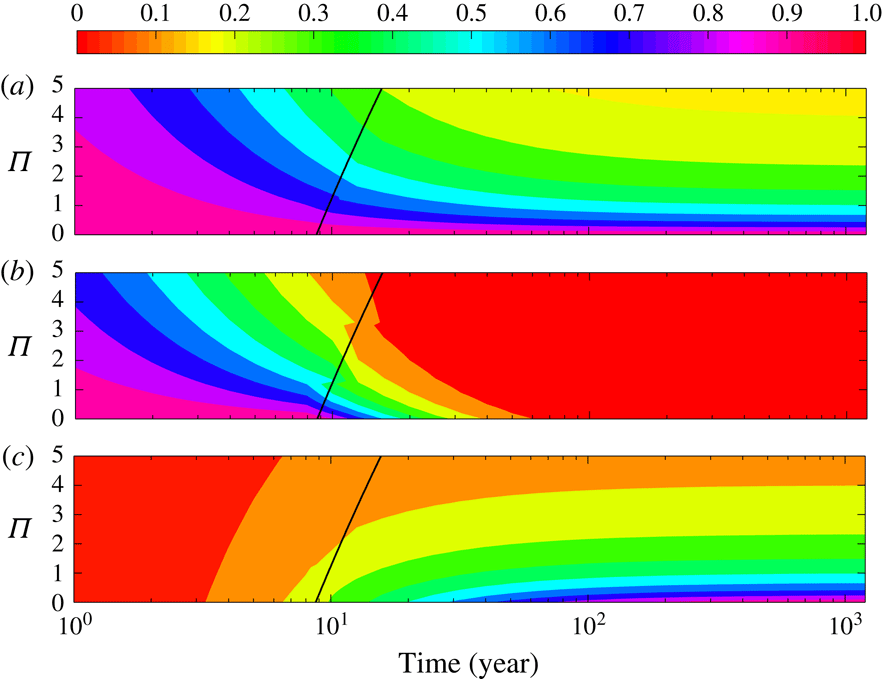
During the ‘flux-growth and plume-merging’ regime the boundary layer scallops and the penetration of unsaturated fluid to the interface increases the flux to a maximum. The evolution of the finger-root concentration in figure 6(a) shows that fingers start to travel laterally, which leads to merging of neighbours and a coarsening of the pattern. Due to the short time scales, the basic flow characteristics, e.g. the horizontal-mean finger width
 $\unicode[STIX]{x1D6FF}$
and magnitude of horizontal-mean downward velocity,
 $w_{d}$
, are still not affected by
 $\unicode[STIX]{x1D6F1}$
(see figure 6
b,c). However, the decrease of the interface concentration
 $C_{s}$
at large
 $\unicode[STIX]{x1D6F1}$
becomes more evident and begins to reduce the solute flux (see figure 5).
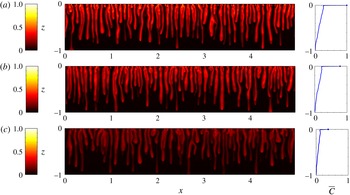
Snapshots of the concentration field
 $C$
and the corresponding horizontal-mean concentration profile
 $\overline{C}$
from DNS at
 $Ra_{0}=20\,000$
when the downwelling fingers first reach the bottom wall: (a)
 $\unicode[STIX]{x1D6F1}=0$
,
 $t_{a}=7.2$
; (b)
 $\unicode[STIX]{x1D6F1}=2$
,
 $t_{a}=8$
; (c)
 $\unicode[STIX]{x1D6F1}=10$
,
 $t_{a}=10$
. The dot at the top of
 $\overline{C}$
denotes the concentration at the upper boundary. The increase of
 $\unicode[STIX]{x1D6F1}$
reduces the plume-root concentration and decreases the plume descending speed.

After the convective pattern has coarsened, the flow transitions to a ‘quasi-steady’ convective regime. At these longer time scales (
 $t_{a}\approx 1$
),
 $C_{s}$
begins to drop rapidly (see figure 5
b) and the difference between convection for
 $\unicode[STIX]{x1D6F1}=0$
and
 $\unicode[STIX]{x1D6F1}>0$
is most pronounced. The dissolution flux for
 $\unicode[STIX]{x1D6F1}=0$
is constant, while the flux for
 $\unicode[STIX]{x1D6F1}>0$
decays ever more rapidly with increasing
 $\unicode[STIX]{x1D6F1}$
(see figure 5
a). Therefore, despite the name of the convective regime, convection for
 $\unicode[STIX]{x1D6F1}>0$
is never actually quasi-steady. Independent of
 $\unicode[STIX]{x1D6F1}$
, small protoplumes are continuously generated at the top boundary, swept sideways, and assimilated into the large fingers that penetrate to greater depth. This generates a typical fish-bone pattern in the evolution of the finger-root concentration (Hewitt et al.
Reference Hewitt, Neufeld and Lister2012, also see figure 6
a) and a columnar large-scale flow pattern in the interior (see figure 7). For
 $\unicode[STIX]{x1D6F1}>0$
, the drop in
 $C_{s}$
with time reduces the finger-root concentration and the generation of protoplumes from the upper wall. This leads to a characteristic ‘fading fish-bone pattern’ for convection in closed systems. As the driving force for convection declines, the wavelength of the large-scale flow pattern coarsens and the downwelling plumes slow down (see figure 6
b,c).
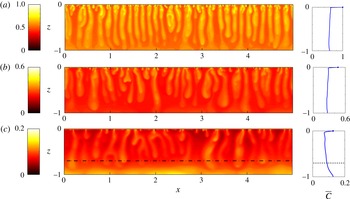
Snapshots of the concentration field
 $C$
and the corresponding horizontal-mean concentration profile
 $\overline{C}$
from DNS at
 $Ra_{0}=20\,000$
and
 $t_{a}=50$
: (a)
 $\unicode[STIX]{x1D6F1}=0$
; (b)
 $\unicode[STIX]{x1D6F1}=2$
; (c)
 $\unicode[STIX]{x1D6F1}=10$
. The dot at the top of
 $\overline{C}$
denotes the concentration at the upper boundary. When convection is shut down, the horizontal-mean concentration profile outside the top diffusive boundary layer becomes nearly independent of
 $z$
. However, at large
 $\unicode[STIX]{x1D6F1}$
, e.g.
 $\unicode[STIX]{x1D6F1}=10$
shown in (c), due to the rapid decline of
 $C_{s}$
at the interface, this system exhibits a three-layer dynamics: above the dot-dashed line is the regular, two-layer shut-down convection as in (a,b); beneath the dot-dashed line, the fluid is stably stratified and the flow is mainly by diffusion.

After the fingers reach the lower boundary, the
 $\text{CO}_{2}$
-rich fluid starts to move upwards with the returning flow. Once this dense fluid reaches the upper boundary, the driving force for convection is decreased, the flux declines rapidly, and eventually the convection is shut down (see figure 8). Previous work on convective shut-down, for
 $\unicode[STIX]{x1D6F1}=0$
, shows that the horizontal-mean concentration is well-mixed and almost constant with depth, outside the diffusive boundary layer at the top (Hewitt et al.
Reference Hewitt, Neufeld and Lister2013, Slim et al.
Reference Slim, Bandi, Miller and Mahadevan2013, Slim Reference Slim2014, also see figure 8
a), namely,
 $$\begin{eqnarray}\displaystyle \overline{C}\approx \overline{\overline{C}}(t). & & \displaystyle\end{eqnarray}$$
Based on this observation, theoretical box models were developed to predict the variation of the dissolution flux in time. In this study, our simulation results indicate that (4.1) is still valid for
 $0<\unicode[STIX]{x1D6F1}\leqslant 5$
. As shown in figure 8, however, for
 $\unicode[STIX]{x1D6F1}\geqslant 10$
the mean concentration profile exhibits a three-layer structure due to the rapid decrease of
 $C_{s}$
: near the upper wall is the thin diffusive boundary layer; in the core
 $\overline{C}$
is nearly independent of
 $z$
; and near the bottom wall the fluid is stably stratified. In the following section, we will extend these theoretical box models to generic closed systems (
 $0<\unicode[STIX]{x1D6F1}<10$
) that do not form such a stable stratification at the base.
Mathematical models for the quasi-steady convective regime in closed systems at
 $Ra_{0}=20\,000$
: (a) evolution of the rescaled dissolution flux
 $F/C_{s}^{2}$
in time; (b–d) comparisons of the interface concentration
 $C_{s}$
, the dissolution flux
 $F$
and the volume-averaged concentration
 $\overline{\overline{C}}$
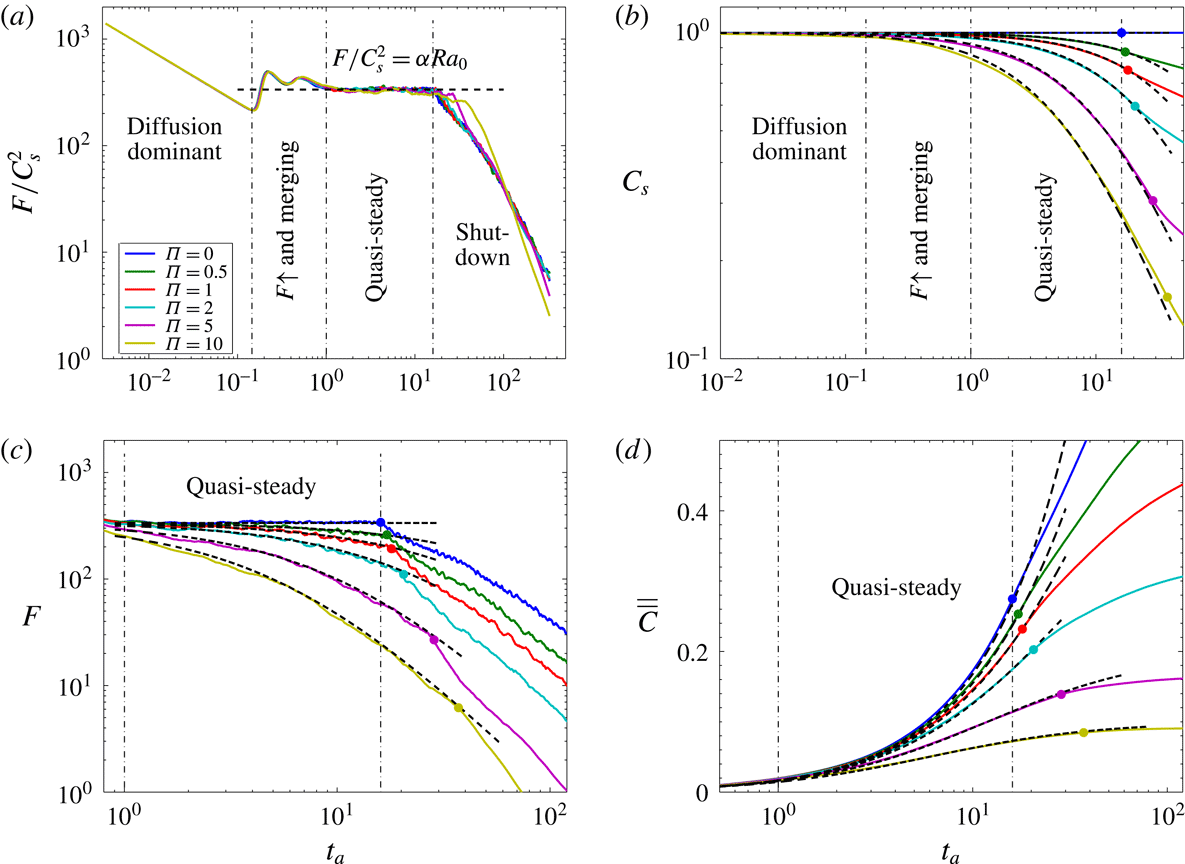
between the DNS results (solid lines) and the mathematical models (dashed lines). The dynamical regimes are delineated as in figure 5. In the quasi-steady convective regime, the rescaled dissolution flux keeps constant in time and is independent of
 $\unicode[STIX]{x1D6F1}$
, i.e.
 $F/C_{s}^{2}=\unicode[STIX]{x1D6FC}Ra_{0}$
, where
 $\unicode[STIX]{x1D6FC}=0.0168$
. In (b–d), the dots mark the time of transition to the shut-down regime from DNS for various
 $\unicode[STIX]{x1D6F1}$
. Obviously, this transition is delayed with increasing
 $\unicode[STIX]{x1D6F1}$
.

4.2 Simple mathematical models
Here we aim to develop a zero-dimensional representations for the convecting system that capture the evolution of the averaged system quantities, e.g.
 $C_{s}(t)$
,
 $F(t)$
and
 $\overline{\overline{C}}(t)$
, in different regimes. This is possible for
 $\unicode[STIX]{x1D6F1}=0$
, since the quasi-steady flux in high-
 $Ra_{0}$
convection can be expressed as a power law of the form
 $$\begin{eqnarray}\displaystyle F=\unicode[STIX]{x1D6FC}\,{Ra_{0}}^{\unicode[STIX]{x1D6FD}}\quad \text{for}~Ra_{0}>Ra^{\ast }, & & \displaystyle\end{eqnarray}$$
where
 $Ra^{\ast }\approx 2000$
gives the onset of the power-law scaling for the one-sided penetrative convection considered here (Slim Reference Slim2014). Our simulations give the following coefficients,
 $\unicode[STIX]{x1D6FC}=0.0168$
and
 $\unicode[STIX]{x1D6FD}=1$
. Similar values for
 $\unicode[STIX]{x1D6FC}$
and
 $\unicode[STIX]{x1D6FD}$
have been found in previous investigations of convection in porous media (Doering & Constantin Reference Doering and Constantin1998; Otero et al.
Reference Otero, Dontcheva, Johnston, Worthing, Kurganov, Petrova and Doering2004; Pau et al.
Reference Pau, Bell, Pruess, Almgren, Lijewski and Zhang2010; Elenius & Johannsen Reference Elenius and Johannsen2012; Hewitt et al.
Reference Hewitt, Neufeld and Lister2012; Hidalgo et al.
Reference Hidalgo, Fe, Cueto-Felgueroso and Juanes2012; Wen et al.
Reference Wen, Dianati, Lunasin, Chini and Doering2012, Reference Wen, Chini, Dianati and Doering2013; Hassanzadeh, Chini & Doering Reference Hassanzadeh, Chini and Doering2014; Slim Reference Slim2014; Wen, Corson & Chini Reference Wen, Corson and Chini2015; Wen & Chini Reference Wen and Chini2018), although some authors have argued for
 $\unicode[STIX]{x1D6FD}<1$
(Neufeld et al.
Reference Neufeld, Hesse, Riaz, Hallworth, Tchelepi and Huppert2010; Backhaus, Turitsyn & Ecke Reference Backhaus, Turitsyn and Ecke2011).
Section 4.1, however, shows that no such power-law scaling exists for
 $\unicode[STIX]{x1D6F1}>0$
, as the flux in the quasi-static regime is not constant (see figure 5
a). Nevertheless, from (2.11a
) the downward flux beneath the upper diffusive boundary layer at high
 $Ra_{0}$
is largely advective and given by
 $$\begin{eqnarray}\displaystyle F\approx -Ra_{0}\,\overline{wC}\approx Ra_{0}w_{d}\overline{C}\sim Ra_{0}\,\overline{C}^{2}, & & \displaystyle\end{eqnarray}$$
since the magnitude of the horizontal-mean downward velocity
 $w_{d}\sim C$
, as shown by (2.11b
). At
 $\unicode[STIX]{x1D6F1}=0$
, the interface concentration,
 $C_{s}$
, is constant and during the quasi-steady regime,
 $\overline{wC}=-\unicode[STIX]{x1D6FC}$
from (4.2) and (4.3). Although
 $F$
and
 $C_{s}$
vary with time in a closed system, equation (4.3) suggests that
 $F/C_{s}^{2}\sim Ra_{0}$
in the quasi-static regime. Figure 9(a) shows that indeed
 $$\begin{eqnarray}\displaystyle {\displaystyle \frac{F}{C_{s}^{2}}}=F|_{\unicode[STIX]{x1D6F1}=0}=\unicode[STIX]{x1D6FC}\,Ra_{0}, & & \displaystyle\end{eqnarray}$$
for different
 $\unicode[STIX]{x1D6F1}$
, which allows the extension of previous box models to generic closed systems. Combining (2.14), (2.15) and (4.4) yields the mathematical models for
 $F$
and
 $C_{s}$
in the quasi-steady convective regime:
 $$\begin{eqnarray}\displaystyle C_{s}(t_{a})={\displaystyle \frac{1}{\unicode[STIX]{x1D6FC}\unicode[STIX]{x1D6F1}t_{a}+1}}\quad \text{and}\quad F(t_{a})={\displaystyle \frac{\unicode[STIX]{x1D6FC}Ra_{0}}{(\unicode[STIX]{x1D6FC}\unicode[STIX]{x1D6F1}t_{a}+1)^{2}}}. & & \displaystyle\end{eqnarray}$$
Moreover, from (2.17) the total amount dissolved is given by
 $$\begin{eqnarray}\displaystyle \overline{\overline{C}}(t_{a})={\displaystyle \frac{\unicode[STIX]{x1D6FC}t_{a}}{\unicode[STIX]{x1D6FC}\unicode[STIX]{x1D6F1}t_{a}+1}}. & & \displaystyle\end{eqnarray}$$
As shown in figure 9(b–d), comparisons of the mathematical models in (4.5) and (4.6) and the DNS results show good agreement in the quasi-steady convective regime, for
 $\unicode[STIX]{x1D6F1}\leqslant 10$
. In addition, the assumption that
 $w_{d}\sim C$
can be confirmed by fitting the data in figure 6(c) with an expression of the form (4.5a
), to show that
 $w_{d}=C_{s}/8.1$
. Similarly, it can be shown that
 $\unicode[STIX]{x1D6FF}\sim 1/C_{s}$
in figure 6(b). It should be noted that these are quantities measured near the interface and appropriate prefactors vary with distance from the interface.
For
 $\unicode[STIX]{x1D6F1}=0$
, the fingertip sinks with a nearly constant speed in the quasi-steady convective regime (Riaz et al.
Reference Riaz, Hesse, Tchelepi and Orr2006; Hewitt et al.
Reference Hewitt, Neufeld and Lister2013; Slim Reference Slim2014). However, for
 $\unicode[STIX]{x1D6F1}>0$
, the downward propagation velocity,
 $w_{d}$
, slows down as the interface concentration,
 $C_{s}$
, declines. This delays the transitions from the quasi-steady to the shut-down regime, as shown in figures 6(c) and 9(c). However, since
 $w_{d}\sim C_{s}$
and the decline of
 $C_{s}(t)$
is determined by (4.5a
), the fingertip position of the descending plumes is given by
 $$\begin{eqnarray}\displaystyle z_{tip}(t_{a})=-\int _{0}^{t_{a}}w_{d}\,\text{d}\tilde{t}_{c}=-{\displaystyle \frac{\ln (1+\unicode[STIX]{x1D6FC}\unicode[STIX]{x1D6F1}t_{a})}{7.2\,\unicode[STIX]{x1D6FC}\unicode[STIX]{x1D6F1}}}. & & \displaystyle\end{eqnarray}$$
Here
 $w_{d}=C_{s}/7.2$
, as in our simulations the fingers reach the lower boundary at
 $t_{a}\approx 7.2$
for
 $\unicode[STIX]{x1D6F1}=0$
. According to the model, in closed systems the fingers first hit the base of the domain at
 $$\begin{eqnarray}\displaystyle t_{b}={\displaystyle \frac{\text{e}^{7.2\,\unicode[STIX]{x1D6FC}\unicode[STIX]{x1D6F1}}-1}{\unicode[STIX]{x1D6FC}\unicode[STIX]{x1D6F1}}}, & & \displaystyle\end{eqnarray}$$
when
 $z_{tip}(t_{b})=-1$
. After reaching the base of the domain, dense fluid is carried upward by the return flow and, once the saturated fluid reaches the interface, convection shuts down rapidly. Due to the symmetry of the downwelling and upwelling regions (see figure 7), mass balance requires that the magnitude of horizontal-mean upwelling velocity is equal to the magnitude of horizontal-mean downwelling velocity at any time,
 $w_{u}\approx w_{d}$
. Therefore, one might expect the time required for the transition to shut-down,
 $t_{s}$
, to be given by solving
 $z_{tip}(t_{b})=-2$
. However, even for
 $\unicode[STIX]{x1D6F1}=0$
this simple estimate is not accurate and we prefer the expression
 $$\begin{eqnarray}\displaystyle t_{s}={\displaystyle \frac{\text{e}^{16\,\unicode[STIX]{x1D6FC}_{u}\,\unicode[STIX]{x1D6F1}}-1}{\unicode[STIX]{x1D6FC}_{u}\,\unicode[STIX]{x1D6F1}}}, & & \displaystyle\end{eqnarray}$$
where
 $w_{d}=C_{s}/8$
has been used and
 $\unicode[STIX]{x1D6FC}_{u}=0.8\,\unicode[STIX]{x1D6FC}$
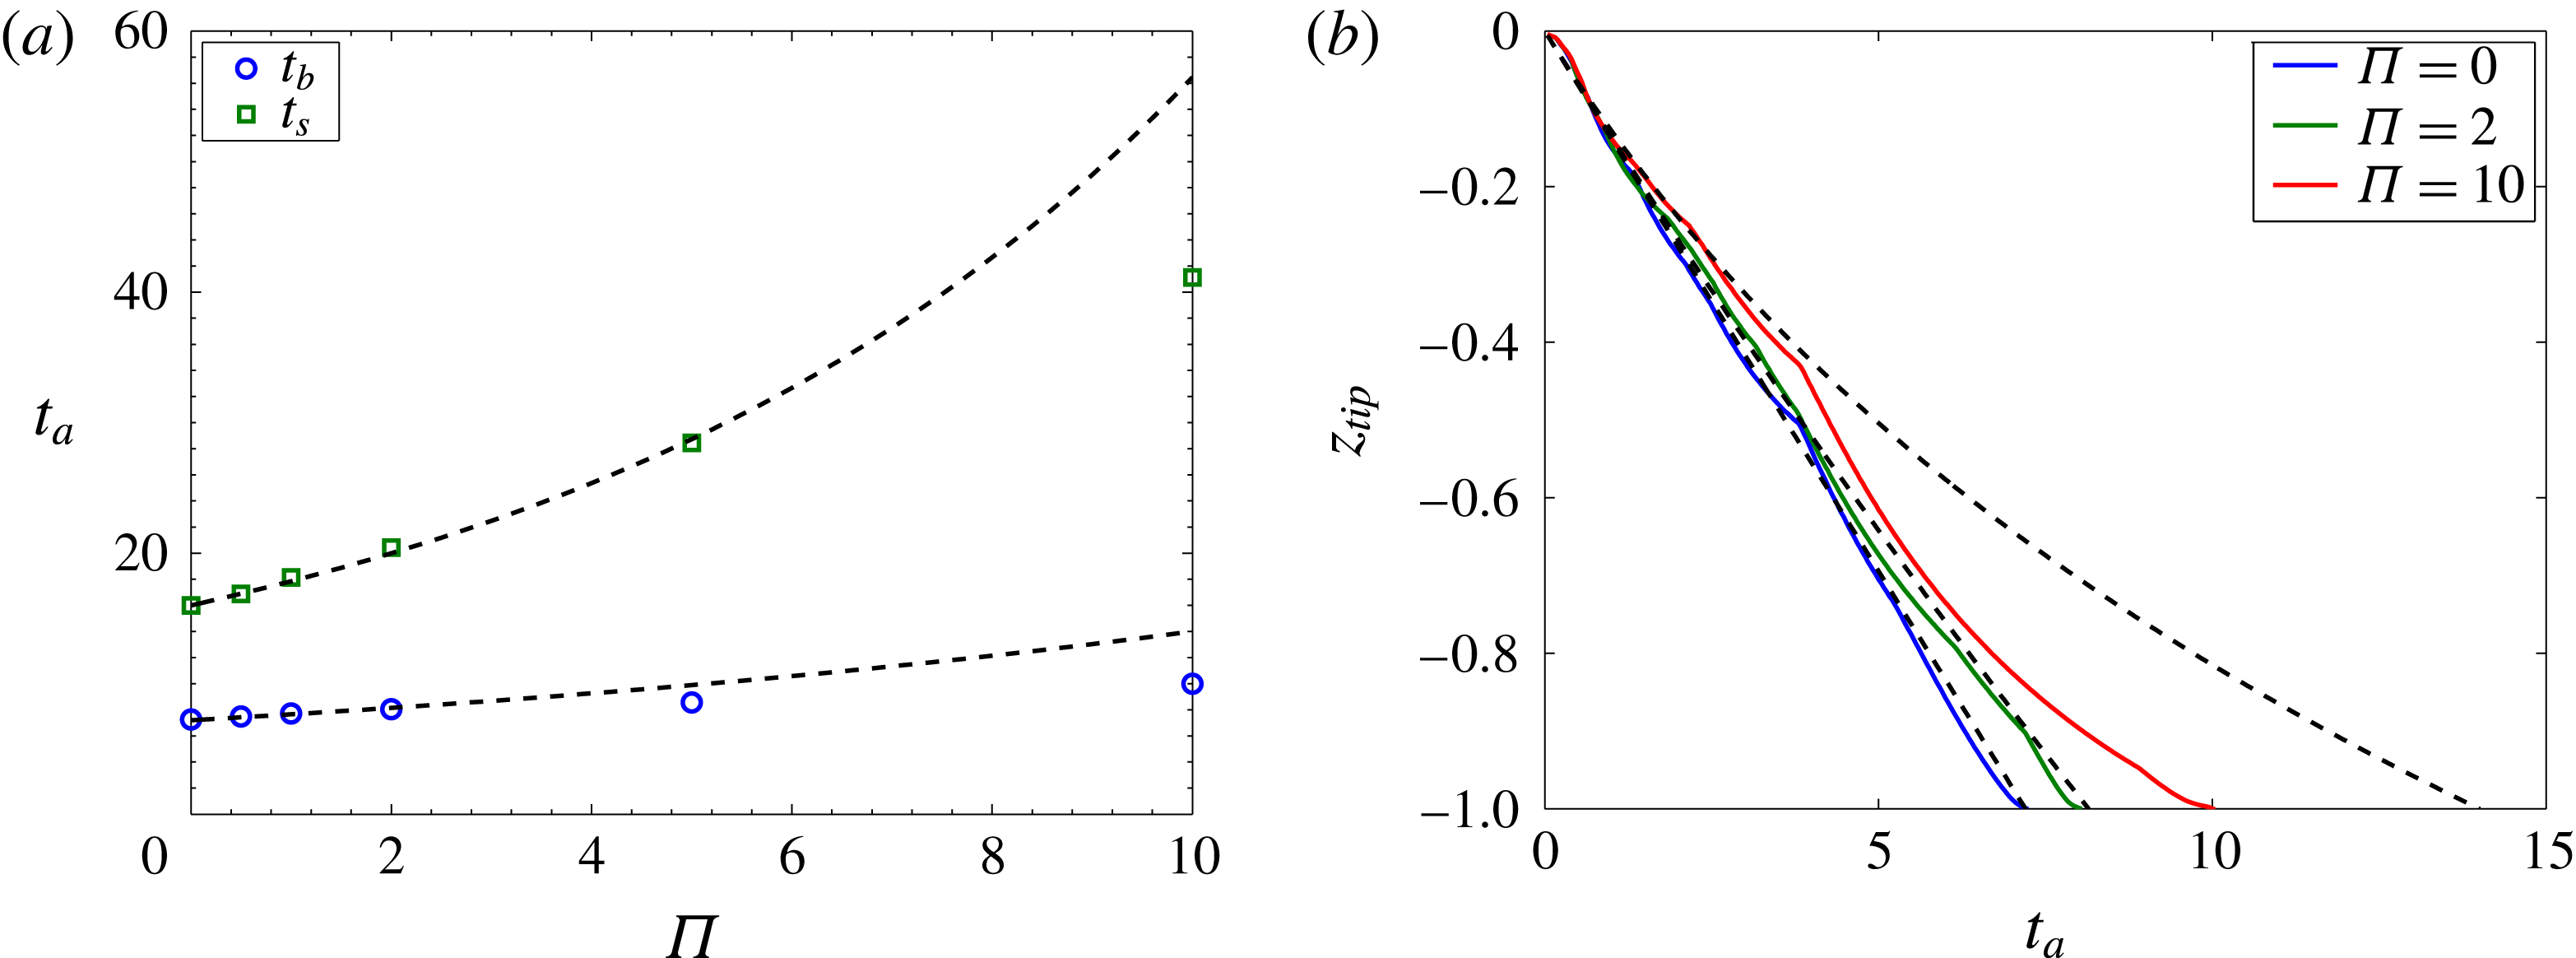
. These corrections account for delays due to accumulation of dense fluid at the base and for an apparent reduction of the efficiency of the return flux relative to (4.2) and (4.4). As shown in figure 10, the estimates for the time scales given by (4.8) and (4.9) agree very well with the DNS results, as long as
 $\unicode[STIX]{x1D6F1}\leqslant 5$
. At large
 $\unicode[STIX]{x1D6F1}$
, e.g.
 $\unicode[STIX]{x1D6F1}=10$
, however, the theoretical predictions of
 $t_{b}$
and
 $t_{s}$
underestimate the time scales determined from the simulations. This is due to the formation of a stable density stratification at the base of the domain, shown in figure 8(c).
Measures of finger motions at
 $Ra_{0}=20\,000$
for different
 $\unicode[STIX]{x1D6F1}$
: (a) variations of
 $t_{b}$
and
 $t_{s}$
with
 $\unicode[STIX]{x1D6F1}$
; (b) evolution of the fingertip location
 $z_{tip}$
in time. Symbols and solid lines, DNS results; dashed lines, mathematical models. In (b), the fingertip location is defined as the minima of the
 $C=0.05$
contour.

For simulations with
 $\unicode[STIX]{x1D6F1}\leqslant 5$
, the horizontal-mean concentration
 $\overline{C}$
exhibits a vertically well-mixed structure in the shut-down regime (see figure 8). Therefore, from the definitions in (2.15) and (2.16) and the approximation in (4.1), the dissolution flux of
 $\text{CO}_{2}$
can be rewritten as
 $$\begin{eqnarray}\displaystyle F={\displaystyle \frac{\text{d}}{\text{d}t}}\int _{-1}^{0}\overline{C}\,\text{d}z={\displaystyle \frac{\text{d}\overline{\overline{C}}}{\text{d}t}}. & & \displaystyle\end{eqnarray}$$
As in Hewitt et al. (Reference Hewitt, Neufeld and Lister2013), we define a time-dependent Nusselt number by scaling the flux
 $F(t)$
up to a unit concentration difference:
 $$\begin{eqnarray}\displaystyle Nu(t)={\displaystyle \frac{F}{C_{s}-\overline{\overline{C}}}}, & & \displaystyle\end{eqnarray}$$
where
 $Nu$
varies as a function of current Rayleigh number, i.e.
 $Nu(t)={\mathcal{N}}(Ra(t))$
. Note that for
 $\unicode[STIX]{x1D6F1}>0$
,
 $C_{s}$
also varies as a function of time. Analogous to high-
 $Ra$
Rayleigh–Bénard convection in porous media, where the Nusselt number
 $Nu_{RB}$
linearly depends on a relative Rayleigh number, the Nusselt number
 $Nu(t)$
in the solutal convection problem can be expressed as
 $$\begin{eqnarray}\displaystyle Nu(Ra(t))=Nu_{RB}(Ra_{e})=\unicode[STIX]{x1D6FE}Ra_{e}, & & \displaystyle\end{eqnarray}$$
where the effective Rayleigh number
 $$\begin{eqnarray}\displaystyle Ra_{e}=\unicode[STIX]{x1D712}(C_{s}-\overline{\overline{C}})Ra_{0}, & & \displaystyle\end{eqnarray}$$
and
 $\unicode[STIX]{x1D6FE}$
and
 $\unicode[STIX]{x1D712}$
are two constant numbers. In the convection-time framework, combining (4.10)–(4.13) with (2.17) results in
 $$\begin{eqnarray}\displaystyle {\displaystyle \frac{\text{d}\overline{\overline{C}}}{\text{d}t_{a}}}=\unicode[STIX]{x1D6FE}\unicode[STIX]{x1D712}[1-(1+\unicode[STIX]{x1D6F1})\overline{\overline{C}}]^{2}. & & \displaystyle\end{eqnarray}$$
Solving this ordinary differential equation gives
 $$\begin{eqnarray}\displaystyle \overline{\overline{C}}(t_{a})={\displaystyle \frac{1}{1+\unicode[STIX]{x1D6F1}}}\left[1-{\displaystyle \frac{1}{\unicode[STIX]{x1D6FE}\unicode[STIX]{x1D712}(1+\unicode[STIX]{x1D6F1})t_{a}+c_{0}}}\right]. & & \displaystyle\end{eqnarray}$$
From (2.17) and (4.10), we obtain the models for
 $C_{s}$
and
 $F$
for the shut-down regime:
 $$\begin{eqnarray}\displaystyle C_{s}(t_{a})={\displaystyle \frac{1}{1+\unicode[STIX]{x1D6F1}}}\left[1+{\displaystyle \frac{\unicode[STIX]{x1D6F1}}{\unicode[STIX]{x1D6FE}\unicode[STIX]{x1D712}(1+\unicode[STIX]{x1D6F1})t_{a}+c_{0}}}\right]\quad \text{and}\quad F(t_{a})={\displaystyle \frac{\unicode[STIX]{x1D6FE}\unicode[STIX]{x1D712}Ra_{0}}{[\unicode[STIX]{x1D6FE}\unicode[STIX]{x1D712}(1+\unicode[STIX]{x1D6F1})t_{a}+c_{0}]^{2}}}. & & \displaystyle \nonumber\\ \displaystyle & & \displaystyle\end{eqnarray}$$
We choose
 $\unicode[STIX]{x1D6FE}\unicode[STIX]{x1D712}=0.0317$
and
 $c_{0}=0.861$
by fitting (4.16) with the DNS data so that, at
 $\unicode[STIX]{x1D6F1}=0$
, our model is consistent with the theoretical box model given by Slim (Reference Slim2014) and
 $F(t_{a}=16)=\unicode[STIX]{x1D6FC}Ra_{0}$
.
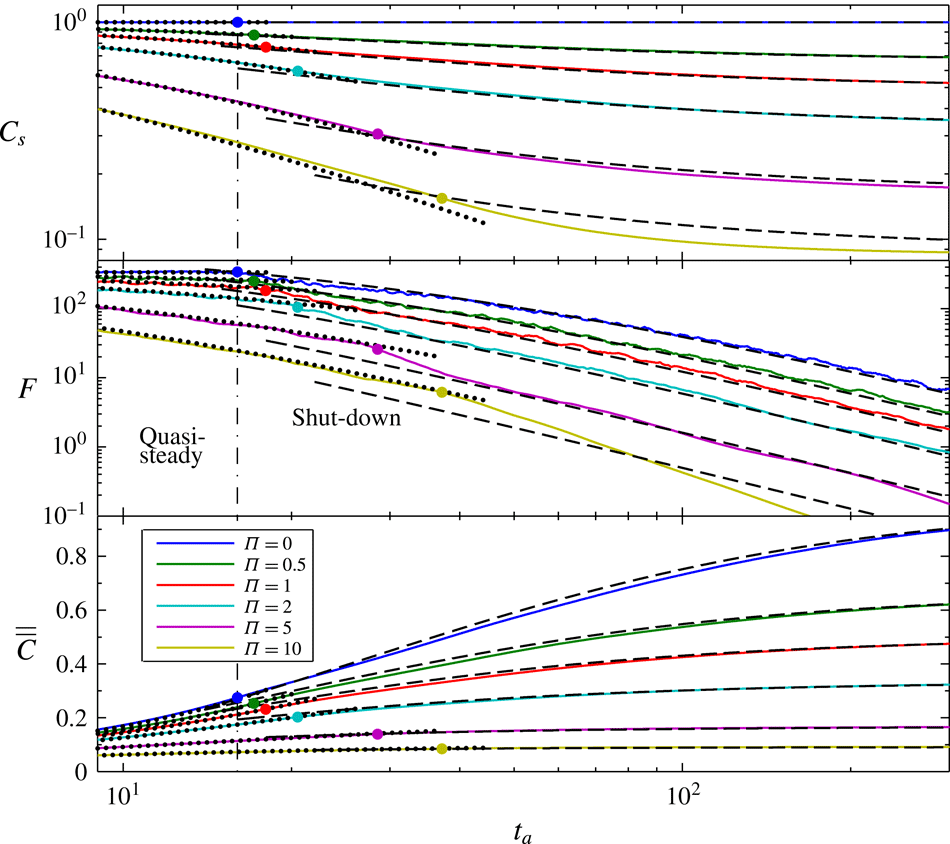
Figure 11 shows the comparisons between the mathematical models and the numerical simulations in the shut-down regime for different
 $\unicode[STIX]{x1D6F1}$
at
 $Ra_{0}=20\,000$
. For
 $\unicode[STIX]{x1D6F1}<10$
, the models in (4.15) and (4.16) are in good agreement with the DNS results in the shut-down regime. For
 $\unicode[STIX]{x1D6F1}\geqslant 10$
, however, the model breaks down in the shut-down regime, because a stable stratification forms at the base of the domain. Nevertheless, in these cases the water is already 95 % saturated, so that the additional dissolution during the shut-down regime is negligible. In these cases, the drop in
 $C_{s}$
, and hence in
 $Ra_{e}$
, is so rapid that convection is not vigorous enough to maintain a well-mixed solution near the bottom.
Comparisons between mathematical models (dashed lines) and numerical simulations (solid lines) for the shut-down regime in closed systems at
 $Ra_{0}=20\,000$
: (a) the interface concentration
 $C_{s}$
; (b) the dissolution flux
 $F$
; (c) the volume-averaged concentration
 $\overline{\overline{C}}$
. The dots mark the time of transition to the shut-down regime from DNS for various
 $\unicode[STIX]{x1D6F1}$
. For reference, mathematical models for the quasi-steady regime (dotted lines) are also plotted.

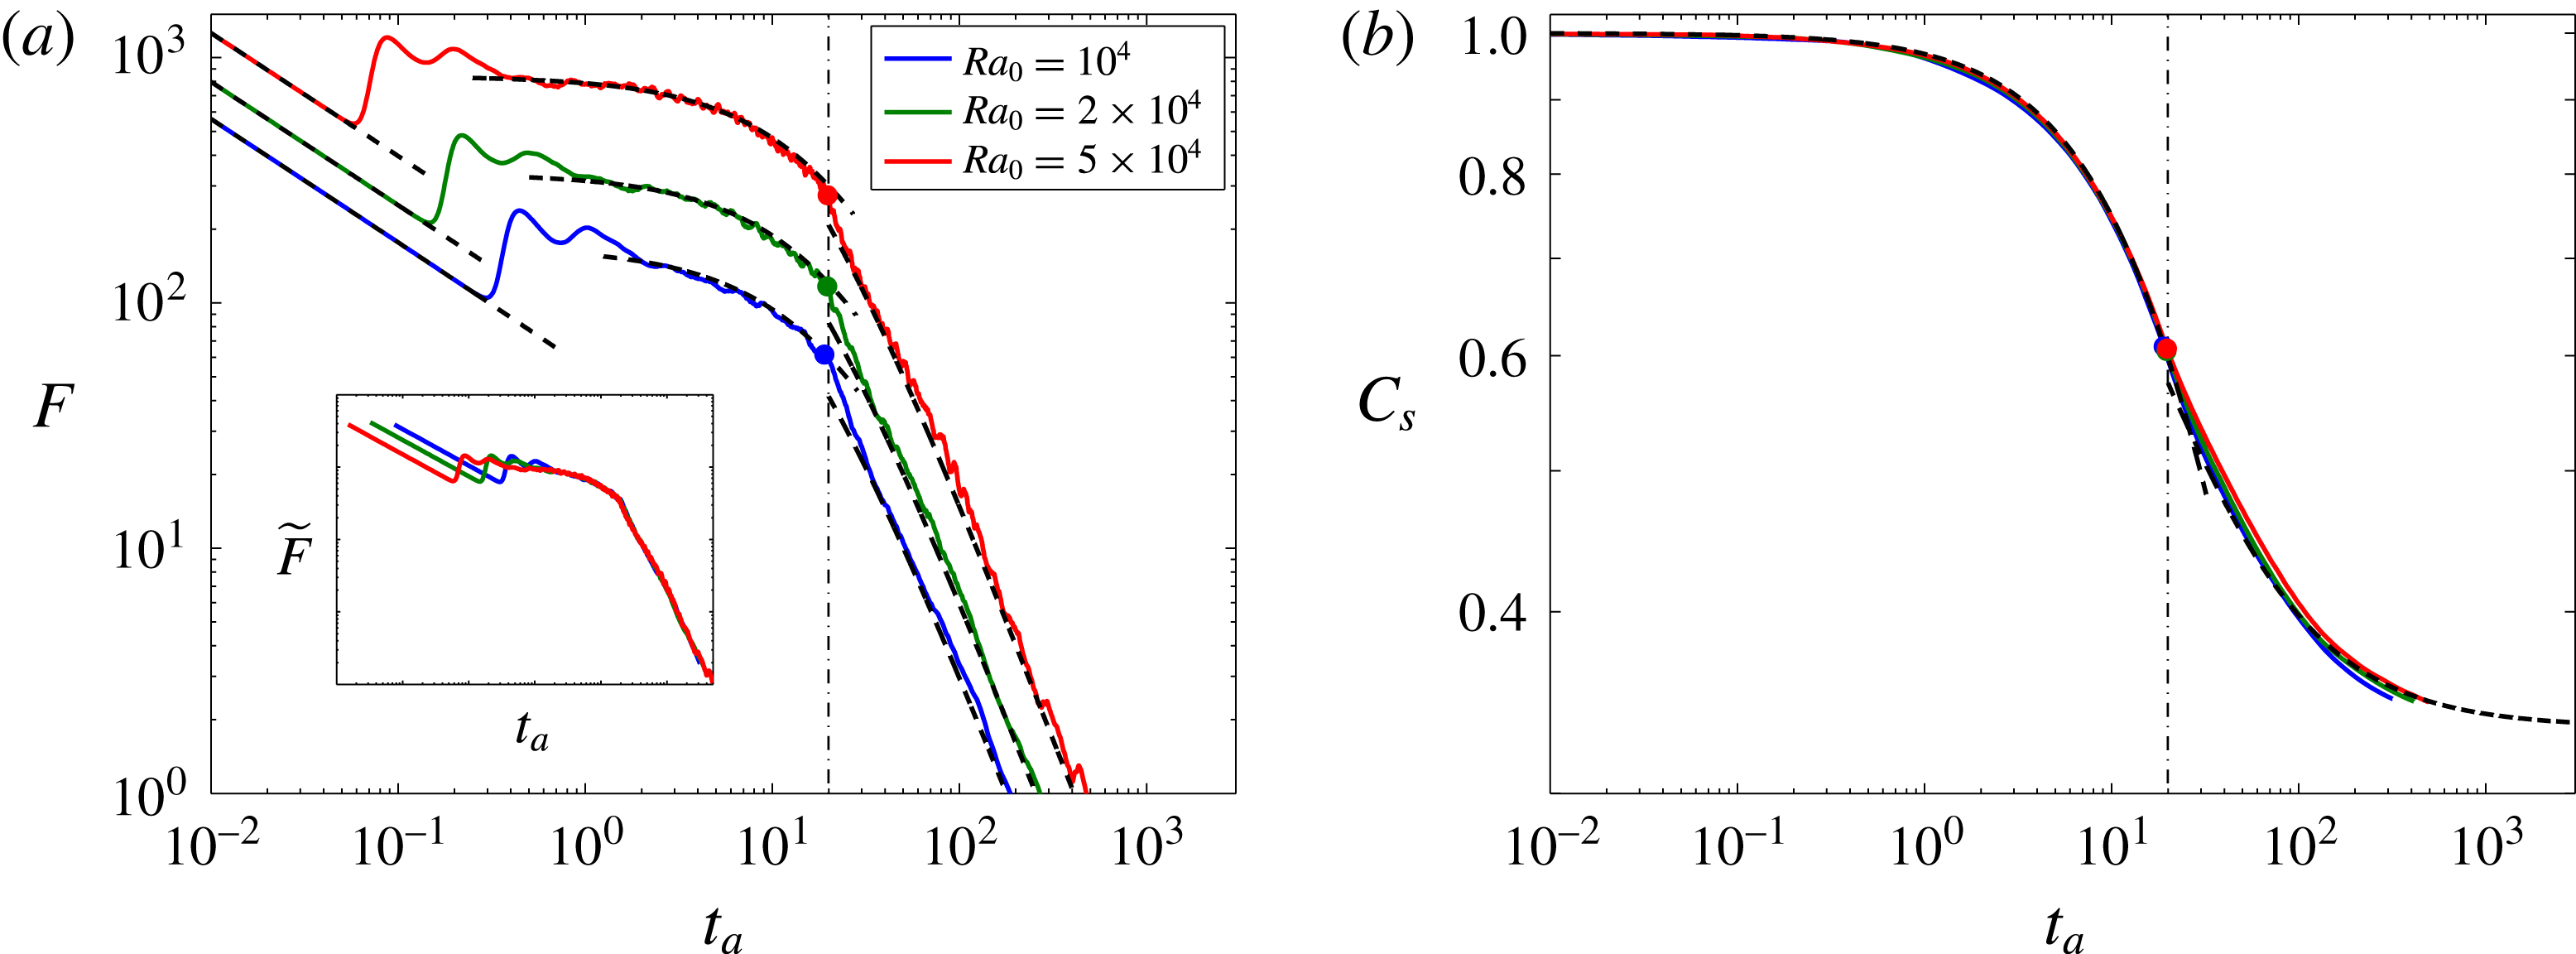
Comparisons between mathematical models (dashed lines) and numerical simulations (solid lines) at
 $\unicode[STIX]{x1D6F1}=2$
for various
 $Ra_{0}$
: (a) the dissolution flux
 $F$
; (b) the interface concentration
 $C_{s}$
. The inset in (a) shows the evolution of normalised flux
 $\widetilde{F}=F/(\unicode[STIX]{x1D6FC}Ra_{0})$
in time, and the dots and dot-dashed lines mark the time of transition to the shut-down regime from DNS and the model (4.9), respectively.

To verify the mathematical models developed above, DNS were also performed for other high Rayleigh numbers following the same strategy described at the beginning of § 4, but using different numbers of vertical modes and time steps. Figure 12 compares the mathematical models with the DNS results in different flow regimes at
 $\unicode[STIX]{x1D6F1}=2$
for
 $Ra_{0}=10\,000$
, 20 000 and 50 000. The models (4.5), (4.9) and (4.16) match well with the simulation results for various
 $Ra_{0}$
due to the asymptotic high-Rayleigh-number behaviour of convection in porous media. Moreover, for fixed
 $\unicode[STIX]{x1D6F1}$
our DNS results indeed show that the rescaled dissolution flux
 $\widetilde{F}$
, the time of transition to the shut-down regime
 $t_{s}$
, and the interface concentration
 $C_{s}$
are independent of
 $Ra_{0}$
in terms of advection time in both quasi-steady and shut-down regimes, as also revealed from the models.
Although our models in this manuscript only focus on 2D domains, the study by Shi et al. (Reference Shi, Wen, Hesse, Tsotsis and Jessen2018) reveals that a similar 2D convective modelling strategy predicts the dissolution rate of
 $\text{CO}_{2}$
at initial pressures up to 6 MPa at
 $T=50\,^{\circ }\text{C}$
in a 3D cylinder filled with water-saturated porous media. Moreover, investigations by Pau et al. (Reference Pau, Bell, Pruess, Almgren, Lijewski and Zhang2010), Fu, Cueto-Felgueroso & Juanes (Reference Fu, Cueto-Felgueroso and Juanes2013) and Hewitt, Neufeld & Lister (Reference Hewitt, Neufeld and Lister2014) indicate that the power-law-scaling characteristics appearing in 2D also exist in 3D buoyancy-driven porous media convection. Therefore, it is possible to apply our 2D mathematical models directly to 3D or extend the 2D models to 3D by changing appropriate coefficients.
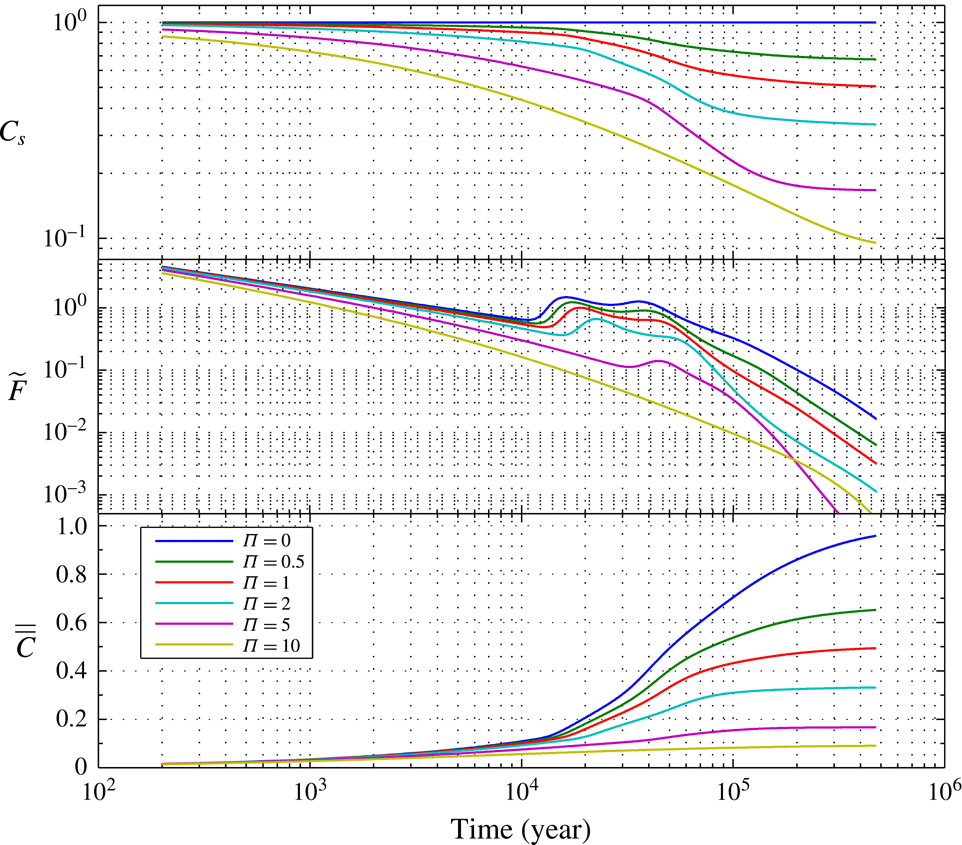
5 Discussion
The pressure drop induced by
 $\text{CO}_{2}$
dissolution in a closed reservoir provides a strong negative feedback for convective dissolution. While engineered storage sites are likely open systems to limit pressure build-up during injection, natural
 $\text{CO}_{2}$
reservoirs may be closed systems. Understanding the dynamics of natural
 $\text{CO}_{2}$
accumulations is important, since they are our only analogues for the long-term fate of geological
 $\text{CO}_{2}$
storage.
In the analyses presented below it should be kept in mind that the models presented here are based on numerous assumptions. Most importantly, our results are based on simulations in two-dimensional homogeneous isotropic systems with rectangular geometry, and they neglect hydrodynamic dispersion.
5.1 Closed system dissolution in the Bravo Dome natural
$\text{CO}_{2}$
field

The Bravo Dome
 $\text{CO}_{2}$
field in New Mexico is commonly used as an analogue for geological
 $\text{CO}_{2}$
storage, but recent work has shown that it comprises a number of isolated pressure compartments (Akhbari & Hesse Reference Akhbari and Hesse2017). It is unclear when these compartments became isolated and started acting as closed systems. In the calculation below we assume that they have been isolated for the majority of the lifetime of the reservoir. Here we focus on the NE section of the reservoir, where significant
 $\text{CO}_{2}$
dissolution has occurred (Gilfillan et al.
Reference Gilfillan, Lollar, Holland, Blagburn, Stevens, Schoell, Cassidy, Ding, Zhou, Lacrampe-Couloume and Ballentine2009; Sathaye et al.
Reference Sathaye, Hesse, Cassidy and Stockli2014). This section is separated from the main reservoir by a major fault and parts of it are underlaid by a deep aquifer. In this section, the dissolution capacity is
 $\unicode[STIX]{x1D6F1}\approx 2$
, the average depth of the reservoir is
 $H_{w}=130$
m, the vertical permeability
 $K=2.5\times 10^{-15}~\text{m}^{2}$
, the porosity
 $\unicode[STIX]{x1D711}=0.14$
, the tortuosity of sandstone is
 $\unicode[STIX]{x1D70F}\approx 4$
, gravitational acceleration
 $g=9.8~\text{m}~\text{s}^{-2}$
, initial density difference
 $\unicode[STIX]{x0394}\unicode[STIX]{x1D70C}_{0}^{\ast }=10.5~\text{kg}~\text{m}^{-3}$
, water viscosity at
 $35\,^{\circ }\text{C}$
is
 $\unicode[STIX]{x1D707}=8.9\times 10^{-4}~\text{Pa}~\text{s}$
, and the diffusivity of aqueous
 $\text{CO}_{2}$
is
 $D_{m}=2\times 10^{-9}~\text{m}^{2}~\text{s}^{-1}$
.
Due to the relatively large tortuosity the effective diffusivity,
 $D=D_{m}/\unicode[STIX]{x1D70F}$
, in the sandstones is only
 $5\times 10^{-10}~\text{m}^{2}~\text{s}^{-1}$
and may be even less in the lower porosity siltstones (Gist et al.
Reference Gist, Thompson, Katz and Higgins1990; Hürlimann et al.
Reference Hürlimann, Helmer, Latour and Sotak1994; Zecca et al.
Reference Zecca, Honari, Vogt, Bijeljic, May and Johns2016). The resulting initial Rayleigh number in this field is
 $Ra_{0}\approx 540$
and the characteristic time scales are
 ${\mathcal{T}}_{ad}\approx 4$
years,
 ${\mathcal{T}}_{a}\approx 2000$
years and
 ${\mathcal{T}}_{d}\approx 1$
Ma. Although the Rayleigh number is large enough that Bravo Dome likely experienced convective
 $\text{CO}_{2}$
dissolution, it was not vigorous enough for a well-developed quasi-steady convection regime, so that the models developed in § 4.2 do not apply to Bravo Dome.
Instead, the diffusive models developed in § 3.1 provide an upper bound on the dissolution time scales at Bravo Dome. The time required for dissolved
 $\text{CO}_{2}$
to diffuse to the bottom of the reservoir is
 $t_{d}\approx 0.1{\mathcal{T}}_{d}$
, which corresponds to approximately 100 000 years in the NE section of Bravo Dome. The time required to saturate the underlying aquifer is
 $t_{d}\approx {\mathcal{T}}_{d}$
(figure 3
d) and hence comparable to the estimated lifetime of the reservoir (Sathaye et al.
Reference Sathaye, Hesse, Cassidy and Stockli2014). This calculation assumes that all brine directly underlies the gas–water interface. In the NE section of Bravo Dome this is not strictly true, since the gas is localised within two domes and significant lateral transport has to occur to saturate the entire brine within the reservoir.
In the context of the simplified model explored here; however, it is possible that the underlying brine has been saturated. In this case, the fraction of
 $\text{CO}_{2}$
that has been dissolved at global equilibrium is given by
 $$\begin{eqnarray}\displaystyle \frac{P_{g,0}^{\ast }-P_{g,e}^{\ast }}{P_{g,0}^{\ast }}=1-C_{s,e}=\frac{\unicode[STIX]{x1D6F1}}{1+\unicode[STIX]{x1D6F1}}\approx 0.66. & & \displaystyle\end{eqnarray}$$
The maximum amount of dissolution in the NE segment of Bravo Dome is limited to two-thirds of the amount that would have occurred in an equivalent open system. This is due to the significant drop in the gas pressure, which lowers the aqueous solubility of
 $\text{CO}_{2}$
. The theoretical estimate (5.1) is comparable to the estimate of 0.5, based on noble gases and reservoir characterisation (Sathaye et al.
Reference Sathaye, Hesse, Cassidy and Stockli2014).
Evolution of the interface concentration
 $C_{s}$
, the normalised dissolution flux
 $\widetilde{F}=F/(\unicode[STIX]{x1D6FC}Ra_{0})$
and the total dissolution
 $\overline{\overline{C}}$
in dimensional time for
 $Ra_{0}=540$
, based on the Bravo Dome field parameters. The domain aspect ratio for the DNS reported here is
 $L=10^{5}/Ra_{0}\approx 185$
.

To more comprehensively understand the convective
 $\text{CO}_{2}$
dissolution process in Bravo Dome, DNS were also performed at
 $Ra_{0}=540$
for various
 $\unicode[STIX]{x1D6F1}$
. It is seen from figure 13 that the
 $\text{CO}_{2}$
dissolution is significantly affected by
 $\unicode[STIX]{x1D6F1}$
at moderate
 $Ra_{0}$
: the onset time is delayed as
 $\unicode[STIX]{x1D6F1}$
increases and at
 $\unicode[STIX]{x1D6F1}\gtrsim 10$
no convection occurs, i.e. the transport is by diffusion. Based on these DNS data, for
 $\unicode[STIX]{x1D6F1}=0$
convection sets in after
 $130\,{\mathcal{T}}_{ad}\approx 480$
years and the dissolution flux starts to grow after
 $3000\,{\mathcal{T}}_{ad}\approx 11\,000$
years; while for
 $\unicode[STIX]{x1D6F1}=2$
, the onset of convection occurs around
 $140\,{\mathcal{T}}_{ad}\approx 520$
years and the dissolution flux starts to grow after
 $4300\,{\mathcal{T}}_{ad}\approx 16\,000$
years. Moreover, figure 13 also reveals that no apparent quasi-steady convective regime exists at
 $Ra_{0}=540$
, e.g. for
 $\unicode[STIX]{x1D6F1}\leqslant 5$
the convection begins to shut down right after the flux-growth and plume-merging regime. For
 $\unicode[STIX]{x1D6F1}=0$
, the dissolution flux is halved after 70 000 years and is one-tenth of its initial value after 200 000 years; and the reservoir becomes 95 % saturated after 420 000 years. For
 $\unicode[STIX]{x1D6F1}>0$
, however, the dissolution flux declines significantly due to the negative feedback of pressure drop in the gas field: compared with
 $\unicode[STIX]{x1D6F1}=0$
, the dissolution flux for
 $\unicode[STIX]{x1D6F1}=2$
is halved after 29 000 years with gas pressure reduced to 65 % and becomes one-tenth after 82 000 years with gas pressure reduced to 40 %; and the reservoir becomes 95 % saturated after 130 000 years. The closed system with
 $\unicode[STIX]{x1D6F1}>0$
therefore saturates earlier than that with
 $\unicode[STIX]{x1D6F1}=0$
, but the total amount dissolved is less due to the drop in gas pressure. When comparing these estimates the simplifications in the model and the large uncertainties in the interpretation of the field data should be kept in mind.
5.2 Time scales of high-Rayleigh-number convection in closed system
To illustrate the effect of a closed system on a vigorously convecting system, we apply the high-
 $Ra_{0}$
convection models developed in § 4.2 to a hypothetical closed, high-permeability reservoir used in previous work (Neufeld et al.
Reference Neufeld, Hesse, Riaz, Hallworth, Tchelepi and Huppert2010; Hewitt et al.
Reference Hewitt, Neufeld and Lister2013). The parameters
 $H_{w}=20$
m,
 $K=2.5\times 10^{-12}~\text{m}^{2}$
,
 $\unicode[STIX]{x0394}\unicode[STIX]{x1D70C}_{0}^{\ast }=10.5~\text{kg}~\text{m}^{-3}$
,
 $\unicode[STIX]{x1D711}=0.375$
,
 $D_{m}=2\times 10^{-9}~\text{m}^{2}~\text{s}^{-1}$
and
 $\unicode[STIX]{x1D707}=5.9\times 10^{-4}~\text{Pa}~\text{s}$
are loosely based on the Sleipner site in North Sea (Bickle et al.
Reference Bickle, Chadwick, Huppert, Hallworth and Lyle2007; Pau et al.
Reference Pau, Bell, Pruess, Almgren, Lijewski and Zhang2010). This reservoir comprises unconsolidated sand, so that
 $\unicode[STIX]{x1D70F}\approx \sqrt{2}$
and the effective diffusivity is
 $D=D_{m}/\unicode[STIX]{x1D70F}\approx 1.4\times 10^{-9}$
. The resulting initial Rayleigh number is
 $Ra_{0}\approx 1.6\times 10^{4}$
, and the characteristic time scales are
 ${\mathcal{T}}_{ad}\approx 0.3$
h,
 ${\mathcal{T}}_{a}\approx 0.5$
years and
 ${\mathcal{T}}_{d}\approx 9000$
years. As discussed in §§ 3.2 and 4.1, the dynamics in the diffusion-dominant regime are generally not affected by
 $\unicode[STIX]{x1D6F1}$
at large
 $Ra_{0}$
. Therefore, in such closed aquifers, convection sets in after
 $130\,{\mathcal{T}}_{ad}\approx 2$
days and the dissolution flux starts to grow after
 $3000\,{\mathcal{T}}_{ad}\approx 36$
days.
To exhibit the long-term effect of the parameter
 $\unicode[STIX]{x1D6F1}$
on
 $\text{CO}_{2}$
dissolution, we estimate the evolution of the normalised gas pressure
 $P_{g}^{\ast }/P_{g,0}^{\ast }$
(i.e.
 $C_{s}$
), dissolution flux
 $F/(\unicode[STIX]{x1D6FC}Ra_{0})$
and total dissolved
 $\text{CO}_{2}$
(i.e.
 $\overline{\overline{C}}$
) in time for this high-permeability reservoir using the box models developed in § 4.2. As shown in figure 14, for
 $\unicode[STIX]{x1D6F1}=0$
the convection starts to shut down after nine years; the dissolution flux is halved after 19 years and is one-tenth of its initial value after 60 years; and the reservoir becomes 95 % saturated after 330 years. For
 $\unicode[STIX]{x1D6F1}=2$
, however, the pressure in the gas field declines significantly as
 $\text{CO}_{2}$
dissolves into the water: the convection shuts down after
 $11$
years, when the gas pressure is reduced to 57 % of its initial value. Due to this negative feedback, the dissolution flux is halved after seven years and is one-tenth of its initial value after 20 years, and the reservoir becomes 95 % saturated after 110 years.
Contours of (a) the normalised gas pressure,
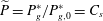 $\widetilde{P}=P_{g}^{\ast }/P_{g,0}^{\ast }=C_{s}$
, (b) the normalised dissolution flux,
 $\widetilde{F}=F/(\unicode[STIX]{x1D6FC}Ra_{0})$
, and (c) the total dissolution
 $\overline{\overline{C}}$
, based on the box models developed in § 4.2, for the high-permeability reservoir. The solid line marks the dimensional shut-down time
 $t_{s}^{\ast }=t_{s}{\mathcal{T}}_{a}$
based on (4.9). The zigzag contours around
 $t^{\ast }=t_{s}^{\ast }$
are due to the discontinuities of the box models for the quasi-steady convective and shut-down regimes at
 $t_{s}$
.

6 Conclusions
We have examined the dynamics of convective
 $\text{CO}_{2}$
dissolution in a closed porous media system, where the dissolution is accompanied by a drop in gas pressure. This introduces a negative feedback that slows both diffusive and convective mass transport and reduces the overall amount of
 $\text{CO}_{2}$
that can be dissolved. The strength of this negative feedback is controlled by the dimensionless dissolution capacity,
 $\unicode[STIX]{x1D6F1}$
, which corresponds to the fraction of the initial gas that can be dissolved into the water at equilibrium. The dynamics in a closed system with
 $\unicode[STIX]{x1D6F1}>0$
differ fundamentally from the previous common studies with
 $\unicode[STIX]{x1D6F1}=0$
, since the interface concentration, which drives mass transport, declines with time. For
 $\unicode[STIX]{x1D6F1}>0$
, diffusive mass transport is no longer self-similar and convective mass transport is never quasi-steady with a constant flux. However, we use DNS to show that the flux
 $F$
is quadratic in the interface concentration
 $C_{s}$
at high Rayleigh numbers. This allows the construction of box models that successfully capture the mean behaviour of the convecting system. Our results show that the pressure drop in closed systems can significantly limit convection long before the underlying brine begins to saturate. This may explain the persistence of natural
 $\text{CO}_{2}$
accumulations in isolated reservoir compartments over geological time periods.
As discussed earlier, our models, analysis and numerical simulations in this manuscript are based on many assumptions, including ideal-gas law, invariant volume of water during
 $\text{CO}_{2}$
dissolution, homogeneous isotropic systems, and negligible hydrodynamic dispersion, etc. These limitations should be kept in mind when the readers try to apply the analysis and models to other
 $\text{CO}_{2}$
–water dissolution systems and specific reservoirs. In Shi et al. (Reference Shi, Wen, Hesse, Tsotsis and Jessen2018), however, we have successfully applied the modelling strategies reported here to real-gas cases (
 $P_{g,0}^{\ast }\approx 6$
MPa) by adding a
 $P_{g}^{\ast }$
-dependent compressibility factor,
 $Z(P_{g}^{\ast })$
, in the equation of state (1.1) and considering a
 $P_{g}^{\ast }$
-dependent solubility,
 $K_{h}(P_{g}^{\ast })$
, in the Henry’s law equation (1.2), where
 $Z$
and
 $K_{h}$
are fitted to previously published batch phase equilibrium data. Moreover, the study by Shi et al. (Reference Shi, Wen, Hesse, Tsotsis and Jessen2018) and the discussion in the appendix also reveal that the change in the aqueous-phase volume due to
 $\text{CO}_{2}$
dissolution is still negligible (less than 3 %) at
 $P_{g,0}^{\ast }=7$
MPa and
 $T=50\,^{\circ }\text{C}$
, implying that in the modelling of convection the constant-water-volume assumption is applicable to most current laboratory experiments mentioned in this paper and many underpressured natural
 $\text{CO}_{2}$
reservoirs listed in Miocic et al. (Reference Miocic, Gilfillan, Roberts, Edlmann, McDermott and Haszeldine2016) and Akhbari & Hesse (Reference Akhbari and Hesse2017), where
 $\text{CO}_{2}$
behaves as a real gas. Nevertheless, above a certain high-pressure criterion, the large solubility of
 $\text{CO}_{2}$
in water will lead to a non-negligible increase of the aqueous-phase volume, and thereby might have a first-order effect on the convective process in closed porous media systems (Moortgat Reference Moortgat2018).
Acknowledgements
We thank Dr K. Jessen for providing experimental data. This work was supported as part of the Center for Frontiers in Subsurface Energy Security, an Energy Frontier Research Center funded by the US Department of Energy, Office of Science, Basic Energy Sciences under Award no. DE-SC0001114. B.W. acknowledges the Peter O’Donnell, Jr. Postdoctoral Fellowship through the Institute of Computational and Engineering and Science at the University of Texas at Austin.
Appendix A. Volume change of aqueous phase due to
$\text{CO}_{2}$
dissolution

In this appendix, we evaluate the volume change of the aqueous phase due to
 $\text{CO}_{2}$
dissolution, based on available literature data and models of the
 $\text{CO}_{2}$
solubility in water and the saturated aqueous-phase density. For a given amount of water
 $V_{w}^{\ast }$
at a certain temperature, we consider the case of
 $\unicode[STIX]{x1D6F1}=0$
in the closed system, i.e.
 $V_{g}^{\ast }\rightarrow \infty$
, so that the gas pressure
 $P_{g}^{\ast }$
remains constant during equilibration, and the magnitude of
 $\text{CO}_{2}$
dissolution reaches the maximum compared with other cases (
 $\unicode[STIX]{x1D6F1}>0$
).
At equilibrium (i.e.
 $t^{\ast }\rightarrow \infty$
), the total mass of
 $\text{CO}_{2}$
dissolved in the aqueous phase is
 $$\begin{eqnarray}\displaystyle M_{\text{CO}_{2},a}^{\ast }=\unicode[STIX]{x1D6FA}C_{s}^{\ast }V_{a,e}^{\ast }, & & \displaystyle\end{eqnarray}$$
where
 $\unicode[STIX]{x1D6FA}=0.044~\text{kg}~\text{mol}^{-1}$
is the molecular weight of
 $\text{CO}_{2}$
,
 $C_{s}^{\ast }$
is the solubility of
 $\text{CO}_{2}$
in the aqueous phase (i.e. the concentration of
 $\text{CO}_{2}$
in the solution), and
 $V_{a,e}^{\ast }$
is the volume of the saturated aqueous phase. In general,
 $C_{s}^{\ast }$
is a nonlinear function of
 $P_{g}^{\ast }$
and its functional form can be obtained from previously published batch phase equilibrium data or models. Then, the total mass of the aqueous phase at global equilibrium is
 $$\begin{eqnarray}\displaystyle M_{a,e}^{\ast }=M_{\text{H}_{2}\text{O},0}^{\ast }+M_{\text{CO}_{2},a}^{\ast }=\unicode[STIX]{x1D70C}_{\text{H}_{2}\text{O},0}^{\ast }V_{w}^{\ast }+\unicode[STIX]{x1D6FA}C_{s}^{\ast }V_{a,e}^{\ast }, & & \displaystyle\end{eqnarray}$$
where
 $M_{\text{H}_{2}\text{O},0}^{\ast }$
and
 $\unicode[STIX]{x1D70C}_{\text{H}_{2}\text{O},0}^{\ast }$
are the mass and the density of fresh water, respectively. Since
 $V_{a,e}^{\ast }=M_{a,e}^{\ast }/\unicode[STIX]{x1D70C}_{a,e}^{\ast }$
, from (A 2) the volume of the aqueous phase after
 $\text{CO}_{2}$
dissolution can be expressed as
 $$\begin{eqnarray}\displaystyle V_{a,e}^{\ast }={\displaystyle \frac{\unicode[STIX]{x1D70C}_{\text{H}_{2}\text{O},0}^{\ast }V_{w}^{\ast }}{\unicode[STIX]{x1D70C}_{a,e}^{\ast }-\unicode[STIX]{x1D6FA}C_{s}^{\ast }}}={\displaystyle \frac{\unicode[STIX]{x1D70C}_{\text{H}_{2}\text{O},0}^{\ast }V_{w}^{\ast }}{\unicode[STIX]{x1D70C}_{\text{H}_{2}\text{O},0}^{\ast }+\unicode[STIX]{x0394}\unicode[STIX]{x1D70C}^{\ast }-\unicode[STIX]{x1D6FA}C_{s}^{\ast }}}, & & \displaystyle\end{eqnarray}$$
where the density of the aqueous phase,
 $\unicode[STIX]{x1D70C}_{a,e}^{\ast }$
, or the density difference between the fresh water and the saturated water,
 $\unicode[STIX]{x0394}\unicode[STIX]{x1D70C}^{\ast }$
, can be also obtained from previously published batch phase equilibrium data or models. Therefore, the relative volume change of the aqueous phase due to
 $\text{CO}_{2}$
dissolution is
 $$\begin{eqnarray}\displaystyle \unicode[STIX]{x1D6EC}={\displaystyle \frac{V_{a,e}^{\ast }-V_{w}^{\ast }}{V_{w}^{\ast }}}={\displaystyle \frac{\unicode[STIX]{x1D70C}_{\text{H}_{2}\text{O},0}^{\ast }}{\unicode[STIX]{x1D70C}_{\text{H}_{2}\text{O},0}^{\ast }+\unicode[STIX]{x0394}\unicode[STIX]{x1D70C}^{\ast }-\unicode[STIX]{x1D6FA}C_{s}^{\ast }}}-1. & & \displaystyle\end{eqnarray}$$
Below we quantify
 $\unicode[STIX]{x1D6EC}$
using the literature data and models of
 $C_{s}^{\ast }$
and
 $\unicode[STIX]{x0394}\unicode[STIX]{x1D70C}^{\ast }$
from Duan & Sun (Reference Duan and Sun2003), Efika et al. (Reference Efika, Hoballah, Li, May, Nania, Sanchez-Vicente and Trusler2016), Shi et al. (Reference Shi, Wen, Hesse, Tsotsis and Jessen2018) at
 $T=50\,^{\circ }\text{C}$
. As shown in figure 15, the volume of the aqueous phase increases monotonically as a function of the gas pressure
 $P_{g}^{\ast }$
. For
 $P_{g}^{\ast }\lesssim 1$
MPa,
 $\text{CO}_{2}$
can be treated approximately as an ideal gas, and both the solubility
 $C_{s}^{\ast }$
and the density change
 $\unicode[STIX]{x0394}\unicode[STIX]{x1D70C}^{\ast }$
increase linearly with
 $P_{g}^{\ast }$
, i.e.
 $C_{s}^{\ast }=178.140P_{g}^{\ast }$
and
 $\unicode[STIX]{x0394}\unicode[STIX]{x1D70C}^{\ast }=2.145P_{g}^{\ast }$
. Hence, from (A 4),
 $\unicode[STIX]{x1D6EC}=988/(988-5.693P_{g}^{\ast })-1$
, e.g.
 $\unicode[STIX]{x1D6EC}=0.58\,\%$
at
 $P_{g}^{\ast }=1$
MPa. For
 $P_{g}^{\ast }>1$
MPa,
 $\text{CO}_{2}$
deviates from the ideal-gas state, and both
 $C_{s}^{\ast }$
and
 $\unicode[STIX]{x0394}\unicode[STIX]{x1D70C}^{\ast }$
change as quadratic functions of
 $P_{g}^{\ast }$
. Therefore the relative volume change of the aqueous phase,
 $\unicode[STIX]{x1D6EC}$
, due to
 $\text{CO}_{2}$
dissolution is approximately 3 % at
 $P_{g}^{\ast }=7$
MPa and 3.5 % at
 $P_{g}^{\ast }=12$
MPa. This justifies our assumption that the volume change is small for the pressures encountered in underpressured natural
 $\text{CO}_{2}$
reservoirs, such as Bravo Dome.
Variation of the
 $\text{CO}_{2}$
solubility
 $C_{s}^{\ast }$
, the density change
 $\unicode[STIX]{x0394}\unicode[STIX]{x1D70C}^{\ast }$
and the volume change
 $\unicode[STIX]{x1D6EC}$
in the aqueous phase, as a function of the gas pressure
 $P_{g}^{\ast }$
at
 $T=50\,^{\circ }\text{C}$
. The experimental data of Shi et al. (Reference Shi, Wen, Hesse, Tsotsis and Jessen2018) for
 $C_{s}^{\ast }$
and
 $\unicode[STIX]{x0394}\unicode[STIX]{x1D70C}^{\ast }$
are shown as circles, while previous model results by Duan & Sun (Reference Duan and Sun2003) and Efika et al. (Reference Efika, Hoballah, Li, May, Nania, Sanchez-Vicente and Trusler2016) under supercritical conditions are shown as triangles. We note that the symbols shown for
 $\unicode[STIX]{x1D6EC}$
are calculated from the data for
 $C_{s}^{\ast }$
and
 $\unicode[STIX]{x0394}\unicode[STIX]{x1D70C}^{\ast }$
using (A 4). We fit quadratic polynomials to the experimental data of
 $C_{s}^{\ast }$
and
 $\unicode[STIX]{x0394}\unicode[STIX]{x1D70C}^{\ast }$
at
 $P_{g}^{\ast }\leqslant 7$
MPa, i.e.
 $C_{s}^{\ast }=-6.916{P_{g}^{\ast }}^{2}+178.140P_{g}^{\ast }$
and
 $\unicode[STIX]{x0394}\unicode[STIX]{x1D70C}^{\ast }=-0.0687{P_{g}^{\ast }}^{2}+2.145P_{g}^{\ast }$
(dashed lines), and thereby obtain
 $\unicode[STIX]{x1D6EC}=988/(0.236{P_{g}^{\ast }}^{2}-5.693P_{g}^{\ast }+988)-1$
(dashed line). These fits to the gaseous data also approximate the supercritical behaviour reasonably well.

Further we note that under real reservoir conditions, the
 $\text{CO}_{2}$
solubility in brine is generally less than that in pure water (Duan & Sun Reference Duan and Sun2003; Mao et al.
Reference Mao, Zhang, Li and Liu2013; Jacob & Saylor Reference Jacob and Saylor2016; Shi et al.
Reference Shi, Wen, Hesse, Tsotsis and Jessen2018), and in closed systems with
 $\unicode[STIX]{x1D6F1}>0$
, the drop of the gas pressure will further reduce the amount of
 $\text{CO}_{2}$
dissolved into the aqueous phase and hence the change in water volume. Both of these factors may increase the pressure criterion below which the change of the aqueous-phase volume can be ignored. In any case, within the scope of this study, i.e. the low-pressure regime, the volume change of the aqueous phase is negligible.
The above analysis does not imply, of course, the volume change of the aqueous phase due to
 $\text{CO}_{2}$
dissolution can be neglected in measuring or modelling the solubility
 $C_{s}^{\ast }$
and the density change
 $\unicode[STIX]{x0394}\unicode[STIX]{x1D70C}^{\ast }$
. In both Shi et al. (Reference Shi, Wen, Hesse, Tsotsis and Jessen2018) and this study, we just neglect the volume change in the modelling of convection, but use the
 $C_{s}^{\ast }(P_{g}^{\ast })$
and
 $\unicode[STIX]{x0394}\unicode[STIX]{x1D70C}^{\ast }(P_{g}^{\ast })$
functions directly from experimental measurements or models at given pressure and temperature (see figure 15) that have naturally considered the variation of the aqueous-phase volume. This will introduce a relative error, with the magnitude
 ${\sim}\,O(\unicode[STIX]{x1D6EC})$
, for the total amount of
 $\text{CO}_{2}$
dissolved into water at the global equilibrium.