





%20--%3e%3c!DOCTYPE%20svg%20PUBLIC%20'-//W3C//DTD%20SVG%201.0//EN'%20'http://www.w3.org/TR/2001/REC-SVG-20010904/DTD/svg10.dtd'%3e%3csvg%20version='1.0'%20id='Layer_1'%20xmlns='http://www.w3.org/2000/svg'%20xmlns:xlink='http://www.w3.org/1999/xlink'%20x='0px'%20y='0px'%20width='64px'%20height='64px'%20viewBox='5.5%20-3.5%2064%2064'%20enable-background='new%205.5%20-3.5%2064%2064'%20xml:space='preserve'%3e%3cg%3e%3ccircle%20fill='%23FFFFFF'%20fill-opacity='0'%20cx='37.785'%20cy='28.501'%20r='28.836'/%3e%3cpath%20fill='%23595959'%20d='M37.441-3.5c8.951,0,16.572,3.125,22.857,9.372c3.008,3.009,5.295,6.448,6.857,10.314%20c1.561,3.867,2.344,7.971,2.344,12.314c0,4.381-0.773,8.486-2.314,12.313c-1.543,3.828-3.82,7.21-6.828,10.143%20c-3.123,3.085-6.666,5.448-10.629,7.086c-3.961,1.638-8.057,2.457-12.285,2.457s-8.276-0.808-12.143-2.429%20c-3.866-1.618-7.333-3.961-10.4-7.027c-3.067-3.066-5.4-6.524-7-10.372S5.5,32.767,5.5,28.5c0-4.229,0.809-8.295,2.428-12.2%20c1.619-3.905,3.972-7.4,7.057-10.486C21.08-0.394,28.565-3.5,37.441-3.5z%20M37.557,2.272c-7.314,0-13.467,2.553-18.458,7.657%20c-2.515,2.553-4.448,5.419-5.8,8.6c-1.354,3.181-2.029,6.505-2.029,9.972c0,3.429,0.675,6.734,2.029,9.913%20c1.353,3.183,3.285,6.021,5.8,8.516c2.514,2.496,5.351,4.399,8.515,5.715c3.161,1.314,6.476,1.971,9.943,1.971%20c3.428,0,6.75-0.665,9.973-1.999c3.219-1.335,6.121-3.257,8.713-5.771c4.99-4.876,7.484-10.99,7.484-18.344%20c0-3.543-0.648-6.895-1.943-10.057c-1.293-3.162-3.18-5.98-5.654-8.458C50.984,4.844,44.795,2.272,37.557,2.272z%20M37.156,23.187%20l-4.287,2.229c-0.458-0.951-1.019-1.619-1.685-2c-0.667-0.38-1.286-0.571-1.858-0.571c-2.856,0-4.286,1.885-4.286,5.657%20c0,1.714,0.362,3.084,1.085,4.113c0.724,1.029,1.791,1.544,3.201,1.544c1.867,0,3.181-0.915,3.944-2.743l3.942,2%20c-0.838,1.563-2,2.791-3.486,3.686c-1.484,0.896-3.123,1.343-4.914,1.343c-2.857,0-5.163-0.875-6.915-2.629%20c-1.752-1.752-2.628-4.19-2.628-7.313c0-3.048,0.886-5.466,2.657-7.257c1.771-1.79,4.009-2.686,6.715-2.686%20C32.604,18.558,35.441,20.101,37.156,23.187z%20M55.613,23.187l-4.229,2.229c-0.457-0.951-1.02-1.619-1.686-2%20c-0.668-0.38-1.307-0.571-1.914-0.571c-2.857,0-4.287,1.885-4.287,5.657c0,1.714,0.363,3.084,1.086,4.113%20c0.723,1.029,1.789,1.544,3.201,1.544c1.865,0,3.18-0.915,3.941-2.743l4,2c-0.875,1.563-2.057,2.791-3.541,3.686%20c-1.486,0.896-3.105,1.343-4.857,1.343c-2.896,0-5.209-0.875-6.941-2.629c-1.736-1.752-2.602-4.19-2.602-7.313%20c0-3.048,0.885-5.466,2.658-7.257c1.77-1.79,4.008-2.686,6.713-2.686C51.117,18.558,53.938,20.101,55.613,23.187z'/%3e%3c/g%3e%3c/svg%3e)
%20--%3e%3c!DOCTYPE%20svg%20PUBLIC%20'-//W3C//DTD%20SVG%201.0//EN'%20'http://www.w3.org/TR/2001/REC-SVG-20010904/DTD/svg10.dtd'%3e%3csvg%20version='1.0'%20id='Layer_1'%20xmlns='http://www.w3.org/2000/svg'%20xmlns:xlink='http://www.w3.org/1999/xlink'%20x='0px'%20y='0px'%20width='64px'%20height='64px'%20viewBox='5.5%20-3.5%2064%2064'%20enable-background='new%205.5%20-3.5%2064%2064'%20xml:space='preserve'%3e%3cg%3e%3ccircle%20fill='%23FFFFFF'%20fill-opacity='0'%20cx='37.637'%20cy='28.806'%20r='28.276'/%3e%3cg%3e%3cpath%20fill='%23595959'%20d='M37.443-3.5c8.988,0,16.57,3.085,22.742,9.257C66.393,11.967,69.5,19.548,69.5,28.5c0,8.991-3.049,16.476-9.145,22.456%20C53.879,57.319,46.242,60.5,37.443,60.5c-8.649,0-16.153-3.144-22.514-9.43C8.644,44.784,5.5,37.262,5.5,28.5%20c0-8.761,3.144-16.342,9.429-22.742C21.101-0.415,28.604-3.5,37.443-3.5z%20M37.557,2.272c-7.276,0-13.428,2.553-18.457,7.657%20c-5.22,5.334-7.829,11.525-7.829,18.572c0,7.086,2.59,13.22,7.77,18.398c5.181,5.182,11.352,7.771,18.514,7.771%20c7.123,0,13.334-2.607,18.629-7.828c5.029-4.838,7.543-10.952,7.543-18.343c0-7.276-2.553-13.465-7.656-18.571%20C50.967,4.824,44.795,2.272,37.557,2.272z%20M46.129,20.557v13.085h-3.656v15.542h-9.944V33.643h-3.656V20.557%20c0-0.572,0.2-1.057,0.599-1.457c0.401-0.399,0.887-0.6,1.457-0.6h13.144c0.533,0,1.01,0.2,1.428,0.6%20C45.918,19.5,46.129,19.986,46.129,20.557z%20M33.042,12.329c0-3.008,1.485-4.514,4.458-4.514s4.457,1.504,4.457,4.514%20c0,2.971-1.486,4.457-4.457,4.457S33.042,15.3,33.042,12.329z'/%3e%3c/g%3e%3c/g%3e%3c/svg%3e)
1. Introduction
Shock interactions with turbulent boundary layers have ubiquitous occurrence in high-speed aerial platforms, and the unsteadiness of the shock wave–boundary layer interaction (SBLI) unit causes premature failure of aerostructures and shock buffet, among other detrimental outcomes. Significant progress have been made especially towards understanding the governing physics of unsteadiness of two-dimensional (2-D) SBLI units whose progress over several decades have been reported in multiple review articles (Dolling Reference Dolling1993, Reference Dolling2001; Clemens & Narayanaswamy Reference Clemens and Narayanaswamy2014). There has been a recent surge in the investigations into the driving mechanisms of the unsteadiness in swept SBLIs, which is the subject of the present work (Gaitonde & Adler Reference Gaitonde and Adler2023; Sabnis & Babinsky Reference Sabnis and Babinsky2023). These swept interactions are prevalent around the control surfaces (such as fins) of high-speed platforms, as well within the internal flow passages, such as the shock-induced corner separation generated at the junction between two intersecting surfaces (Burton & Babinsky Reference Burton and Babinsky2012; Funderburk & Narayanaswamy Reference Funderburk and Narayanaswamy2016; Poggie & Porter Reference Poggie and Porter2019; Rabey et al. Reference Rabey, Jammy, Bruce and Sandham2019).
The common unit problem configurations of the swept interactions include the glancing shock-induced separation generated by swept compression ramps and sharp fins placed in a supersonic freestream; more recent works have also included an impinging SBLI generated by a swept oblique shock (Vanstone et al. Reference Vanstone, Musta, Seckin and Clemens2018; Adler & Gaitonde Reference Adler and Gaitonde2019; Padmanabhan et al. Reference Padmanabhan, Maldonado, Threadgill and Little2021). These SBLI units generate an ‘open’ separation, meaning that the fluid originating at a given separation location will follow a helical trajectory and will recirculate back to a downstream location along the separation locus. Gaitonde, Shang & Visbal (Reference Gaitonde, Shang and Visbal1995) argued that these separated fluids need not necessarily reattach. Early wall pressure measurements by Professor Bognoff's team on sharp fin interactions suggested the lack of a unifying length scale for these swept interactions (Settles, Perkins & Bogdonoff Reference Settles, Perkins and Bogdonoff1980; Knight et al. Reference Knight, Horstman, Shapey and Bogdonoff1987; Tan, Tran & Bogdonoff Reference Tan, Tran and Bogdonoff1987). Settles & Lu (Reference Settles and Lu1985) and Settles & Kimmel (Reference Settles and Kimmel1986) concluded that the mean pressure fields exhibited a quasi-conical symmetry, meaning that the mean flow properties are constant along the rays originating from a virtual conical origin (VCO). Alvi & Settles (Reference Alvi and Settles1992) presented cross-sectional images of the separation flow unit generated by a fin SBLI. It was observed that the fin shock generates a separation vortex upon boundary layer separation and the separation vortex was bound by the separation shock in the outboard side and the reattachment shock stem present on the inboard region of the vortex; note that the reattachment shock foot could not be visualised. Zheltovodov (Reference Zheltovodov2006) subsequently presented a regime map of six distinct flow units that can arise from the sharp fin interactions with different combinations of inflow Mach numbers and fin angles. Recently, Sebastian & Lu (Reference Sebastian and Lu2021) elucidated the scaling of the mean flow features of the fin SBLI with laminar boundary layers. Similarly, Vanstone et al. (Reference Vanstone, Musta, Seckin and Clemens2018) presented the scaling of the mean and turbulent flow properties in swept ramp interactions that also exhibit quasi-conical symmetry.
The unsteady nature of the separation shock motions were also documented extensively. Schmisseur & Dolling (Reference Schmisseur and Dolling1994) and more recently Arora, Mears & Alvi (Reference Arora, Mears and Alvi2019) made measurements of the unsteady pressure field beneath the separation shock foot (in the intermittent region) and demonstrated that the root-mean-square (r.m.s.) pressure also exhibits the quasi-conical symmetry that was observed in the mean quantities. Erengil & Dolling (Reference Erengil and Dolling1993) investigated the power spectral density (PSD) within the intermittent region and noted a significant increase in the separation shock unsteadiness frequencies (shift from low-frequency to mid-frequency range oscillations) with increasing sweep angle of the swept ramp interactions. This shift in the unsteadiness from low- to mid-frequency range was also observed in subsequent works on fin SBLIs (Schmisseur & Dolling Reference Schmisseur and Dolling1994; Adler & Gaitonde Reference Adler and Gaitonde2020).
The focus of the present study being the mechanisms that drive the unsteadiness of the fin SBLI, it is important to have a grasp of the state of knowledge in the 2-D SBLI units that are investigated extensively and then proceed to review the fin SBLI research. The readers are referred to the reviews on 2-D SBLI unsteadiness to obtain a detailed picture (Dolling Reference Dolling2001; Clemens & Narayanaswamy Reference Clemens and Narayanaswamy2014). Summarily, the recent consensus in 2-D SBLI driving mechanism is the entrainment balance between the shear layer that develops over the separation bubble and the mass injection at the reattachment region (Piponniau et al. Reference Piponniau, Dussauge, Debieve and Dupont2009; Chandola, Huang & Estruch-Samper Reference Chandola, Huang and Estruch-Samper2017). The contributions from the incoming boundary layer as well as the intrinsic global stability of the 2-D separation unit have also been identified to modulate the separation bubble (Pirozzoli, Grasso & Gatski Reference Pirozzoli, Grasso and Gatski2004; Wu & Martin Reference Wu and Martin2008; Pasquariello, Hickel & Adams Reference Pasquariello, Hickel and Adams2017). Furthermore, there is broad consensus that the direct role of the incoming boundary layer towards driving the separation shock pulsations is restricted to incipient to intermittent separation whereas the larger separation units are primarily driven by the mechanisms that are intrinsic to the separation bubble instabilities. Recent evidence also shows a more indirect influence of the boundary layer on the separation shock motions at large separation scales, which is caused by the boundary layer structures modulating the entrainment balance of the separation bubble (Chandola et al. Reference Chandola, Huang and Estruch-Samper2017; Jenquin, Johnson & Narayanaswamy Reference Jenquin, Johnson and Narayanaswamy2023).
Garg & Settles (Reference Garg and Settles1996) was among the first to study the mechanisms that drive the separation vortex motions in a fin SBLI. The authors observed that the reattachment line unsteadiness was caused by the large-scale motions of the separation vortex. Notably this study could not ascertain the mechanisms that drive the separation vortex motions. Subsequent work by Vanstone et al. (Reference Vanstone, Musta, Saleem, Seckin and Clemens2016) identified that different frequency range of shock oscillations in a swept ramp SBLI unit were driven by different mechanisms. Specifically, Vanstone et al. (Reference Vanstone, Musta, Saleem, Seckin and Clemens2016) posited that whereas the near-wall integrated momentum fluctuations and the superstructures within the incoming boundary layer drove the low and mid frequencies of the separated flow pulsations, high frequencies were driven by convection of velocity structures within the separated flow. Huang & Estruch-Samper (Reference Huang and Estruch-Samper2018) presented a different perspective in terms of entrainment rate of the shear layer above the separation vortex to explain the separated flow pulsations in swept ramp SBLIs. This perspective can be thought of as an extension of the driving mechanisms of 2-D SBLI. Arora et al. (Reference Arora, Mears and Alvi2019) performed cross-coherence mapping of the separation shock oscillations with other locations within a fin SBLI and found noticeable coherence with the reattachment shock oscillations at the Strouhal number range  $St_\delta < 0.1$. Adler & Gaitonde (Reference Adler and Gaitonde2019, Reference Adler and Gaitonde2020) argued that the open nature of the separated flow in both swept ramp and sharp fin SBLIs necessitates the driving mechanisms of the separated flow predominantly by convective instabilities.
An important limitation that precludes the experimental determination of the driving mechanisms of fin SBLI motions is the presence of a strong cross-flow velocity component in these highly swept interactions that can result in feed-forward coupling in the streamwise direction. The measurements reported thus far were made at fixed radial locations and could not address the downstream/convective coupling within the fin SBLI unit. Vanstone et al. (Reference Vanstone, Musta, Saleem, Seckin and Clemens2016) and Funderburk & Narayanaswamy (Reference Funderburk and Narayanaswamy2019b) implemented high-bandwidth pressure sensitive paints for 2-D pressure field imaging in a compression ramp SBLI, which provided the pressure field at kilohertz-range acquisition; recently Mears et al. (Reference Mears, Baldwin, Ali, Kumar and Alvi2020) extended the application to fin SBLI at 50-kHz repetition rate. The advent of high-frequency pressure field imaging provides an unprecedented ability to probe the dynamics of the fin SBLI and a unique lens to study the spatial coupling between different locations within the SBLI. This becomes a key enabler to study the convective interactions in the fin SBLI units as well as investigate other possible mechanisms that drive the separation vortex pulsations.
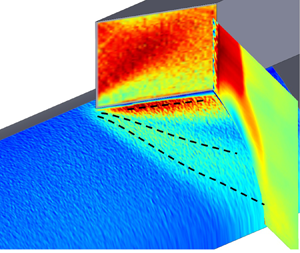
In this work, we investigate the unsteady pressure fields generated by a fin SBLI unit and address the azimuthal and downstream coupling between the different regions of the SBLI unit. The SBLI was generated by a 20 $^\circ$ sharp fin placed on a cylindrical surface, whose schematic is shown in figure 1(a). Pickles et al. (Reference Pickles, Mettu, Subbareddy and Narayanaswamy2019) reported strong quantitative similarities of the shock structure, mean pressure evolution and separated flowfield between the fin-on-cylinder and planar-fin SBLI units. Figure 1(b) shows the cross-sectional planar laser scattering imaging of the SBLI flowfield that illustrates the strong similarity in the shock structure between the two units. Also noticeable in figure 1(b) is that the three-dimensional (3-D) relief from the cylinder curvature causes the separation shock to wrap around the cylinder surface, which weakens the separation shock with downstream distance. The former can also be noticed in the overlay of the mean pressure and mean cross-sectional velocity field of figure 1(c). The other objective of this work is to address how this progressive weakening of the separation shock would affect its dynamics.
Schematic illustration of the test article set-up (a) and the delineation of the basic structure of the fin on cylinder SBLI unit using cross-sectional planar laser scattering imaging (b) from Pickles et al. (Reference Pickles, Mettu, Subbareddy and Narayanaswamy2019) as well as an overlay of the mean pressure field and mean cross-sectional velocity field (c).

2. Experimental approach
2.1. Freestream conditions
All experiments were performed in the NCSU blowdown supersonic wind tunnel at a fixed Mach number of  $M_\infty =2.5$, yielding the freestream test conditions compiled in table 1. The test section measured
 $150\ {\rm mm} \times 150\ {\rm mm}\times 650\ {\rm mm}$ and had optical access from three of its four sides. Each test run was approximately 8 s long and the stagnation pressure was maintained to within 3 % over the test duration. The datasets reported in the present study were obtained over 3.5 s of steady flow operation and over five independent runs. The run-to-run repeatability of the stagnation pressure was better than 2 %. Further details of the facility can be found in the earlier works done in the same facility (Funderburk & Narayanaswamy Reference Funderburk and Narayanaswamy2016, Reference Funderburk and Narayanaswamy2019a).
Freestream test conditions.

2.2. Test article and inflow conditions
A half-cylinder model, 430 mm in length and 50 mm in diameter, with sharp leading edge was placed facing the freestream at nominally zero yaw and pitch angle. Its mounting struts recessed the entire test article away from the wind tunnel boundary layer. A 25-mm-tall 20 $^\circ$ sharp fin was mounted on the cylinder surface at a downstream distance of 340 mm. A fully developed equilibrium turbulent boundary layer developed naturally over the cylindrical surface and the boundary layer thickness based on
 $99\,\%$ freestream velocity (
 $\delta _{99}$) measured upstream of the fin leading edge was 6 mm. The maximum thickness of the fin was 9.5 mm, and the fin was mounted along the middle of the thickness; this circumferentially offset the fin leading edge from the cylinder axis of symmetry by 4.5 mm. The glancing shock emanated from the fin interacted with the incoming turbulent boundary layer to result in the fin SBLI unit (figure 1a). In this work,
 $x = 0$ mm corresponds to the streamwise location of the fin leading edge and the
 $x$-axis is oriented along the flow direction; similarly, the circumferential origin (
 $s = 0$ mm) corresponds to the line of symmetry of the half-cylinder and is oriented along the outboard direction.
2.3. Dynamic pressure-sensitive paint measurements
An in-house mixed platinum luminophore fast-response polymer/ceramic pressure-sensitive paint (PC-PSP) was employed based on the formulations by McMullen et al. (Reference McMullen, Huynh, Gregory and Crafton2013). As recommended by the authors, a platinum complex (Pt(II) meso-tetra(pentafluorophenyl)porphine or PtTFFP) was chosen as the luminophore. Two steps were involved in the preparation of the paint. First, a ceramic slurry solution was prepared by mixing distilled water with 12.5 mg of a ceramic dispersant (Rohm & Haas D-3005) per gram of water and 1.25 g of titanium dioxide (TiO $_2$) per gram of water. After ball-milling the slurry solution for an hour, rhoplex HA-8 (Rohm & Haas) emulsifier was then added by a weight fraction of 3.5 %. Before the PC-PSP paint was applied, a commercial basecoat from Innovative Scientific Solutions Inc. (ISSI) was layered on the model surface to prevent rusting. Subsequently, a two-step application of PC-PSP basecoat and the luminophore was made to yield a smooth finish. The time response of the paint was highly sensitive to paint coat and mixture. The sprayable form of the PSP has been shown to exhibit response times as low as 10
 $\mathrm {\mu }$s for the paint thickness used in the present effort (Egami, Sato & Konishi Reference Egami, Sato and Konishi2019). The paint had a pressure sensitivity of
 $S_p = 0.62\,\%$ kPa, a temperature sensitivity of
 $S_T = 1.05\,\%$ K and a degradation rate of
 $-$23.3 % h.
The calibration method utilised a commercial pressure-sensitive paint (ISSI Inc., model uniFIB) that had a slow time response, but a much higher pressure sensitivity and a considerably lower temperature sensitivity compared with PC-PSP; the uniFIB paint also came with a manufacturer calibration. The mean pressure field of the flow unit and a separate pressure-controlled calibration cell set-up were used as a calibration targets for the PC-PSP. Similarly, the spectral response of the paint was estimated by carefully measuring the luminophore thickness distribution on a sample and using the literature values of the oxygen mass diffusivity. The luminophore thickness distribution was quantified over a representative area ( $1.7\ {\rm mm} \times 1.2\ {\rm mm}$) using a 3-D laser confocal profilometer. The mean height of luminophore layer was measured at 12.2
 $\mathrm {\mu }$m and the r.m.s. was approximately 1.5
 $\mathrm {\mu }$m (Jenquin et al. Reference Jenquin, Johnson and Narayanaswamy2023). The measurement uncertainty of the device quoted by the manufacturer was 0.05
 $\mathrm {\mu }$m. Based on the mean value and the
 $D_m=1.96 \times 10^{-7}$ m
 $^2$ s
 $^{-1}$ from Kameda et al. (Reference Kameda, Seki, Makoshi, Amao and Nakakita2012), the diffusion time constants through the paint was determined as
 $0.076$ ms and a 6 dB attenuation frequency of 6 kHz (
 $St_\delta \approx 0.06$), which is considerably greater than the low-frequency range of the separation shock motions and exceeds the peak Strouhal number of the mid-frequency range of the separation shock motions (Vanstone et al. Reference Vanstone, Musta, Saleem, Seckin and Clemens2016; Adler & Gaitonde Reference Adler and Gaitonde2020). A direct measure of the spectral response of the PSP was also made by impinging a pulsed jet on a coupon coated with the same PSP coat. The jet was pulsed at 10 Hz with 60 % duty cycle. A high-bandwidth pressure transducer (effective flat response frequency until 50 kHz) was also inserted flush on the coupon such that a simultaneous pressure measurement was also made of the impinging jet pulse. Figure 2 makes a comparison of the normalised spectral response between the PSP and the transducer. The PSP can be observed to provide a nearly unattenuated response until 3 kHz. The signal attenuation reaches its
 $-$6 dB limit at around 10 kHz, which is very similar to the calculated estimate of 6 kHz. Overall, the response further reiterates that the PSP can resolve both the low- and mid-frequency range of the separation shock motions without appreciable attenuation. Benchtop tests using pulsed jet tests were also made to independently quantify the measurement uncertainty. To this end, simultaneous pressure measurements were made using the high-bandwidth transducer and the pressure-sensitive paint. It should be noted that there was still some contamination from the electronic noise in the transducer data from the amplifier generated by the driving a.c. voltage supply. Ignoring this contribution, the average (absolute) difference between the pressure data between the two approaches was obtained as an estimate of the uncertainty. This uncertainty was determined to be 1.2 kPa, which consistent with the prior estimates from Jenquin et al. (Reference Jenquin, Johnson and Narayanaswamy2023) that used the same paint. The measurements reported here were acquired over five highly repeatable test runs with data collected over 4 s (
 $1.6 \times 10^5$ instantaneous fields) of steady wind tunnel operation for each run.
Measured spectral response of the high-bandwidth PSP to an impinging periodic jet pulse benchmarked on the response of a high-bandwidth pressure transducer.
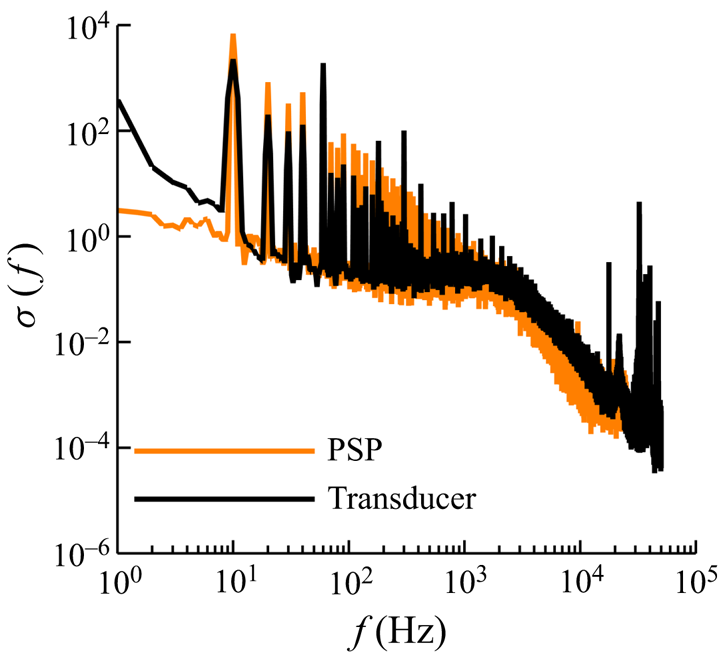
It should be remarked that the purpose of the PSD comparisons made in figure 2 is to determine the cutoff frequency above which the PSD attenuation is higher than the 6 dB threshold. The slightly increase PSD from the pressure sensitive paint is a combination of the transducer location not matching the jet centreline and the electronic noise from the camera pixels that were not fully removed during post-processing (pixel binning). As such, this discrepancy will not affect the quantification of the paint cutoff frequency, which was the central objective of figure 2. Furthermore, the remarkable adherence of the PSD from the transducer and transducer lends confidence on the application of the high-bandwidth PSP to study the fin SBLI dynamics. As mentioned in the literature, this is one of the first works where the PSP-based pressure fields have been investigated extensively to study the drivers of fin SBLI dynamics.
The pressure fluctuations at frequency exceeding 10 kHz will be measured with questionable accuracy as shown in figure 2. However, the pressure fluctuations beneath the separation region and, in fact, the entire flow will span frequencies that substantially exceed the 10-kHz threshold. However, the focus of the present work is restricted to the mid-frequency oscillations of the fin SBLI (Gaitonde & Adler Reference Gaitonde and Adler2023), which has the dominant strength in the separation shock motions, and the causative agents of the mid-frequency oscillations. The mid-frequency oscillations occur below the 10-kHz threshold, which is adequately captured by the PSP measurements.
The illumination of the cylinder surface was made using two 10-W water-cooled ultraviolet (UV) lamps, and the paint fluorescence was collected using a sCMOS camera (Phantom Inc., model Nova S16) fitted with a Nikon  $f$/1.4 85-mm lens and a 590-nm long-pass filter. The resulting digital spatial resolution of the images was
 $\approx$0.2 mm pixel
 $^{-1}$. The data reduction from the raw fluorescence images to pressure fields started with background subtraction of any residual scattering from the model. This was followed by normalisation of the resultant images with a reference ‘wind off’ image that was obtained at 1 atm and 300 K without the wind tunnel flow. Two different redundant approaches were employed for calibration. First, the calibration were performed in a pressure-controlled chamber maintained at 300 K; this approach provided an excellent control on the setpoint pressures but could not account for the minor decrease (
 $\approx$3 K) in test article surface temperature during the test run. Second, the calibration was performed with the mean pressure fields over the same test article covering the same field of view obtained using a low-bandwidth commercial PSP. The differences in the calibration constants of the linear pressure mapping between the two approaches was
 $5\,\%$. Finally, the calibrated pressure fields were binned
 $3\times 3$ pixels following Varigonda & Narayanaswamy (Reference Varigonda and Narayanaswamy2021) and Funderburk & Narayanaswamy (Reference Funderburk and Narayanaswamy2019b) to provide the best signal-to-noise ratio of the pressure fields without affecting the dynamic content of the pressure field. The resulting digital spatial resolution of the pressure fields was
 $0.61$ mm per binned pixel.
3. Results and discussion
3.1. SBLI mean and r.m.s. pressure field
Figure 3(a) presents the mean surface streakline visualisation field over the cylinder surface. Two distinct loci of streakline convergence can be identified, which correspond to the primary separation, S1, and secondary separation, S2. A locus of streakline divergence can be identified in the vicinity of the fin root, which corresponds to the primary reattachment, R1. As such, the streakline pattern does not divulge the locus of the secondary reattachment. It should be noted that whereas identification of the reattachment locus has been challenging, the delineation of the primary and secondary separation loci could be made without much uncertainty. Furthermore, it should be remarked that the traditional definition of the inception region used in the planar fin SBLI is the extent over which the quasi-conical symmetry. This definition cannot be applied in this unit. because, when the fin is mounted on a curved base, as it is done in this work, the quasi-conical symmetry is no longer established (see Pickles et al. Reference Pickles, Mettu, Subbareddy and Narayanaswamy2019). Therefore, a delineation of the inception region could not be made using the surface streakline fields; an alternate definition using the surface pressure fluctuation PSD is provided in the subsequent sections.
Characterisation of the mean streakline field over the cylinder surface (a), mean surface pressure (b) and the corresponding r.m.s. pressure normalised by mean pressure,  $p_{r.m.s.}/p_w$ (c).

Figure 3(b) presents the mean pressure field obtained by averaging 40 000 instantaneous realisations; the S1, S2 and R1 loci discerned from the surface streakline visualisation field are overlaid on the mean pressure field. The primary separation locus, S1, occurs considerably inboard of the pressure rise onset, and the surface pressure at separation is consistent with the free interaction theory, as demonstrated by Pickles et al. (Reference Pickles, Mettu, Subbareddy and Narayanaswamy2019). The secondary separation locus S2 occurs within the plateau pressure region inboard of S1. The mean pressure exhibits a monotonic increase inboard of S2 and reaches a peak adjacent to the fin root. This fin root region anchors the secondary flow that develop along the junction formed between the fin and the mounting cylinder surface. The primary reattachment R1 occurs outboard of this elevated pressure at the fin region.
The corresponding r.m.s. pressure fields normalised by the local surface pressure  $p_w$ is presented in figure 3(c). The S1, S2 and R1 loci from figure 3(a) are overlaid on figure 3(c). The
 $p_{r.m.s.}/p_w$ fields reveal three prominent bands of elevated magnitudes. The most outboard band of elevated
 $p_{r.m.s.}/p_w$ occurs in the intermittent region of the SBLI over which the separation shock foot oscillates (henceforth called the ‘intermittent region band’ or ‘IR band’). The next elevated
 $p_{r.m.s.}/p_w$ band inboard of the IR band occurs within the separation vortex and coincides with the S2 locus (henceforth called the ‘separation vortex band’ or ‘SV band’). The most inboard elevated
 $p_{r.m.s.}/p_w$ band is located adjacent to the fin root (henceforth called the ‘fin root band’ or ‘FR band’). Interestingly, the outboard edge of this band coincides with the R1 locus based on the surface streakline imagery.
The downstream evolution of the mean and r.m.s. pressure fields reveals the effect of the 3-D relief on the pressure fields. Pickles et al. (Reference Pickles, Mettu, Subbareddy and Narayanaswamy2019) noted that the 3-D relief offered by the mounting cylindrical surface to the flowfield significantly weakened the separation shock with downstream distance. This weakening results in the notable decrease in the mean pressure within the entire SBLI along the downstream distance, as observed in figure 3(b). In addition, a reduced growth rate of the separation vortex was observed by Pickles et al. (Reference Pickles, Mettu, Subbareddy and Narayanaswamy2019), which is also consistent with figure 3(a). The downstream evolution of the different  $p_{r.m.s.}/p_w$ bands in figure 3(c) reveals the effect of separation shock weakening due to 3-D relief on SBLI dynamics. The SV band shows an increase in its peak value by about 10 % along the downstream distance within the measurement domain; this provides evidence of only a modest effect of 3-D relief on these band. Similarly, the strength of the FR band remains nearly unchanged along the downstream distance of the fin root. By contrast, the IR band exhibits a substantial decrease in its peak value along the outboard direction. The reduction in intermittent band strength is consistent with the progressive weakening of the mean separation shock due to 3-D relief.
3.2. PSD at different SBLI bands
The PSD of the surface pressure fluctuations are now studied to reveal the spectral content of the pressure fluctuations at various locations within the SBLI unit. Welch's algorithm was employed to compute the PSD and a 1024 sample Hanning window with 50 % overlap was employed while computing the PSD following the recommendations of Varigonda & Narayanaswamy (Reference Varigonda and Narayanaswamy2021). This resulted in a frequency resolution  $\Delta f \approx 19.4$ Hz in the PSD. This frequency resolution was sufficient to delineate the PSD across the entire SBLI with acceptable noise within the PSD.
First, representative PSDs of the IR, SV and FR bands were investigated. Figure 4(a) shows the frequency premultiplied PSDs obtained at the peak  $p_{r.m.s.}$ location of the IR, SV and FR bands; the PSDs are normalised by
 $p_\infty ^2$. The PSDs presented were obtained along the fin-normal direction,
 $s_n$ (see figure 3c), for a fixed
 $x_f = 8$ mm (
 $x_f$ measured along the fin root with origin at the fin leading edge), which is sufficiently downstream of the initial development region of the SBLI. The IR band PSD was multiplied by a factor of 50 to match the PSD magnitudes of the other two bands. It can be observed that the PSD of the IR band, which corresponds to the separation shock oscillations, is broadband and aperiodic, which is consistent with the literature on separation shock oscillation. Within the broadband spectrum, three distinct frequency bands can be observed. The low-frequency band, following the definition of Adler & Gaitonde (Reference Adler and Gaitonde2020) and Gaitonde & Adler (Reference Gaitonde and Adler2023), occurs between
 $\sim$50 and 500 Hz (
 $St_\delta < 0.005$) and peaks at 200 Hz (
 $St_\delta = 0.002$). The low-frequency band is followed by the mid-frequency band that occurs in the range
 $1\ {\rm kHz} < f < 10\ {\rm kHz}$ (
 $St_\delta \approx 0.01\unicode{x2013}0.1$) and peaks at 5 kHz (
 $St_\delta \approx 0.05$), again adhering to the definition of Adler & Gaitonde (Reference Adler and Gaitonde2020). For the location presented, the strength of the mid-frequency band is considerably higher than the low-frequency band. However, a more complex variation of their relative strengths was observed as one traverses along the IR band; this is presented in the following section. The mid-frequency band is followed by a high-frequency band starting from 10 kHz (
 $St_\delta > 0.1$); this band corresponds to the separation shock foot jitter caused by the propagation of the turbulent boundary layer structures through the separation shock. While the limitations in the Nyquist frequency and the PSP's spectral attenuation preclude the determination of the peak of the high-frequency band, it has been reported to coincide with the characteristic frequency of upstream boundary layer fluctuations,
 $U_\infty / \delta _{99}$ (Erengil & Dolling Reference Erengil and Dolling1991).
Comparison of the frequency premultiplied PSD over the IR, SV and FR bands measured at a fixed  $x_f = 8$ mm (a), and the evolution of the frequency premultiplied PSD along the fin normal direction at a fixed
 $x_f = 8$ mm (b) and
 $x_f = 16.5$ mm (c). The region between S1 and S2 that exhibits a linear shift in the PSD is annotated by an arrow in (b) and (c).

The PSD of the SV band also exhibits a broadband aperiodic spectrum similar to the IR band. The PSD exhibits a peak at  $f \approx 6$ kHz that strongly overlaps with the peak of the mid-frequency band of the IR band. This PSD peak is followed by a minimum at around 10 kHz and a subsequent PSD elevation corresponding to the high-frequency band. In contrast to the IR band, the SV band is devoid of PSD maximum at
 $f \sim 100$ Hz that corresponded to the low-frequency band. The PSD beneath the FR band exhibits a broadband oscillation that is prominent between 50 and 500 Hz. The dominance of oscillations at frequencies that are considerably smaller than the separation shock oscillations was also identified in the fin/plate junction region by Garg & Settles (Reference Garg and Settles1996). A relative plateau in PSD was observed in the mid-frequency range whose amplitude is considerably lower than the low-frequency band. Despite the lower relative magnitude, the PSD strength of the FR band in the mid-frequency range is still greater than that of the SV band.
Now the PSD of the regions in between the different  $p_{r.m.s.}/p_w$ bands and the upstream boundary layer are investigated. Figure 4(b) presents the PSD evolution along the fin-normal direction obtained at
 $x_f = 8$ mm; the extents of the different
 $p_{r.m.s.}/p_w$ bands are annotated in the figure 4(b). The logarithm of frequency is plotted to emphasise the spectral separation of the different frequency bands; furthermore, the PSDs are normalised by the
 $p_{r.m.s.}^2$ to delineate the relative contributions at the different frequencies. Each data point in the PSD is an average over a
 $1\ {\rm mm} \times 1\ {\rm mm}$ region that surrounded the measurement location. The upstream boundary layer occurs at
 $s_n > 20$ mm and the corresponding PSD exhibits a monotonic increase with frequency. The peak frequency of the PSD occurs at
 $u_\infty /\delta _{99} \approx 100$ kHz that significantly exceeds the Nyquist limit of the present measurements. Inboard of IR band is the separation vortex that nominally emanates from the mean primary separation S1 located at
 $s_n \approx 12$ mm. Following the 2-D SBLI literature (e.g. Chandola et al. Reference Chandola, Huang and Estruch-Samper2017), the pressure fluctuations in the separation region are dominated by the detached turbulent eddies that propagate over the shear layer formed above the separation vortex. The broadband peaks of the IR band are absent and, instead, the PSD exhibits a monotonic increase with frequency. The peak frequency of the PSD is above the Nyquist limit and is not captured in the present measurements. It can be observed that the PSD, between the IR and SV band, first shifts to higher frequencies with increasing distance from IR band until
 $s_n \approx 12$ mm where the S1 is located. Between S1 and SV, the PSD monotonically shifts to lower frequencies as one approaches the SV band. The PSD shift to lower frequencies between S1 and SV band is attributed to the growing size of the turbulent eddies over the separation vortex as these eddies convect over the separation vortex (Chandola et al. Reference Chandola, Huang and Estruch-Samper2017). The near-linear shift in the isocontours of the PSD and the self-similarity of the PSD shapes suggests that the growth of the eddies is nearly linear, which is also consistent with the observations made by in 2-D SBLI units.
Just outboard of the FR band lies the primary reattachment location R1 at  $s_n \approx 3$ mm. The PSD in this region appears very similar to the SV band PSD; however, the peak frequency has shifted to slightly higher frequency compared with the SV band. It is also notable that the distance between the SV band and FR band at this location is rather small (
 $\approx$3 mm), which raises the possibility of the reattachment region PSD being contaminated by the dynamics of the junction boundary layer at the fin root (also noted by Garg & Settles Reference Garg and Settles1996) and/or the SV band. To address this possibility, the PSD evolution was also obtained at
 $x_f = 16.5$ mm, shown in figure 4(c), where the distance between the SV and FR band was 6 mm, which avoids the influence of the SV band on the reattachment region PSD. A monotonic near-linear shift in PSD to higher frequencies is observed with increasing distance from the SV band in the inboard direction towards the fin root, and the peak frequency in the reattachment location was nearly twice that of the SV band. Thus, a rather complicated trend in the PSD is observed within the separation vortex that is noticeably different from a 2-D separation bubble. Whereas the PSD shift to lower frequencies between S1 and SV band can be explained based on the previous observations of the 2-D SBLI, the opposite spectral trend between SV band and R1 cannot be explained at present.
Overall, notable similarities and significant differences were observed in the PSD of the pressure fluctuations at various locations with the fin SBLI compared with the canonical 2-D SBLIs. Interestingly, the low- and mid-frequency bands of the separation shock motions directly overlap with the PSD of the FR and SV regions, respectively, which suggests a possible dynamical link between these locations at these frequencies. Such a strong overlap was not documented in the 2-D SBLIs. Subsequent sections will investigate whether this link persists across the entire streamwise distance of the SBLI before delving deeper into the driving interactions of the separation shock motions.
3.3. Downstream evolution of PSD
The PSD of the IR, SV and FR bands were individually tracked along their locus to determine their downstream evolution along the SBLI unit. The PSDs are normalised by the respective variance of the pressure fluctuations to emphasise the relative magnitude of the different frequency bands along the locus. Figure 5(a–c) present the PSD evolution of the IR, SV and FR bands corresponding to the peak  $p_{r.m.s.}$ locations. The origin of the locus for a given band corresponds to the intersection of the fin-normal ray emanating from the fin leading edge and the corresponding band (see figure 3c). Figure 5(a) shows that the IR band PSD at
 $s_{IR} < -5$ mm carries the low- and mid-frequency band with nearly equal strengths. In the range
 $-5\ {\rm mm} < s_{IR} < +3\ {\rm mm}$, the low-frequency band grows to dominate the PSD when compared with the mid-frequency band. It should be noted that the mid-frequency band still makes a sizable contribution to the PSD in spite of being weaker than the low-frequency band. The prominence of the different frequency bands changes beyond
 $s_{IR} > +3$ mm as the low-frequency band rapidly loses its strength and the mid-frequency band becomes the dominant feature of the PSD.
Evolution of the frequency premultiplied PSD, normalised by  $p_\infty ^2$, along the locus of (a) IR band, (b) SV band and (c) FR band. (d) Evolution of the intermittent length scale
 $L_i$ along the IR band.

The peak and the spectral extent of the low-frequency oscillations of the IR band PSD remain relatively constant over  $s_{IR} \leq 0$ mm revealing that the separation shock dynamics at this frequency range is unchanged over its length. The corresponding values of the mid-frequency band also remains unchanged until
 $s_{IR} < 15$ mm and subsequently exhibits a nearly linear decrease in the peak frequency with downstream distance. It is interesting to note that the circumferential distance between the S1 and R1, which quantitatively relates to the length scale of the separation vortex, increased by over 100
 $\%$ over the distance
 $0\ {\rm mm} < s_{IR} < 15\ {\rm mm}$; however, the mid-frequency band remains unchanged in its spectral content. Therefore, the separation shock oscillations do not correspond to the mean local scales of the separation vortex; this is in contrast to the 2-D SBLI studies that exhibit a direct correspondence between the separation bubble length scale and the separation shock PSD. This constancy of the IR band PSD also shows that the length scale based on the local separation size is not appropriate to scale the separation shock oscillation frequency, in agreement with the previous works of Vanstone et al. (Reference Vanstone, Musta, Seckin and Clemens2018) and Adler & Gaitonde (Reference Adler and Gaitonde2019).
The PSD evolution of the SV band presented in figure 5(b) reveals that the PSD is dominated by the low- and mid-frequency band over  $s_{SV} < 0$ mm. In this region, the separation vortex is at its incipient stage and the overall SBLI differs strongly from glancing shock interactions. The SV band PSD rapid evolves over
 $-2\ {\rm mm} < s_{SV} < 2\ {\rm mm}$ and beyond
 $s_{SV} > 2$ mm the PSD is dominated by the mid-frequency band oscillations. A modest shift of PSD to slightly lower frequency was observed over
 $4\ {\rm mm} < s_{SV} < 7\ {\rm mm}$ after which the PSD remains almost unchanged over a majority of the measurement region until
 $s_{SV} < 25$ mm. A modest spectral shift in the PSD to lower frequency was observed over
 $25\ {\rm mm} < s_{SV} < 30\ {\rm mm}$. Thus, there is a remarkable coincidence in the mid-frequency range between the SV and IR band that extends over a major fraction of the measured distance. This reinforces the suggested dynamic link between these two bands at the mid-frequency range.
The PSD evolution of the FR band presented in figure 5(c) shows the presence of both low- and mid-frequency bands over  $s_{FR} < 0$ mm. Similar to the SV band, the FR band PSD undergoes sharp changes over
 $-4\ {\rm mm} < s_{FR} < 2\ {\rm mm}$ and at
 $s_{FR} > 2\ {\rm mm}$ the PSD is dominated by the low-frequency band oscillations. Interestingly, a notable presence of the mid-frequency band can also be seen until
 $s_{FR} < 8$ mm and this band rapidly decreases to zero by
 $s_{FR} \approx 9$ mm. Beyond
 $s_{FR} > 9$ mm, only the low frequency persists until the end of the measurement domain. This remarkable coincidence of the IR and FR band at low frequencies again reinforces the suggested dynamic link between these two bands at the low-frequency range.
Overall, the PSD evolution can be grouped into three distinct zones: the inception zone that extends up to a few millimetres downstream of the fin leading edge, the near-constant PSD zone that extends over the majority of the SBLI and the trailing zone where gradual changes in the PSDs are observed. The authors note an overlap in the usage of the term ‘inception zone/region’ with the literature on fin SBLI. In the fin SBLI literature, where all the works had a fin on planar surfaces, the term inception region was meant to represent the region downstream of the fin leading edge where the quasi-conical symmetry has not yet been established (Settles & Lu Reference Settles and Lu1985). The presence of a curved mounting surface in the present work precludes the quasi-conical symmetry in this SBLI unit (see Pickles et al. Reference Pickles, Mettu, Subbareddy and Narayanaswamy2019). As a result, the inception region in the present study denotes only the early developmental region of the fin SBLI surrounding the fin leading edge the precedes the near-constant PSD zone.
The PSD evolution within the different zones exhibits several interesting complexities that challenge our knowledge on the drivers of the separation shock pulsations in the fin SBLI units. First, the inapplicability of the local separation scale to obtain a consistent Strouhal number of the separation shock pulsations, in contrast to 2-D SBLI, leads us to question the relevance and dominance of the local separation vortex pulsations towards driving the separation shock oscillations. However, the frequency overlap between the SV band, FR band and the separation shock points to a strong coupling between the separation vortex dynamics and the separation shock motions. This is further confirmed by the coherence fields of figure 6(a,b) that present the coherence magnitude in the mid-frequency range ( $1\ {\rm kHz} \leq f \leq 8\ {\rm kHz}$) and low-frequency range (
 $\,f < 0.6$ kHz), respectively. These maps show a clear predominance of the SV band in the mid-frequency range and a nearly equal coupling of SV and FR band in the low-frequency range. Second, the near-constant IR band mid-frequency spectral peak is also accompanied by near-constant intermittent region extent (
 $L_i$) along the length of the IR band within the measurement resolution limitations, as presented in figure 5(d). By thresholding the
 $p_{r.m.s.}/p_w$ to 50 % of peak, the
 $L_i$ along the IR band was determined to be
 $2.5\ {\rm mm} \pm 0.6\ {\rm mm}$. Unfortunately, the limitations in the spatial resolution of (
 $0.61$ mm per binned pixel) limits making finer resolution estimate of the intermittent region length. The constancy of the
 $L_i$ and
 $St_\delta$ suggests that the separation shock executes linear oscillations instead of angular sweeps. The
 $L_i$ and peak frequency of mid-frequency band also yields the nominal shock foot velocity,
 $v_s = 2\times L_i\times f$, which is calculated to be
 $0.034 \times u_\infty$; this value is in excellent agreement with the prior shock foot speeds on fin SBLI documented by Gonsalez & Dolling (Reference Gonsalez and Dolling1993). At this point, it is not clear whether the linear motions of the separation shock executes represent bulk oscillations that were observed in 2-D SBLIs or local undulations in response to outboard propagating finite size perturbations.
Coherence map of the pressure fluctuations within the SBLI unit in the mid-frequency range (a) and low-frequency range (b). The reference location was located within the IR band and is annotated in the figures.

At this juncture, it is important to point out that the separated flow of canonical 2-D SBLI exhibit substantial strength in the mid frequency. However, a close survey of the wall pressure fluctuation PSDs of 2-D SBLI units reveal that a dominant elevation in the PSD surrounding  $St_\delta \approx 0.1$ (observed as a broad hump in the frequency-premultiplied PSD of figures 4 and 5b) are not present in 2-D SBLIs. Instead, the (frequency-premultiplied) PSDs exhibit a monotonic increase that ultimately peaks at the eddy turnover frequency of the shear layers that develop over the separation bubble, which far exceed the
 $St_\delta \sim 0.1$ range. Therefore, there is indeed an overlap in the PSD of the separation bubble in 2-D SBLIs, the dominance of the PSD strength in the mid-frequency range that is observed beneath the separation vortex of the fin SBLI is absent in 2-D SBLI.
3.4. Instantaneous pressure fields
The time-correlated instantaneous pressure fluctuation fields are presented in this section to obtain a general picture of the structure and propagation of pressure perturbations within the SBLI unit. The pressure fluctuations are normalised by the local mean pressure,  $p_w$, to bring the pressure excursions over the entire measurement region within the same order of magnitude. The ensemble-averaged mean separation shock location was obtained using a pressure threshold of Poggie & Porter (Reference Poggie and Porter2019) spanning over 20 000 instantaneous fields and is shown as white line contours in each figure. The instantaneous separation shock location obtained using the same pressure threshold is shown as black line contours in each figure. Note that the thresholding procedures result in spurious delineation of the separation shock towards the downstream end of the measurement domain (
 $x \geq +10$ mm) and these delineations are ignored from the discussions.
Representative pressure fluctuation entities are identified in figure 7 to illustrate the overall features and behaviour of the pressure fluctuations in different regions of the SBLI unit. Supplementary movie 1 available at https://doi.org/10.1017/jfm.2024.966 presents the pressure fluctuation sequence over 5 ms duration from which figure 7 was extracted. The entity ‘A’ is a negative pressure fluctuation blob upstream of the fin leading edge where the IR band originates. The occurrence of the negative pressure fluctuation in the IR band corresponds to the local downstream displacement of the separation shock compared with its mean location. An increasing length of the separation shock can be observed to displace downstream between  $0\ {\rm ms} \leq \tau \leq 0.075\ {\rm ms}$ by comparing the black and white line contours in each of figures 7(a)–(d). At
 $\tau = 0.075$ ms the entire separation shock is displaced downstream. At this time, the negative fluctuation upstream of the fin leading edge is replaced by a positive pressure fluctuation (upstream displacement of separation shock) and the positive pressure fluctuation grows within the incipient region until
 $\tau = 0.125$ ms, as seen from figures 7(d)–(f). Interestingly, this positive fluctuation band can be observed to merge with the SV band and only leaves a weak fluctuation within the IR region. Therefore, the pressure fluctuation kernels (i.e. modulations to the separation shock) that emanate from upstream of the fin leading edge can affect either the IR and/or the SV band dynamics.
Time-correlated evolution of the instantaneous pressure fluctuation field within the SBLI unit extending from the incoming boundary layer: (a)  $\tau = 0$ ms, (b)
 $\tau = 0.025$ ms, (c)
 $\tau = 0.05$ ms, (d)
 $\tau = 0.075$ ms, (e)
 $\tau = 0.1$ ms and (f)
 $\tau = 0.125$ ms. Each frame is separated from the preceding frame by 0.025 ms. Distinct pressure fluctuation structures are annotated in each figure. The ensemble-averaged mean separation shock location using a pressure threshold of Poggie & Porter (Reference Poggie and Porter2019) is shown as while line contours in each figure. The instantaneous separation shock location using the same pressure threshold is shown as black line contours in each figure.

The entity ‘B’ identified in figure 7(a) is a positive pressure fluctuation streak adjacent to the fin root just downstream of the fin leading edge. This structure exhibits growth along fin-normal direction to merge with another structure in the SV band, as observed in figure 7(b). The resulting blobby structure maintains its shape between figure 7(b,c) and subsequently grows along the local flow direction (delineated from the surface streakline patterns) of the SV band between figure 7(d–f) to form an elongated streak. This streak also gets connected to the pressure fluctuations originating at the fin leading edge in figure 7(d–f). This entity serves to present multiple evolution pathways a pressure fluctuation kernel within the separated region can take.
The entity ‘C’ is a fragment of pressure fluctuation structure in the SV band that convects along the local flow direction without much shape change. Such structures were found all over the separated flow region. Entity ‘D’ is a pressure fluctuation structure that is adjacent to the fin root. In contrast to other entities, this structure persists at the fin root over a long time period without much change in its topology (see figure 7a–e). This entity appears to grow by spreading in the upstream direction along the fin root towards the end of the sequence. Several such instances of upstream growth of the pressure fluctuation streaks along the fin root were observed over the entire sequence presented in supplementary movie 1. Another streaky entity ‘E’ occurs in the reattachment region (see figure 7a–d). This entity shrinks in its size as the trailing edge of the streak convects along the local flow direction. This entity can also be observed to fragment in figure 7(c,d) and the fragmented structure convects along the local flow direction between figure 7(c,d) and leaves the measurement domain in figure 7(e). A significant majority of the instantaneous realisations presented in supplementary movie 1 exhibited alternating (positive and negative  $p'$) elongated structures such as in figure 7(e).
The boundary layer pressure perturbations observed in figure 7 are highly chaotic. This chaotic appearance, despite the reported streamwise and spanwise coherence of the near-wall turbulent boundary layer structures, is due to the limited sensitivity of the pressure sensitive paint and a non-trivial electronic noise that mask the minute pressure fluctuations emanating from these coherent vortices. However, Jenquin et al. (Reference Jenquin, Johnson and Narayanaswamy2023) demonstrated that the boundary layer exhibited occasional pressure modulations that were present over the entire measurement domain; this modulation was extracted in their work through conditional averaging of pressure fluctuation fields. Although the role of the boundary layer towards influencing the glancing separation shock is detailed in subsequent sections, figures 8(a) and (b) present a few instances where the majority of the upstream boundary layer was engulfed in strong positive and negative pressure fluctuations, respectively. It is apparent that at these instances the entire separated flow is swamped by the pervasive positive and negative fluctuations within the entire separated flow and pressure fluctuations with opposite sign in the IR band. This suggests a possible role of the incoming boundary layers towards driving the fin SBLI; note that a strong influence of the incoming boundary layer momentum fluctuations towards driving the mid-frequency unsteadiness of the swept ramp SBLI was reported in Vanstone et al. (Reference Vanstone, Musta, Saleem, Seckin and Clemens2016).
Pressure fluctuation fields within the SBLI at select time instances where the majority of the upstream boundary layer is engulfed in strong positive (a) and negative pressure fluctuations (b).

We note that both figures 7 and 8 are select samples to illustrate some of the broad qualitative trends in the dynamic evolution of the correlated pressure structures within the fin SBLI. In these select instantaneous pressure fields provided, the regions farther upstream within the boundary layer appear to be more correlated to the separation shock motions. However, the detailed statistical correlations presented subsequently in figures 9 and 10, which make a more accurate representation of the collective trends do not reveal this enhanced correlation at the locations further upstream of the incoming boundary layer and the intermittent region pressure fluctuations.
Zero-delay correlation field within the SBLI unit for the reference location within (a) IR and (b,c) two locations within the FR band. The reference location is marked with a grey circle.

Zero-delay correlation field within the SBLI unit for the reference location within the SV band at increasing downstream distance along the SV band. The reference location is marked with a grey circle.

Overall, multiple mechanisms appear to be active in the present unit and their relative dominance/role towards driving the separation shock pulsations is as yet unknown. Interestingly, the separation shock foot exhibits local displacements that bear significant resemblance to the spanwise wrinkling of a 2-D SBLI. These local perturbations convect along the length of the separation shock, which again resembles the spanwise propagation of the shock wrinkle in swept interactions presented by (Vanstone et al. Reference Vanstone, Musta, Saleem, Seckin and Clemens2016, Reference Vanstone, Musta, Seckin and Clemens2018). All the pressure fluctuation structures within the SBLI exhibited dominant convection along the local flow direction within the separation unit, suggesting the active role of convective instabilities towards driving the separation shock pulsations. A few realisations demonstrated fin normal propagation/growth of the pressure fluctuation structures (e.g. entity ‘B’ in figure 7), which is characteristic of the breathing motions of the separation vortex (Clemens & Narayanaswamy Reference Clemens and Narayanaswamy2014). Interestingly, the convective motions appear to originate around the inception region in a significant fraction of the individual sequences. Furthermore, the global excursions in the boundary layer momentum appear to have an influence on the instantaneous fin SBLI structure, and keeps open the local influence of the boundary layer structure on the separation shock dynamics. The following sections employ statistical methods to explore how these different sources and mechanisms interact with one another to yield the observed separation shock motions.
3.5. Zero-lag cross-correlation
Two-point correlation of the pressure fluctuations was computed between reference locations at the different bands of elevated  $p_{r.m.s.}/p_w$ and other locations within the measurement domain. Standard definition of the cross-correlation was employed, wherein the correlation coefficient at a given location
 $(x,z)$ and delay (
 $\tau$) is given by
 \begin{equation} {\rm Corr}(x,z,\tau) = \frac{\sum_{t_k}{p'(x,z,t_k+\tau) \times p'(x_{ref},z_{ref},t_k)}}{p_{r.m.s.}(x,z)\times p_{r.m.s.}(x_{ref},z_{ref})}. \end{equation}
In the present work, the correlation coefficients were collected by using sample windows each containing 1000 samples and with  $50\,\%$ overlap between successive windows. An average of
 ${\rm Corr}(x,z,\tau )$ over 40 such windows are obtained for the analysis presented in this and subsequent sections. The typical r.m.s. spread in the correlation coefficient over the 40 sampled windows was
 $0.05$.
Zero-lag cross-correlation fields provide information about the instantaneously correlated regions of the SBLI unit for a given reference location. Figure 9(a) presents the correlation fields for the reference location situated beneath the IR band within the near-constant PSD zone. The correlation field exhibits a banded structure within the SBLI where alternating positive and negative correlation bands are observed along the azimuthal direction. Mapping the trends over different SBLI entities, a strong positive correlation is observed over the entire IR band suggesting a highly coupled separation shock motion along its length. Further inboard, a modest negative correlation was observed in the vicinity of S1 as well as the reattachment region including the fin root region (FR band). The negative cross-correlations beneath the separation and reattachment loci were also observed in 2-D SBLI units. Specifically, the negative correlation between the separation and reattachment shocks reveals a breathing motion of the separation vortex that drives the separation and reattachment shocks in an antiphase manner. A sharp positive correlation is observed in the SV band that lies beneath the S2 locus. This positive correlation band contrasts the 2-D SBLI unit where the entire separated flow including the reattachment region exhibited a negative correlation. All the correlation bands have an elongated appearance illustrating the prominence of convective motions of the pressure perturbations that was prevalent in the instantaneous realisations. Interestingly, all the correlation bands in figure 9(a) terminate at  $s \approx 3$ mm; this highlights a possible mitigation in the influence of the pressure dynamics in the inception region.
Figure 9(a) also reveals that the separation shock motions exhibit a modest correlation with the upstream boundary layer pressure fluctuations. A marginal positive correlation ( $\approx$0.1) was observed with the upstream boundary layer over the entire measurement domain. This correlation exhibits a slight increase to approximately
 $0.2$ at the circumferential location surrounding the reference location (
 $10\ {\rm mm}< s<20\ {\rm mm}$). This provides evidence that the direct influence of the boundary layer towards driving the separation shock motions is modest, and resembles the similar weak influence observed in 2-D SBLI units with large mean separation scale. An important contrast with the 2-D SBLI is that the sign of the cross-correlation is positive in the present unit whereas that in 2-D SBLI is negative. A negative cross-correlation is what would be expected from the incoming boundary layer since a positive momentum fluctuation (
 $p'$ positive) within the upstream boundary layer will displace the separation shock downstream resulting in a negative
 $p'$. The observed opposite trend shows that the direct influence of the boundary layer is probably overwhelmed by the other sources that mask the actual negative correlation.
Figure 9(b,c) present the zero-lag cross-correlation field with the reference locations beneath the FR band located downstream of the inception region (figure 9b) and within the inception region where the PSD exhibited both low- and mid-frequency range fluctuations (figure 9c). Both the correlation maps exhibit a banded structure that bear a close similarity with figure 9(a). A notable contrast is a significantly elevated correlation with the upstream boundary layer ( $\approx$0.3) at the fin leading edge circumferential location for the reference locations considered in figure 9(b,c). This shows that a substantial portion of the pressure fluctuations in the FR band is driven by the boundary layer structures that enter the SBLI at the fin leading edge and convect along the fin root. Interestingly, for the reference location away from the inception region in figure 9(b), the positive correlation within the FR band tapers rapidly as one approaches the fin leading edge (
 $x<4$ mm). By contrast, there is a significant correlation within the SBLI unit in the inception region for the reference location close to the fin leading edge (figure 9c); however, this correlation notably decreases downstream along the fin root over
 $x>10$ mm. Furthermore, the peak correlation location in the SV band is significantly upstream of the fin-normal intersection location of the reference location and the SV band for both figure 9(b,c). The upstream occurrence of the peak correlation location in the SV band possibly suggests that the pressure fluctuation in the FR band at a given location may be impacted by the perturbations that originated somewhere upstream within the SV band. This hypothesis will be tested in the subsequent sections.
The zero-lag cross-correlation fields with the reference location along the SV band are presented next. The chosen locations for the figure 10(a,b) lie in the near-constant PSD zone whereas that for figure 10(c) lies in the trailing zone of the SBLI. Figure 10(a) shows that the region of elevated positive correlation extends along the length of the SV band surrounding the reference location. Interestingly, the positively correlated region extends from the SV band through several boundary layer thicknesses in the upstream boundary layer, and likely extends beyond the measurement domain in the negative  $x$-direction. Thus, a well-defined band of elevated positive correlation is observed in the upstream boundary layer at a circumferential location inboard of the reference location. This positively correlated band cuts through the IR band, instead of bypassing the IR band as was observed in 2-D SBLI literature, and splits the negatively correlated regions of the IR band into two parts. This rather strong influence of the boundary layer fluctuations on the SV band explains the positive correlation that was earlier observed between the upstream boundary layer and the separation shock. Tracking the same positively correlated band reveals that this band makes an outboard turn of approximately
 $12^\circ$ after it crosses the IR band to reach the reference location. Interestingly, the track of the positively correlated band from the upstream boundary layer is nearly identical to the streakline track of the flowfield generated by a vortex generator obtained by Pickles & Narayanaswamy (Reference Pickles and Narayanaswamy2020) as the inflow propagated through this fin SBLI unit. A nearly identical track but a noticeably lower positive correlation magnitude was observed when the reference location was located further along the SV band in figure 10(b). These observations strongly suggest that the upstream boundary layer makes non-trivial contributions to the pressure fluctuations in the SV band.
Coming to the IR band in figure 10(a,b) a clear negative correlation is observed between the IR band on either side of the positive correlation channel. It is noteworthy that the location of the peak negative correlation in the IR band occurs upstream of the vector along the fin normal direction originating from the reference location. Furthermore, the correlation magnitude is much stronger downstream of the peak correlation location compared with upstream of the peak correlation location. Another interesting region of positive correlation occurs in the reattachment region where the location of the peak correlation occurs downstream of the fin normal projection of the reference location on the reattachment region. This is most evident in figure 10(a), where the yellow isocontour within the reattachment region occurs considerably further along the fin length compared with the reference location. By contrast, all the regions upstream of the fin normal projection of the reference location exhibit a noticeably lower correlation. This suggests that strongest propagation of the pressure fluctuations occur from the SV band to downstream locations of the reattachment region. Both figure 10(a) and (b) reveal only a modest correlation with the FR band as well as the SBLI region in the vicinity of the fin leading edge.
For the reference location at the trailing zone of the SV band, the overall correlations are maintained qualitatively. However, the distinct positive correlation with the upstream boundary layer and the positive correlation with the reattachment region are absent entirely. Furthermore, the negative correlation with the IR band is also noticeably weaker and nearly a zero correlation was observed in the FR band as well as in the vicinity of the fin leading edge. This alludes to a possible shift in the influences at the trailing zone of the SV band, which is possibly an artifact of the 3-D relief effect that weakens the local separation strength.
3.6. Cross-correlation lag analysis
With knowledge of the key regions that exhibit strong correlations within the SBLI, we turn our attention to probing with locations that lead and lag in terms of the pressure perturbations. Figure 11 presents the time delay corresponding to the peak absolute correlation for a given reference location. Figure 11 also shows the two-point cross-correlation coefficient as line contours and the region of absolute correlation coefficient below 0.1 has been clipped to highlight only the moderate to strongly correlated locations.
Peak lag field of the SBLI with respect to a reference location in the SV band at the near-constant PSD region (a) and the inception region (b). Line contours of the cross-correlation coefficient is overlaid in each figure. Arrows that illustrate the propagation of the surface pressure perturbations are marked. Whereas the black arrows denote the convective instabilities, the white arrows denote the perturbation due to separation vortex breathing. Line plots of select locations within the SV band and IR band of (a) are presented in (c) and (d), respectively. The legend denotes the coordinates ( $\Delta x, \Delta s$) of the measurement station with respect to the reference location.

The reference location, shown as a grey circle, is within the constant PSD zone of the SV band for figure 11(a). It is observed from figure 11(a) that the positively correlated band within the upstream boundary layer, which was also observed in the zero-lag cross-correlation fields of figure 10(a), leads the reference location by 0.025 ms. The coarse time resolution of the pressure fields and the short convection time of the boundary layer structure within the measurement domain precludes the delineation of the differences in the temporal lag along the upstream boundary layer. An abrupt change in the peak lag to negative values is observed in figure 11(a) when the positively correlated band from the upstream boundary layer enters the intermittent region, evidencing that the pressure fluctuation at this intermittent region location lags the reference location. This is followed by the restoration of the peak lag to positive values in the SV band upstream of the reference location. The peak correlation lag monotonically reduces from positive values upstream of the reference location to increasingly negative values when traversed along the local flow direction of the SV band. This evidences the downstream propagation of the pressure perturbations along the SV band (shown as a black arrow) that was also prevalent in the instantaneous pressure fluctuation field sequence of supplementary movie 1. Figure 11(c) presents the line plots of the two-point correlations sampled at select locations within the SV band that further illustrates the downstream propagating perturbations. The velocity of this downstream propagating pressure perturbation was determined to be 144 m s $^{-1}$ (
 ${\approx } 0.25 \times u_\infty$) from the average spacing of the different peak lag bands.
The peak lag field within the IR band exhibits considerable complexity. Within the negatively correlated region of the IR band (see figure 11a as well as figure 11d for select two-point correlation plots), a downstream propagating (along the IR band) pressure perturbation, annotated by a red arrow in figure 11(a), is observed with a calculated propagation velocity of 137 m s $^{-1}$ (
 ${\approx }0.24 \times u_\infty$), which is similar to the propagation velocity within the SV band. Furthermore, almost the entire negatively correlated region of the IR band occurs simultaneously with or lags the reference location; notably, the peak negative correlation location (white line contour) occurs at a 0.075 ms lag. Between the SV and IR bands, the isocontours of the correlation lag bands are oriented almost along the fin normal direction. This shows that the pressure perturbations propagate along the fin normal direction, as indicated by the white arrow, which is indicative of the breathing motions of the separation vortex. The corresponding propagation velocity of these pressure perturbations is calculated to be 23 m s
 $^{-1}$ (
 $0.04\times u_\infty$). This band abruptly terminates at the interface of the negatively correlated region of the IR band and the peak lag abruptly shifts from
 $-$0.075 to 0 ms across the interface.
The correlation between SV and FR band being very weak (<0.15) in figure 11(a), and the peak lag map in this region is not considered in this analysis. Further outboard of the FR band lies the reattachment region where the zero-lag correlation coefficient remained at a modest level until downstream of the fin normal projection of the reference location and a notable increase in the correlation coefficient was observed further downstream. The peak correlation time delay at the location of highest cross-correlation in the reattachment region lags the reference location by 0.025 ms.
Figure 11(a) also reveals that the positive peak lag (yellow contour band) that occur upstream of the reference location in SV band can be tracked to extend further inboard of the SV band. This positive peak lag is observed to reach the vicinity of the fin leading edge well into the inception region, suggesting that the reference location is also affected by the pressure perturbations originating near the fin leading edge. This observation is particularly important in light of the earlier observations made from the instantaneous pressure field sequence of figure 7 that a significant fraction of the pressure fluctuation bands originated in the vicinity of the fin leading edge and convected along the different (IR, SV and FR) bands. This observation puts a spotlight on the fluctuations originating from the vicinity of the fin leading edge and this region is probed next.
Figure 11(b) presents the corresponding peak correlation lag map for the reference location where the positive peak lag from the SV band terminates in the vicinity of the fin leading edge. The peak lag contours evidence that this location leads all other locations within the separation vortex. Pressure perturbations are found to convect downstream individually along the SV band and the FR band as shown by the black arrows. The pressure perturbations within the IR band originates in the vicinity of the fin leading edge and propagates downstream along the IR band, as annotated by the black curved arrow. The correlation coefficient tapers within the IR band to below 0.1 at around  $s = 15$ mm, which evidences the influence of pressure perturbation from the fin leading edge vicinity terminates beyond a certain distance within the IR band. Within the SV band, one can also observe a narrow region where the pressure perturbation propagates in the fin normal direction, as shown by a white arrow. This again reinforces the occurrence of separation vortex pulsations that sends pressure perturbations into the IR band. Finally, the pressure fluctuations in the upstream boundary layer over
 $s < 10$ mm, where the correlation coefficient was greater than 0.2, led the reference location by 0.025 ms. The positive peak lag within the upstream boundary layer can be observed to extend in the range
 $-20\ {\rm mm} \leq x \leq -10\ {\rm mm}$. However, given the modest correlation value and the fact that the pressure perturbation in these regions will not directly affect the reference location, these regions are ignored. Similarly, another region outboard of the SV band where the peak lag is positive (leading the reference location) can be observed. Once again, given the modest correlation coefficient this region is also ignored.
Overall, it appears that the perturbations within the SV band is influenced by both the pressure perturbations that originate from the vicinity of the fin leading edge as well as the upstream boundary layer structures from further inboard of a given reference location within the SV band. The separation shock motions appear to be influenced by the pressure perturbations from the inception region and also from the pulsations of the separation vortex. Finally, the reattachment region also appears to be influenced by the separation vortex pulsations.
3.7. Conditionally averaged cross-correlation sequence
The cross-correlation analysis presented in the preceding sections provided significant insights into the sources and mechanisms that influence the separation vortex motions. An important aspect of the present fin SBLI unit is that the flow interactions are highly nonlinear and the correlation analysis presented so far can provide only a limited information the causality of the coupling that were observed in the SBLI. In this section, we explore how the different sources and mechanisms interact with one another to yield the observed outcomes on the separation vortex motions; specific focus will be made on the mid-frequency band oscillations of the separation shock.
For this study, a time sequence of conditionally averaged pressure fluctuation field that lead and follow an extremum event identified at a reference location within the separation vortex was obtained following the procedure detailed in Jenquin et al. (Reference Jenquin, Johnson and Narayanaswamy2023). Briefly, the pressure fluctuation fields were bandpass filtered using a 20-order infinite impulse response (IIR) filter that had a cutoff frequency at 1 and 8 kHz to isolate only the mid-frequency band oscillations. Next, the time instances of all the local maximum in the time series at a chosen reference location were identified and the corresponding time period between successive maxima were documented. Now, the maxima corresponding to those instances when the time period between successive maxima exceeding 0.5 ms were shortlisted. This will ensure that there was only one minimum in this time window and this minimum was also separated from its nearest minima at an average of 0.5 ms, which allowed us to probe the pressure fluctuation dynamics that occur in the mid-frequency band. The time instances of the minima that were identified in the shortlisted time periods were set as reference time,  $\tau = 0$ ms, around which the conditional phase average sequence was constructed. Subsequently, ensemble averaging of the pressure fluctuation field was made at each time instance preceding and following
 $\tau = 0$ ms, and the time sequence of the phase-averaged conditional pressure fluctuation fields,
 $p'_c$, over the entire SBLI were obtained. The pressure fluctuations were normalised by the local r.m.s. value, which made an equitable representation of both low-
 $p_{r.m.s.}$ and high-
 $p_{r.m.s.}$ regions within the SBLI.
Figure 12 presents the phase-averaged conditional pressure fluctuation field,  $p'_c/p_{r.m.s.}$, over a 0.225 ms duration (
 $-0.15\ {\rm ms} \leq \tau \leq +0.075\ {\rm ms}$) centred about a minima event at the reference location in the SV band (shown as a grey circle). Over 2000 instantaneous fields spanning two test runs were ensemble averaged for each time instance to compute the phase average at a given instance. Supplementary movie 2 presents a longer sequence whose select frames are presented in figure 12. In each frame, the loci of S1, S2 and R1 are marked from figure 3(a) to delineate the locations where the important pressure events occur and evolve during the sequence. The readers are reminded that the separation shock oscillations (IR band) occur outboard of S1, SV band is beneath S2 and the FR band is inboard of R1.
Phase-averaged time sequence of the pressure fluctuation field conditioned on the occurrence of a minima at the reference location, marked with a grey circle. (a–j) Time instances between  $\tau = -0.15$ ms (a) and
 $\tau = +0.075$ ms (j) where
 $\tau = 0$ ms corresponds to the instance of the minima at the reference location. Each frame is separated by
 $\tau = 0.025$ ms from the previous frame. The loci of S1, S2 and R1 from figure 3(a) are overlaid on each figure.

Figure 12(a) corresponds to  $\tau = -0.15$ ms that precedes the pressure events that lead up to the minima event at the reference location. At this time instance, the SV band was transitioning out of a local positive
 $p'_c/p_{r.m.s.}$ event, and the entire SV band can be observed to be engulfed in the positive
 $p'_c/p_{r.m.s.}$. Supplementary movie 2 presents the phase-averaged fields that captures the growth and decay of this preceding positive
 $p'_c/p_{r.m.s.}$ event over an extended time. It is observed that the growth and decay phase of the positive
 $p'_c/p_{r.m.s.}$ are accompanied by a concomitant growth and decay in both area and strength of the positive
 $p'_c/p_{r.m.s.}$ in the upstream boundary layer. The movie sequence also reveals that as the strength of the positive
 $p'_c/p_{r.m.s.}$ in the upstream boundary layer diminishes, the leading edge portion of the positive
 $p'_c/p_{r.m.s.}$ in the SV band tilts appreciably towards the R1 near the fin leading edge. At the instance of figure 12(a), the positive
 $p'_c/p_{r.m.s.}$ within the upstream boundary layer is largely confined to the vicinity of the fin leading edge and extends several boundary layer thicknesses upstream of the fin leading edge beyond the measurement domain. Following the movie sequence to the frame shown in figure 12(a) reveals that a channel of positive
 $p'_c/p_{r.m.s.}$ extends into the IR band between
 $5\ {\rm mm} \leq s \leq 9\ {\rm mm}$ and connects the positive
 $p'_c/p_{r.m.s.}$ in the upstream boundary layer and the SV band. Outboard of the positive
 $p'_c/p_{r.m.s.}$ channel, the remnant of the decaying negative
 $p'_c/p_{r.m.s.}$ in the IR band can be observed. The FR band and the region surrounding the R1 also exhibit a negative
 $p'_c/p_{r.m.s.}$ that extends along the entire length of the fin root. A notable development at the instance of figure 12(a) that was not observed in the preceding frames of supplementary movie 2 is the formation of a slightly elevated positive
 $p'_c/p_{r.m.s.}$ blob (marked by an arrow in figure 12a,b) whose boundary extended between the IR band and the S1 locus. This blob undergoes a strong evolution in the subsequent time instances, as discussed in the following.
At  $\tau = -0.125$ ms, as shown in figure 12(b), the positive
 $p'_c/p_{r.m.s.}$ within the SV band has shrunk perpendicular to the local flow direction. Furthermore, the leading edge portion of the positive
 $p'_c/p_{r.m.s.}$ in the SV band is confined between the S2 and R1 loci. In addition, the positive
 $p'_c/p_{r.m.s.}$ region of the upstream boundary layer has also noticeably reduced in its circumferential extent and elevated positive
 $p'_c/p_{r.m.s.}$ (yellow isocontour) is confined to a narrower region surrounding the fin leading edge in figure 12(b). In fact, the most outboard regions of the upstream boundary layer away from the fin leading edge exhibit slightly negative
 $p'_c/p_{r.m.s.}$. The weak positive
 $p'_c/p_{r.m.s.}$ blob between the IR and S1 identified in figure 12(a) has grown in strength and extent in figure 12(b) (annotated by a black arrow); interestingly, its growth direction has been primarily directed towards the IR band to result in a small positive
 $p'_c/p_{r.m.s.}$ blob in the IR band at
 $s \approx 5$ mm. Concomitantly, a mild negative
 $p'_c/p_{r.m.s.}$ blob can also be observed that emanate between S1 and S2 loci near
 $s \approx 10$ mm, as shown by a red arrow in figure 12(b). The mild negative
 $p'_c/p_{r.m.s.}$ region surrounding the R1 locus within the FR band has remained unchanged.
At  $\tau = -0.1$ ms (figure 12c), the negative
 $p'_c/p_{r.m.s.}$ of the upstream boundary layer has grown both in strength and size, and the positive
 $p'_c/p_{r.m.s.}$ has further weakened in strength and extent. The positive
 $p'_c/p_{r.m.s.}$ blob in the IR band has again grown in strength compared with the earlier time instance. This blob has undergone an interesting evolution wherein the blob now exhibits two distinct local maxima, one at
 $s \approx 12$ mm and another at
 $s \approx 6$ mm. Furthermore, the negative
 $p'_c/p_{r.m.s.}$ blob between the S1 and S2 loci has strengthened noticeably, but without substantial growth. In addition, the positive
 $p'_c/p_{r.m.s.}$ region of the SV band has split into two distinct regions, one close to the fin leading edge and the other farther downstream. The band close to the fin leading edge has reached the fin root and displaced the negative
 $p'_c/p_{r.m.s.}$ around the R1 locus to downstream locations along the fin root.
Between  $\tau = -0.1$ ms (figure 12c) and
 $\tau = -0.075$ ms (figure 12d), the negative
 $p'_c/p_{r.m.s.}$ band between the S1 and S2 loci has grown significantly both perpendicular and parallel to the local flow direction (discerned from the surface streakline patterns). The perpendicular direction growth of the pressure perturbation strongly supports the enlargement/contraction of the separation vortex resulting in a breathing motion. The positive
 $p'_c/p_{r.m.s.}$ blob between the IR band and S1 also strengthens in response to the negative
 $p'_c/p_{r.m.s.}$ blob. Interestingly, whereas the outboard local maximum has significantly strengthened and grown in size, the inboard maximum at
 $s \approx 6$ mm has weakened. The growth of the outboard positive
 $p'_c/p_{r.m.s.}$ blob occurs along both parallel and perpendicular to the local flow direction. Two interesting observations are made regarding this growth. First, the perpendicular direction growth primarily occurs by spreading of the blob more into the IR band while the inboard boundary still remains at S1; this reinforces that the separation shock is pushed outboard. Second, the downstream edge of the positive
 $p'_c/p_{r.m.s.}$ blob at
 $\tau = -0.075$ ms and at the subsequent period of the sequence until
 $\tau = -0.025$ ms (figure 12e,f) grows concomitantly with the downstream edge of the negative
 $p'_c/p_{r.m.s.}$ of the SV band. This shows that the local separation shock motion occurs in sync with the growth of the separation vortex; in other words, the separation shock is predominantly responding to the separation vortex pulsations. The negative
 $p'_c/p_{r.m.s.}$ of the upstream boundary layer has further grown in strength and extent at
 $\tau = -0.075$ ms. Similarly, the negative
 $p'_c/p_{r.m.s.}$ region surrounding the R1 is displaced further to the downstream half of the fin root, and the upstream region of the reattachment region is covered with a growing positive
 $p'_c/p_{r.m.s.}$.
The above-mentioned trends of the respective  $p'_c/p_{r.m.s.}$ bands continue until
 $\tau = -0.025$ ms with a few notable developments. First, the inboard maxima of the positive
 $p'_c/p_{r.m.s.}$ blob in the IR band has gradually diminished to zero by
 $\tau = -0.025$ ms whereas the outboard positive
 $p'_c/p_{r.m.s.}$ region continued to grow in size and strength. Second, a considerable downstream convection of the positive and negative
 $p'_c/p_{r.m.s.}$ regions along the respective IR and SV bands can be observed to accompany the substantial growth of the corresponding
 $p'_c/p_{r.m.s.}$ regions. The growth of the
 $p'_c/p_{r.m.s.}$ region in the IR band is skewed along the downstream direction whereas the upstream boundary remained relatively intact. A similar skewed growth of the negative
 $p'_c/p_{r.m.s.}$ region is also observed in the SV band. In addition to the downstream growth, an extension of the negative
 $p'_c/p_{r.m.s.}$ region of the SV band can also be observed in the upstream direction along the S2 locus over
 $-0.075\ {\rm ms}\leq \tau -0.025\ {\rm ms}$, and this extension also grows slightly inboard to reach the R1 locus; the positive
 $p'_c/p_{r.m.s.}$ blob that existed in the leading locations of the R1 locus at
 $\tau = -0.075$ ms has shifted further downstream along the fin root. Furthermore, the negative
 $p'_c/p_{r.m.s.}$ of the SV band has connected to the remaining negative
 $p'_c/p_{r.m.s.}$ at the trailing regions of the fin root and has strengthened the
 $p'_c/p_{r.m.s.}$ in this region at subsequent time instances until
 $\tau = +0.025$ ms (figure 12g,h). This leads to a region of positive
 $p'_c/p_{r.m.s.}$ over the mid length of the fin root that is terminated at the leading and trailing edges by negative
 $p'_c/p_{r.m.s.}$ regions (see figure 12e–h). The negative
 $p'_c/p_{r.m.s.}$ of the upstream boundary layer peaked its strength at
 $\tau = -0.05$ ms and has begun to weaken at
 $\tau = -0.025$ ms; at both time instances the entire boundary layer is engulfed in negative
 $p'_c/p_{r.m.s.}$. By
 $\tau = 0$ ms (figure 12g), the negative
 $p'_c/p_{r.m.s.}$ regions of the upstream boundary layer is largely confined to
 $s \leq 10$ mm. At this instance, a negative
 $p'_c/p_{r.m.s.}$ channel is formed within the IR band that connects the negative
 $p'_c/p_{r.m.s.}$ in the upstream boundary layer and SV band; the corresponding
 $p'_c/p_{r.m.s.}$ field is roughly in antiphase of figure 12(a). The negative
 $p'_c/p_{r.m.s.}$ in the SV band continues to grow until
 $\tau = +0.025$ ms (figure 12h) before it begins to decay and convect downstream along the S2 locus. The formation of the negative
 $p'_c/p_{r.m.s.}$ forms the starting point of the next cycle of pressure oscillation that is antiphase with the current cycle (figure 12i,j).
3.8. Discussions
The observations made in the phase-averaged sequence of the  $p'_c/p_{r.m.s.}$ fields provide several important details about the fin SBLI dynamics. First, the time between two nearly in-phase pressure fields over the IR and SV bands were observed to occur over a period of 0.35 ms on an average, as observed from supplementary movie 2 (also figures 12(a) and (e) are nearly antiphase with one another). This time period corresponds to a dominant frequency of 2.8 kHz at which the pressure oscillations within the separation vortex and separation shock oscillations occur. This dominant frequency value is in line with the 1–8 kHz range of pressure oscillations observed in the mid-frequency range and corresponds reasonably to the peak frequency (
 $\approx$5 kHz) of mid-frequency range. Thus, the sequence of pressure events observed in supplementary movie 2 and figure 12 indeed relates to the flow interactions that drive the mid-frequency range of the separation shock pulsations.
Supplementary movie 2 and the time sequence of figure 12 conclusively showed that the pressure oscillations within the SV band are driven by the growing and convecting  $p'_c/p_{r.m.s.}$ structures, which is in line with Adler & Gaitonde (Reference Adler and Gaitonde2020). These structures also trigger corresponding
 $p'_c/p_{r.m.s.}$ structures in the IR band (i.e. local undulations in the separation shock foot) and drive the separation shock oscillations. Thus, the pressure oscillation cycles of both the SV and IR bands are driven by these convecting pressure perturbations that are closely coupled with one another. This explains why the spectral content of the SV band PSD in the mid-frequency range is nearly the same as that of the IR band (figures 4a and 5).
The positive  $p'_c/p_{r.m.s.}$ blobs in the inception region close to the fin leading edge (discussed in figure 12b,
 $\tau = -0.125$ ms) is thought to trigger the negative
 $p'_c/p_{r.m.s.}$ kernel in the separation vortex (figure 12c). The negative
 $p'_c/p_{r.m.s.}$ kernel triggers another positive
 $p'_c/p_{r.m.s.}$ kernel in the outboard region of the IR band leading to a dual maxima structure (figure 12c,d). It was observed that although the
 $p'_c/p_{r.m.s.}$ kernel in the inception region of the IR band diminished, the outboard
 $p'_c/p_{r.m.s.}$ kernel that was emanated within the separation vortex region affected the pressure oscillations in the IR region. Thus, the primary trigger for the separation vortex modulations appears to emanate from the vicinity of the fin leading edge. This reinforces the earlier observations on the importance of the inception region in driving the swept interactions (Padmanabhan et al. Reference Padmanabhan, Maldonado, Threadgill and Little2021). However, it should be remarked that there were several sequences where the
 $p'_c/p_{r.m.s.}$ kernel within the separation vortex was germinated without the presence of a preceding
 $p'_c/p_{r.m.s.}$ kernel in the inception region. One such example is provided in figure 13, where the separation vortex kernel was generated as the extension of the boundary layer pressure fluctuations into the separation vortex. This suggests that this kernel (circled in figure 13a–d) was generated exclusively by the local interaction of the boundary layer with the SBLI unit. Thus, there appears to be two main driving interactions for the separation vortex dynamics: the predominant cause appears to be the interactions at the inception region and secondary trigger appears to be the local turbulent boundary layer that germinates
 $p'_c/p_{r.m.s.}$ kernels.
A representational sequence of instantaneous  $p'/p_w$ fields where the pressure fluctuation kernel in the SV band (annotated by an arrow) is triggered by direct local interactions with the upstream boundary layer: (a)
 $\tau = 0.0$ ms, (b)
 $\tau = +0.025$ ms, (c)
 $\tau = +0.05$ ms and (d)
 $\tau = +0.075$ ms. (a) Captures the instant when the kernel is formed and figures (b–d) presents the time correlated growth and convection along the SV band. Each subsequent figure is separated by
 $0.025$ ms from the earlier figure.

The role of boundary layer is complex and very different from 2-D SBLIs. As shown in figure 13, the local interactions of the upstream boundary layer and the separation vortex can cause the boundary layer to germinate flow events (shown as the new  $p' /p_{r.m.s.}$ kernels in figure 13) within the separation vortex that ultimately elicit a local motion from the separation shock. Another pathway of boundary layer influence is the local interactions between the boundary layer and the convecting pressure perturbations within the separation vortex. To evaluate the occurrence of this pathway, the correlation between the magnitude of the boundary layer
 $p' /p_{r.m.s.}$ and the strength of the
 $p' /p_{r.m.s.}$ regions of the SV band was studied. This was investigated by analysing the magnitude of
 $p' /p_{r.m.s.}$ within the upstream boundary layer placing additional constraints on the phase average conditional pressure sequence, selecting only those whose peak
 $p' /p_{r.m.s.}$ magnitude at the reference location (within the SV band) that exceeded a given threshold. Figure 14 presents the phase averaged upstream boundary layer
 $p' /p_{r.m.s.}$ for three different peak
 $p' /p_{r.m.s.}$ magnitude constraints at the reference location corresponding to figure 12. Two azimuthal regions were averaged: one in the vicinity of the fin leading edge (
 $0\leq s\leq 10\ {\rm mm}$), which is presented in figure 14(a); and another in the outboard region of the cylinder surface (
 $15\ {\rm mm} \leq s\leq 25\ {\rm mm}$), presented in figure 14(b). Both figure 14(a) and (b) reveal that the
 $p' /p_{r.m.s.}$ within the upstream boundary layer more than doubles in its magnitude when conditioned on the peak
 $p' /p_{r.m.s.}$ at the reference location being greater than 2.5 vs being less than 0.5. This observation strongly suggests that the upstream boundary layer indeed fosters the growth and strengthening of the
 $p' /p_{r.m.s.}$ kernels that are emanated within the SV band.
Temporal evolution of the phase averaged  $p'/p_{r.m.s.}$ of the incoming boundary layer conditioned on three different magnitudes of peak
 $p'/p_{r.m.s.}$ of the reference location within the SV band. The
 $p'/p_{r.m.s.}$ was averaged over two different azimuthal regions within the incoming boundary layer: (a) in the vicinity of the fin leading edge; and (b) in the outboard regions of the cylinder surface. The reference location used for computing the conditional average is the same as that for figure 12.

3.9. Hypothesis on the driving mechanisms of fin SBLI dynamics
The dynamics of the conditionally averaged pressure fluctuations discussed so far provide critical input on the complex interactions within the fin SBLI unit, which allows us to construct a descriptive model of the driving mechanisms of the fin SBLI dynamics. The arguments made here is built on the reported correlations between the wall pressure fluctuations and other flow variables of direct consequence to SBLI such as the inflow momentum. A significant body of literature has found direct correspondence between the wall pressure fluctuations beneath a turbulent boundary layer and the momentum fluctuations within the boundary layer. A detailed review of this literature is made in Jenquin et al. (Reference Jenquin, Johnson and Narayanaswamy2023) and is not repeated here for the sake of conciseness. Overall, a positive wall pressure fluctuation has been shown to correspond to a positive momentum fluctuation within the boundary layer (Beresh, Clemens & Dolling Reference Beresh, Clemens and Dolling2002; Beresh et al. Reference Beresh, Henfling, Spillers and Pruett2011). Furthermore, the pressure fluctuations within the separation bubble of a 2-D SBLI have been shown to be predominantly caused by the shear layer eddies that are present over the separation bubble (Chandola et al. Reference Chandola, Huang and Estruch-Samper2017). Specifically, a negative (positive) pressure fluctuation over the SV band would indicate a weaker (stronger) shear layer compared with the mean, and a smaller entrainment of fluid away from the separation bubble, which results in the enlargement (contraction) of the separation bubble (Chandola et al. Reference Chandola, Huang and Estruch-Samper2017). These observations will be extended to the present fin SBLI, where a local negative (positive) pressure fluctuation within the separation vortex is proposed to indicate a local enlargement (contraction) of the vortex.
The discussions of figure 12 show that the genesis of the convective instabilities within the separation vortex occurs primarily at the separated flow in the vicinity of the fin leading edge. We, therefore, turn our attention to the mechanisms that drive the separation unit at the fin leading edge. Theoretically, the separation unit emanated at the fin leading edge should represent a 2-D SBLI; support for this also comes from several investigations made at the leading edge of blunt fins which exposed their strong consistency with 2-D SBLIs (e.g. Brusniak & Dolling Reference Brusniak and Dolling1994). We posit that if the separation unit at the fin leading edge exhibits 2-D SBLI characteristic, then the driving mechanism of the separation unit pulsations can be expounded from the available literature on 2-D SBLI. Figure 4(a) shows that the separation scale at the fin leading edge was measured to be  $L_{sep} \approx 7\ {\rm mm} \approx 1.2\times \delta _{99}$. The frequency premultiplied PSD of the intermittent region presented in figure 15 exhibits a peak Strouhal number based on the separation length scale at the fin leading edge was
 $St_{L_{sep}} = 0.024$, which is within the range of 0.02–0.05 reported in various 2-D SBLI units (Clemens & Narayanaswamy Reference Clemens and Narayanaswamy2014). The intermittent region is followed by the separated flow region, whose PSD exhibit a monotonic increase in the PSD without a defined peak (figure 15); the peak frequency of the separation bubble oscillations lies well above the Nyquist limit of the present measurements, which is also consistent with 2-D SBLIs. A mild peak at
 $\approx$5 kHz can also be observed in the separation bubble PSD; this is likely due to the contamination of the PSD from the separation shock oscillations due to the small separation size. Contrasting the 2-D SBLI units, the PSD adjacent to the fin leading edge where the separation bubble should have reattached in an ideal 2-D setting exhibit notable deviations from the literature. Whereas the 2-D SBLI literature predicts that the peak frequency of the reattachment region should exceed the intermittent region by over 25-folds, the present PSD is very similar in its spectral content to the intermittent region PSD. The readers are reminded that in an ideal case of sharp fin SBLI, only an infinitesimally thin 2-D SBLI occurs at the fin leading edge. Hence, the deviations in the reattachment region PSD may not be surprising.
Comparison of the frequency premultiplied PSD at representative locations of the SBLI unit at the fin leading edge (‘LE’).

The separation bubble length scale being very similar to the incoming boundary layer thickness makes the separation unit correspond to the intermittent category, wherein the incoming boundary layer can make direct contributions towards driving the separation bubble pulsations (Clemens & Narayanaswamy Reference Clemens and Narayanaswamy2014). Corroborating this argument, a positive pressure fluctuation within the upstream boundary layer seen in figure 12(a), which corresponds to a positive momentum fluctuation, triggers a downstream displacement of the separation shock in the fin leading edge region, which was observed as a mildly negative  $p_c'/p_{r.m.s.}$ surrounding
 $s = 0$, and a corresponding contraction of the separation bubble (positive
 $p_c'/p_{r.m.s.}$ in the separation region). This results in the broadband breathing motion of the separation bubble at the fin leading edge, as sketched in figure 16, which is primarily driven by the incoming boundary layer in the vicinity of the fin leading edge. Unlike the classic 2-D SBLI, this separation unit at the fin leading edge region can relieve along the circumferential direction. Therefore, a contracting separation bubble at the fin leading edge is hypothesised to add some of its discarded fluid to the outboard separation vortex in its local vicinity. This could result in the local enlargement of the outboard separation vortex (negative
 $p_c'/p_{r.m.s.}$ in figure 12b) and an upstream displacement of the separation shock (positive
 $p_c'/p_{r.m.s.}$ in figure 12b). The enlargement of the separation vortex is further exacerbated if the upstream boundary layer that locally interacts with the separation vortex has a momentum deficit (see correlations reported in figure 14). The upstream boundary layer with a momentum deficit generates a weaker shear layer over the separation vortex, which in turn causes a smaller mass entrainment rate from the separation vortex, and ultimately aids the further enlargement of the separation vortex. This could be the cause of the continued growth and strengthening of
 $p_c'/p_{r.m.s.}$ in figure 12(b–g) within the separation vortex as long as the incoming boundary layer had a momentum deficit (seen as negative
 $p_c'/p_{r.m.s.}$ in the upstream boundary layer). In addition, the boundary layer can independently alter the local separation vortex size by modulating the shear layer over the separation vortex even without the presence of a kernel from the inception region and cause convecting perturbations that originate outboard of the inception region; however, this influence appears to be weaker when compared with the former mechanism.
Illustration of the different mechanisms that affect the local pulsations of the separation vortex and separation shock motions of the fin SBLI.

An interesting observation from the above discussions is that the governing length scale of the two mechanisms are the separation scale at the fin leading edge, which controls the pulsation time scales of the separation bubble in this region, and the incoming boundary layer thickness, which determines the entrainment rate of the eddies over the separation vortex. In the present work, and other documented literature on sharp fin SBLI (e.g. Settles & Lu Reference Settles and Lu1985), the separation length scale at the fin leading edge is very similar to the boundary layer thickness. Therefore, the controlling length scale of the separation vortex dynamics from both the mechanisms is the incoming boundary layer thickness, measured just upstream of the fin SBLI.
3.9.1. Comments on the governing mechanisms evolution with increasing sweep
The influence of the separation bubble (local) pulsations vs the convective perturbations towards driving the swept SBLI dynamics appears to undergo a shift with increasing sweep of the SBLIs. Prior works on unswept (2-D) SBLI and mild or moderately swept SBLI have reported a continued dominance of the inherent separation bubble instabilities as a driving mechanism of the separation shock and the bubble (Erengil & Dolling Reference Erengil and Dolling1993; Huang & Estruch-Samper Reference Huang and Estruch-Samper2018). Vanstone et al. (Reference Vanstone, Musta, Saleem, Seckin and Clemens2016) through their time-resolved particle image velocimetry (PIV) observed the correlation between the cross-stream propagating velocity perturbations on the local separation shock pulsations at mid-frequency range. However, in that work, a direct measurement of the inherent separation bubble instabilities was not made, and a direct comparison between the inherent instabilities vs the cross-stream instabilities was not evaluated.
Adler & Gaitonde (Reference Adler and Gaitonde2020) compared two swept SBLI units, one that is a moderately swept compression ramp and the other a highly swept fin SBLI. The authors made clear observations on the dominant role of convective instabilities towards driving the shock motions. As such, a direct comparison of the role of the inherent separation bubble instabilities was not made in that work. However, the dominance of the convective instabilities clearly suggests that the local separation scales are not an influencing factor in the fin SBLI, which agrees with suggestion made by Padmanabhan et al. (Reference Padmanabhan, Maldonado, Threadgill and Little2021). The present work supports and substantially augments these observations, by evidencing the dual presence of the separation bubble inherent unsteadiness and the convective instabilities, and their respective roles towards driving the fin SBLI dynamics. The constancy of the PSD with downstream distance in IR and SV bands, the remarkable overlap of the mid-frequency PSD between the IR and SV bands and the common origin of the pressure perturbations that split and propagate through the separation vortex and separation shock together assert the predominance of the convective instabilities towards driving the fin SBLI dynamics. This observation is also consistent with Padmanabhan et al. (Reference Padmanabhan, Maldonado, Threadgill and Little2021), who showed that despite reducing the separation length scale at the root (here, the fin leading edge), the convective perturbations that originate outboard of inception are not affected. Based on this experimental work and other prior literature, it may be asserted that there is a shift in the dominant fin SBLI driving mechanisms with increasing sweep angle from a separation bubble instability to convective instabilities in highly swept SBLI such as the fin SBLI of the present study.
As a final remark, we note that the present work derives almost all of the knowledge on the fin SBLI dynamics from a singular measurement variable, namely the surface pressure fields. There are obvious limitations in unravelling the complex flow physics that drives the fin SBLI dynamics with just the surface pressure maps. It is quite well known that the surface pressure signature beneath a turbulent separated flow is an aggregate effect of the dynamics across a spectrum of length and time scales. Therefore, the pressure fluctuation maps can only provide insight into the role of the dominant flow feature that contributes to the pressure signature towards driving the fin SBLI dynamics. Despite this limitation, the present work reveals significant insights into the drivers of the fin SBLI dynamics that substantially extends the current knowledge. Furthermore, it is important to note that the prior experimental investigations that advanced in our understanding of the fin SBLI relied primarily on the wall pressure fluctuation measurements. This justifies the use of the unsteady pressure as a flow variable of interest in the present work. By extending the pressure measurement to 2-D surface pressure fields, the present work retains the efficacy of the experiments to yield fundamental insights into the fin SBLI driving physics and simultaneously propels the state of the art on the experimental techniques that are employed to study the fin SBLI problem.
4. Conclusions
The present work has presented high-bandwidth pressure field imaging of the fin-shock-induced separation that hosts one of the most complex flow interactions and also has a significant practical relevance. The open nature of the separation vortex that emanates from the fin shock interactions with the incoming boundary layer makes the flowfield highly unsteady and 3-D; further, the convective instabilities have been proposed to make a strong contribution towards governing the separation shock dynamics. The prior experiments on high bandwidth surface pressure fluctuations to untangle the dynamics of the separation shock were made typically along one or two fin normal rays. This shortcoming precluded a comprehensive understanding of the various mechanisms that are active towards driving the separation vortex and separation shock pulsations. The pressure field imaging made in the present study used high-bandwidth pressure-sensitive paints that provided 2-D pressure fields within the fin SBLI at 40-kHz repetition rate, which significantly exceeds the low- and mid-frequency ranges of the separation shock oscillations. The spectral response of the PSP was independently evaluated using theoretical and experimental approaches and both evaluations provided a  $-$6-dB attenuation frequency of 6 kHz or higher.
The investigations of the mean of the pressure field showed that the separation shock weakened along the downstream distance, which is consistent with Pickles et al. (Reference Pickles, Mettu, Subbareddy and Narayanaswamy2019). The  $p_{r.m.s.}$ fields showed the existence of three distinct bands of elevated
 $p_{r.m.s.}$ values: the IR band, the SV band and the FR band. Detailed sweeps of the surface pressure PSD revealed the structure of the spectral content within the SBLI unit. A noteworthy observation was that the mid-frequency range pressure fluctuations made the dominant contribution towards the IR band PSD beyond a certain downstream distance from the fin leading edge (‘inception region’). Interestingly, the PSD of the SV band nearly mirrored the IR band PSD throughout the measurement domain, which was a sharp contrast with 2-D SBLI units reported in the literature. The FR band, however, was dominated by low-frequency band fluctuations downstream of the inception region.
A suite of statistical tools were employed to investigate the sources and mechanisms that drive the separation vortex and separation shock foot motions. The coherence analysis showed that the mid-frequency range separation shock foot oscillations are highly coupled with the separation vortex oscillations in this frequency range. The zero-lag correlation field reiterated the close coupling between the separation shock and the separation vortex oscillations. In addition, the separation vortex oscillations at a given location also exhibited a significant correlation with the upstream boundary layer fluctuations at an inboard location. Subsequently, the phase-averaged pressure fluctuation field preceding and following an extremum event at a reference location within the separation vortex (SV band) was constructed. The evolution of the phase-averaged conditional pressure fluctuations revealed that the genesis of the separation vortex and separation shock motions occurred within the separated flow in the vicinity of the fin leading edge. The interactions between the incoming boundary layer and the separation bubble at the fin leading edge trigger instances of enlargement and contraction of the separation bubble. It is hypothesised that some of the excess or deficit in the mass within the separation bubble at the fin leading edge triggered a corresponding mass imbalance in the separation vortex in its vicinity, which propagated along the separation vortex. The mass imbalance is also posited to become exacerbated when the separation vortex locally interacts with the upstream boundary of momentum deficit or excess. The mass imbalance is hypothesised to cause local breathing of the separation vortex, which in turn results in the local upstream and downstream motions of the separation shock foot. Overall, a combination of convective instabilities and the modulation in the mass entrainment rate within the separation vortex appear to drive the mid-frequency dynamics of the separation vortex and separation shock in a fin SBLI unit. It should be emphasised that the above-mentioned hypotheses are conjectural and need an objective evaluation from velocity fields. In fact, to evaluate this hypothesis one would need high-frequency velocity field measurements that time resolves the mass present within the separation bubble. Given the fundamental 3-D nature of the fin SBLI unit, a planar quantification of velocity fields may not be sufficient and perhaps a volumetric quantification will be required. Clearly, the current knowledge can be deepened significantly with future velocity field measurements as well as high-fidelity computations.
Supplementary movies
Supplementary movies are available at https://doi.org/10.1017/jfm.2024.966.
Funding
This work was supported by ONR Grant N00014-21-1-2238 with Dr Brian Holm-Hansen as the Program Manager.
Declaration of interests
The authors report no conflict of interest.


 Open access

