Implications
The contribution of ruminal microorganisms to the digesta flow to the intestine is crucial for an accurate estimation of nutrient supply in ruminants. However, most of these estimations are based on isolated liquid-associated bacteria (LAB), which underestimates the contribution of solid-associated bacteria, because of the higher microbial marker/N ratios of the former. The obtained relationship between these ratios in both the bacteria types using 15N as the microbial marker can be applied to predict the underestimation in the microbial nutrient supply when only LAB are used as a reference sample.
Introduction
Accurate estimates of microbial synthesis in the rumen and of microbial contribution to the post-ruminal flow of nutrients are crucial to establish feeding standards. Estimates based on the microbial nutrient flow are based on microbial markers such as diaminopimelic acid, nucleic acids or its derivatives, and by using stable or radioactive isotopes. However, for simplicity, the marker/N ratio used as a microbial reference to determine microbial protein synthesis has been usually determined on bacteria harvested from the liquid fraction of the rumen content (liquid-associated bacteria; LAB). Nevertheless, LAB represent only a minor fraction of the rumen bacterial populations, in which solid-associated bacteria (SAB) are largely predominant (Faichney, Reference Faichney1980; Legay-Carmier and Bauchart, Reference Legay-Carmier and Bauchart1989; Volden, Reference Volden1999; Rodríguez et al., Reference Rodríguez, González, Alvir, Redondo and Cajarville2003). It is well known that LAB shows higher values of the marker/N ratio than SAB using different markers such as 35S (Merry and McAllan, Reference Merry and McAllan1983), nucleic acids or its derivatives (Legay-Carmier and Bauchart, Reference Legay-Carmier and Bauchart1989; Rodríguez et al., Reference Rodríguez, González, Alvir, Repetto, Centeno and Lamrani2000) or 15N (Rodríguez et al., Reference Rodríguez, González, Alvir, Repetto, Centeno and Lamrani2000). Therefore, the use of marker/N ratios from LAB samples underestimates microbial synthesis and the post-ruminal microbial flow. For this reason, in some studies, microbial synthesis is estimated using both the bacterial populations separately as the reference. However, the separate use of both values does not provide reliable estimates. Rodríguez et al. (Reference Rodríguez, González, Alvir, Repetto, Centeno and Lamrani2000) indicated that the magnitude of the above indicated error can be directly established from the marker/N ratios in both the populations. This estimation may be of interest to evaluate errors of previous data and to simplify future studies. In addition, evidence that 15N enrichments are correlated between both the bacterial populations can be derived from the data of 15N enrichment of Rodríguez et al. (Reference Rodríguez, González, Alvir, Repetto, Centeno and Lamrani2000). The objective of this study was to measure the underestimations for the SAB nutrient supply when LAB are used as the microbial reference and 15N as marker. This objective was tackled also by including previous data of Rodríguez et al. (Reference Rodríguez, González, Alvir, Repetto, Centeno and Lamrani2000), obtained using the same methods.
Material and methods
Experiments, animals and diets
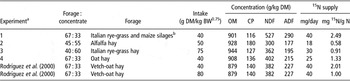
The samples of LAB and SAB were isolated in four experiments conducted for in situ feed evaluation and used for this study. The four experiments were carried out with different groups of three wethers equipped with rumen cannulas (internal diameter 80 mm) and fed with mixed diets. These diets were designed in agreement with the objectives of the specific in situ feed-evaluation studies. In Experiments 1 and 4, only one diet in each experiment was used, whereas Experiments 2 and 3 were carried out with a 3 × 3 Latin-square design to compare the three diets in which the concentrate included soyabean meal (Experiment 2) or sunflower meal (Experiment 3) untreated or treated successively with solutions of acids and heat to protect their proteins. In Experiment 2, two solutions of malic acid (1.125 and 2.25 M) were used (Ouarti et al., Reference Ouarti, González, Fernández, Alvir and Rodríguez2006), whereas 0.666 M solutions of orthophosphoric acid or malic acid were used in Experiment 3 (Arroyo and González, Reference Arroyo and González2009). Details of all these diets are shown in Table 1 together with those of Rodríguez et al. (Reference Rodríguez, González, Alvir, Repetto, Centeno and Lamrani2000) used in the regression studies. In all these experiments, the diets were fed in six equal meals/day (at intervals of 4 h, starting at 0900 h). Animals were housed in individual pens and handled according to the principles of animal care published by the Spanish Royal Decree 1201/2005 (Boletín Oficial del Estado, 2005). This study was approved by the Committee of Ethics, Departamento de Producción Animal, Universidad Politécnica de Madrid.
Diet characteristics of the different experiments

DM = dry matter; OM = organic matter.
aAdditional details of diets used in Experiments 1, 2 and 3 are shown in González et al. (Reference González, Faría-Mármol, Rodríguez, Ouarti, Alvir and Centeno2006), Ouarti et al. (Reference Ouarti, González, Fernández, Alvir and Rodríguez2006) and Arroyo and González (Reference Arroyo and González2009), respectively.
b1 : 1 on a DM basis.
Experimental procedures
In the four experiments, ruminal bacteria were labelled with (15NH4)2SO4 solutions (98% atoms enriched), whereas in the experiments of Rodríguez et al. (Reference Rodríguez, González, Alvir, Repetto, Centeno and Lamrani2000) the enrichment was 50%. Marker solutions were continuously infused into the rumen at rates of 400 ml/day (Experiment 1), 200 ml/day (Experiment 2) and 250 ml/day (Experiments 3 and 4), from at least 14 days before rumen sampling. Infused doses (per animal) were 40, 18, 30 and 25 mg 15N/day, in Experiments 1, 2, 3 and 4, respectively. These doses were established taking into account the intake level as well as the diet CP concentration and its predictable degradability to obtain different 15N bacteria-enrichments. The range of 15N bacteria-enrichment reported by Rodríguez et al. (Reference Rodríguez, González, Alvir, Repetto, Centeno and Lamrani2000) was enlarged with Experiments 1 and 2. In Experiments 3 and 4, the purpose was to obtain 15N bacteria-enrichments to be included into this range. Bacteria isolation was carried out with the same method in all experiments. The rumen was manually emptied just before the 0900 h meal. The ruminal content from each wether was homogenised and 1.2 kg sample (fresh matter) of rumen digesta was squeezed through a double layer of nylon cloth with pore sizes of 46 μm. Retained particles (enclosed in the cloth) were subjected to three successive cycles of washing and shaking in a total volume of 700 ml of saline solution (0.9% NaCl) from 4°C to 5°C to remove LAB. After this process, rumen liquid and saline-wash fractions were subjected to a double centrifugation (500 × g for 10 min and 25 400 × g for 15 min; from 0°C to 5°C) to isolate LAB samples. The pellet collected from the first centrifugation was added to the solid digesta sample before detachment of adherent bacteria following the method described by Merry and McAllan (Reference Merry and McAllan1983). For this purpose, the solid digesta was re-suspended in saline solution (200 ml/100 g) and homogenised. The homogenate was pummelled for 6 min in a Stomacher (IUL S.A., Barcelona, Spain) and squeezed as described for the rumen content. The SAB samples were isolated from this liquid by the centrifugation procedure indicated above. Isolates of SAB and LAB were lyophilised and analysed for organic matter (OM), total lipids, N, 15N abundance and amino acids (AAs). A more detailed description of this procedure is described by Rodríguez et al. (Reference Rodríguez, González, Alvir, Repetto, Centeno and Lamrani2000).
Chemical analyses
Samples of SAB and LAB were analysed for the concentration of dry matter (DM; procedure 934.01; Association of Official Analytical Chemists (AOAC), 2000), ash (procedure 967.05; AOAC, 2000) and CP (N × 6.25; procedure 968.06; AOAC, 2000), using a Leco FP-528 combustion analyzer (Leco Corp., St. Joseph, MI, USA). Lipids in bacterial samples were extracted with a chloroform–methanol mixture (2 : 1, vol/vol) as described by Folch et al. (Reference Folch, Lees and Sloane Stanley1957). The isotope (15N) abundance was determined by mass spectrometry (VG Prism II IRMS, VG Isotech, Middlewich, Cheshire, UK, linked in series to a Dumas-style N analyser EA 1108, Carlo Erba Instrumentazione, Milan, Italy). Duplicate analyses of AA were done after acid hydrolysis using norleucine (Experiments 1, 2 and 3) or alpha-aminobutyric acid (Experiment 4) as internal standards. Therefore, the study did not include tryptophan. This hydrolysis was preceded by an oxidation with performic acid to obtain methionine and cysteine values. These analyses were performed by ion exchange chromatography and derivation with ninhydrin in an AA auto-analyser (Beckman Instruments, Inc., Palo Alto, CA, USA) in Experiments 1, 2 and 3, and by using a Waters (Milford, MA, USA) HPLC system, after derivatising AAs with 6-aminoquinolyl-N-hydroxysuccinimidyl carbamate, in Experiment 4.
Statistical analysis
Comparisons between LAB and SAB were made by ANOVA with a design of complete blocks in Experiments 1 and 4, and with a split-plot arrangement of treatments in Experiments 2 and 3. In these last analyses, the diet was the whole-plot treatment, which was tested using animal × diet interaction as the error term. Type of bacteria and the interaction with diet were the sub-plot treatments. Owing to the fact that animals were adult and maintained in a controlled environment, the period effect was assumed to be negligible in Experiments 2 and 3.
A regression study to relate 15N enrichments in SAB (y) and LAB (x) was carried out by using the model:

where yij is the value of SAB enrichment for observation j in experiment i; ti the effect of experiment i; β 0, β 1 and β 2i the regression parameters; xij the value of LAB enrichment for observation j in experiment i; (t × x)ij the interaction of experiment × LAB; εij the random error.
The regression study was carried out with the data of Experiments 1 and 2 and those of Rodríguez et al. (Reference Rodríguez, González, Alvir, Repetto, Centeno and Lamrani2000), and the obtained equation was validated using the data of Experiments 3 and 4 as indicated by Montgomery and Peck (Reference Montgomery and Peck1982). The above regression model was also applied to all these data to confirm the possible effects of the experiment and interaction.
Effects of the factors were declared significant at P < 0.05, unless otherwise noted, and trends were discussed at P < 0.10. All the statistical analyses were done using the SAS for Windows, version 6.12 (SAS Institute Inc., Cary, NC, USA).
Results
The mean chemical compositions of LAB and SAB isolates are presented in Table 2. In Experiments 2 and 3, no effects were detected for either the diet or its interaction with the bacteria type and therefore these results are not shown. Concentrations of OM and total lipids in SAB were significantly higher than in LAB. In fact, lipid concentration in SAB doubled those of LAB (192 v. 95 g/kg DM, as average of these four experiments). When data were expressed as lipid-free, the mean ash concentration of SAB was 68.6% of that of LAB. No differences were observed in the CP concentration between both the populations, except in Experiment 3 with higher values in SAB than in LAB. The AA-N/total N ratio in SAB was significantly higher than in LAB, except for Experiment 4 (P = 0.09) because of the high standard error recorded.
Differences in chemical composition of bacteria isolated from the solid and liquid fractions of the rumen content

SAB = solid-associated bacteria; LAB = liquid-associated bacteria; OM = organic matter; DM = dry matter; AA = amino acids.
1Atoms%.
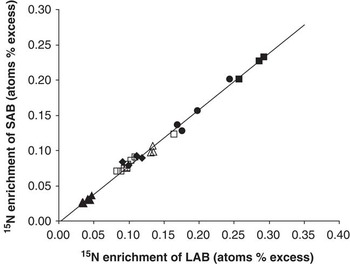
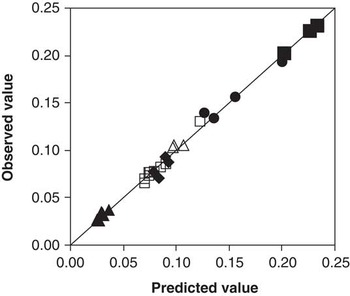
The 15N enrichment was significantly lower in SAB than in LAB. The regression–covariance analyse of the values of Experiments 1 and 2 together with the values of Rodríguez et al. (Reference Rodríguez, González, Alvir, Repetto, Centeno and Lamrani2000) showed a linear relationship (n = 20; P < 0.001; R 2 = 0.996) between the 15N enrichment of SAB and LAB (Figure 1), without effects for the experiment (P = 0.90) or the interaction LAB × experiment (P = 0.82). The intercept of this equation was not different from zero. The statistics for the validation of this equation with data from Experiments 3 and 4 (n = 12) showed low values for both the mean regression error (0.4624 × 10⁻²) and the relative mean regression error (5.29%). In this way, the inclusion in the regression equation of data from these last experiments hardly changed its parameters (see Figure 1). No effects for the experiment (P = 0.831) or the interaction LAB × experiment (P = 0.683) were detected in the regression obtained including all the experiments. Deviations between predicted and analysed SAB values for all these data are presented in Figure 2.
Relationships between the enrichment (15N/N; atoms% excess) of solid-associated bacteria (SAB) and liquid-associated bacteria (LAB). Data from Rodríguez et al. (Reference Rodríguez, González, Alvir, Repetto, Centeno and Lamrani2000): (●) and (⧫) at low-and high-intake levels, respectively. Experiment 1, (▪); Experiment 2, (▴); Experiment 3, (□); Experiment 4, (▵). Equations: (1) Y = −0.0017 (s.e. = 0.0019) + 0.800X (s.e. = 0.0124); n = 20; R 2 = 0.996; P < 0.001. Obtained from data of Rodríguez et al. (Reference Rodríguez, González, Alvir, Repetto, Centeno and Lamrani2000) and Experiments 1 and 2. (2) Y = −0.0011 (s.e. = 0.0016) + 0.795X (s.e. = 0.0117); n = 32; R 2 = 0.994; P < 0.001. Obtained from data of Rodríguez et al. (Reference Rodríguez, González, Alvir, Repetto, Centeno and Lamrani2000) and Experiments 1, 2, 3 and 4. Both equations are graphically superimposed.

Relationship between predicted and determined values of 15N enrichment of solid-associated bacteria. Data from Rodríguez et al. (Reference Rodríguez, González, Alvir, Repetto, Centeno and Lamrani2000): (●) and (⧫) at low-and high-intake levels, respectively. Experiment 1, (▪); Experiment 2, (▴); Experiment 3, (□); Experiment 4, (▵); values obtained applying equation (2) of Figure 1).

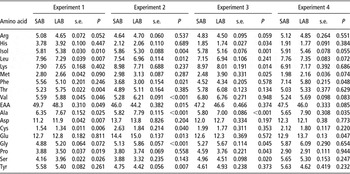
Differences in the AA profiles between SAB and LAB showed some agreements across experiments (Table 3). Among essential AA, higher proportions in SAB than in LAB were observed for isoleucine, although in Experiment 4 it was observed only as a tendency (P = 0.055), and for leucine, although this difference was only numerical in Experiment 3 and as a tendency in Experiment 4 (P = 0.072). This same behaviour was shown for phenylalanine, although the indicated effect was only demonstrated in Experiments 2 and 4. Contradictory results among experiments were observed for methionine. The most systematic effect among non-essential AA was in alanine, in which proportions were consistently lower (between 17% and 30%) in SAB than in LAB. Cysteine proportions were higher in SAB than in LAB although differences were only numerical in Experiments 3 and 4. Essential AA was higher in SAB than in LAB; however, differences were low and only significant in Experiments 1 and 2, and as a tendency in Experiment 4 (P = 0.085).
Amino acid composition (% of total analysed amino acids) of bacteria isolated from the solid and liquid fractions of rumen content

SAB = solid-associated bacteria; LAB = liquid-associated bacteria; EAA = essential amino acids; Arg = arginine; His = histidine; Isol = isoleucine; Leu = leucine; Lys = lysine; Met = methionine; Phe = phenylalanine; Thr = threonine; Val = valine; Ala = alanine; Asp = aspartic acid; Cys = cysteine; Glu = glutamic acid; Gly = glycine; Pro = proline; Ser = serine; Tyr = tyrosine.
Discussion
Differences between SAB and LAB for some chemical fractions and the microbial marker/N ratio lead to underestimate the nutrient supply from SAB if LAB are used as the reference. However, the close relationship found between the 15N enrichment of both the bacterial populations allows determining the magnitude of these underevaluations on the basis of their differences in composition.
Higher concentrations of OM and total lipids in SAB compared with LAB agree with previous results (Merry and McAllan, Reference Merry and McAllan1983; Legay-Carmier and Bauchart, Reference Legay-Carmier and Bauchart1989; Rodríguez et al., Reference Rodríguez, González, Alvir, Repetto, Centeno and Lamrani2000). Merry and McAllan (Reference Merry and McAllan1983) associated the differences in lipid concentrations with a higher concentration in lipids or microbial lipid precursors (acetate, fatty acids) in the microenvironment of SAB, which can lead to an increase in lipid synthesis and adsorption of fatty acids onto bacterial cells. On the basis of differences in concentrations of lipids, alanine and diaminopimelic acid between SAB and LAB, Rodríguez et al. (Reference Rodríguez, González, Alvir, Repetto, Centeno and Lamrani2000) associated the higher lipid concentration in SAB with higher proportions of Gram-negative bacteria in SAB than in LAB. Lipids are mainly associated with the phospholipid layer of the bacterial cell wall, which is single in Gram-positive bacteria and double in Gram-negative bacteria. Consequently, lipid concentration in the cell wall is markedly lower in Gram-positive bacteria (Cummins, Reference Cummins1989). Rodríguez et al. (Reference Rodríguez, González, Alvir, Repetto, Centeno and Lamrani2000) indicated that the higher lipid concentration in SAB than in LAB contributed 44.7% to the difference in OM concentration. The average of the four experiments in this study gave a similar value (46.7%). The higher lipid content together with the lower ash concentration in SAB than in LAB are the main causes of the higher OM concentration of SAB.
Literature data on CP concentrations in SAB and LAB are inconsistent; although some authors observed no differences (Bauchart et al., Reference Bauchart, Legay-Carmier, Doreau and Jouany1986; Craig et al., Reference Craig, Brown, Broderick and Ricker1987; Cecava et al., Reference Cecava, Merchen, Gay and Berger1990; Rodríguez et al., Reference Rodríguez, González, Alvir, Repetto, Centeno and Lamrani2000), others observed lower CP concentrations either for LAB (Benchaar et al., Reference Benchaar, Bayourthe, Vernay and Moncoulon1995) or SAB (Merry and McAllan, Reference Merry and McAllan1983; Komisarczuk et al., Reference Komisarczuk, Durand, Beaumatin and Hannequart1987). The large variation for ash and lipid concentrations recorded among experiments and between both the bacterial populations, as shown in this study, may contribute to this disagreement in the literature.
The higher AA-N /total N ratio in SAB compared with LAB agrees with previous results (Lalles et al., Reference Lalles, Poncet and Toullec1992; Benchaar et al., Reference Benchaar, Bayourthe, Vernay and Moncoulon1995; Yang et al., Reference Yang, Beauchemin and Rode2001; Korhonen et al., Reference Korhonen, Ahvenjärvi, Vanhatalo and Huhtanen2002), indicating a higher true-protein concentration in SAB compared with LAB. Rodríguez et al. (Reference Rodríguez, González, Alvir, Repetto, Centeno and Lamrani2000) reported that this effect is because of the higher ruminal turnover rate imposed to LAB. The ruminal turnover rate directly affects the microbial growth rate. In turn, a faster growth rate exponentially increases the cell mass and the RNA and protein concentrations of bacteria. Nevertheless, the RNA concentration increases faster than the cell mass, as a consequence of the higher requirements of protein synthesising machinery associated with a higher growth rate, whereas protein concentration increases slower than the cell mass (Neidhardt et al., Reference Neidhardt, Ingraham and Schaechter1990). Therefore, the increase of the growth rate or of the turnover rate of bacteria medium implies a higher concentration in RNA and consequently a lower true-protein concentration in bacteria (Bates et al., Reference Bates, Gillett, Barao and Bergen1985; Rodríguez et al., Reference Rodríguez, González, Alvir, Repetto, Centeno and Lamrani2000).
The lower 15N enrichment in SAB compared with LAB has been associated with a higher incorporation of AA by SAB (Komisarczuk et al., Reference Komisarczuk, Durand, Beaumatin and Hannequart1987; Carro and Miller, Reference Carro and Miller2002) and with a lower 15N/N ratio in ammonia molecules in the microenvironment of SAB, as a consequence of diffusion difficulties within this microenvironment (Rodríguez et al., Reference Rodríguez, González, Alvir, Repetto, Centeno and Lamrani2000). The relationship indicated in Figure 1 shows the difficulty of SAB to fix ammonia from the rumen liquid ammonia pool (in which the infused dose is diffused) and suggests that 20% of N fixed by SAB is not obtained from this pool, which is in line with the latest hypothesis. Also, the relations in the nutrient supply among the different species of microbial consortia can increase the possibilities of SAB to capture more non-enriched ammonia derived from the local degradation than LAB. However, this relationship does not support the former hypothesis, because effects of a direct incorporation of AA would be irrespective of the 15N infusion doses (ranging in this study from 18 to 40 mg 15N/day) or of the infused-15NH3/total NH3 ratio in the rumen fluid, which would be reflected in the 15N enrichment of LAB. Thus, a close correlation (r = 0.989; P < 0.001) was shown between mean values of LAB enrichment and the 15N dose, expressed as a proportion of the total diet N supply.
The high precision of the 15N analysis should contribute to the very high coefficient of determination of equations in Figure 1 in spite of incorporating data from different experiments. The recorded data variations among diets and/or animals also contribute to it, although data of Experiment 4 showed little variation. The intercept of these equations is near and not different from zero, which is biologically supported. The statistic validation of the first equation showed that 15N enrichment/N in SAB can be predicted, which may simplify the determination of the microbial protein synthesis. In addition, equations show that the quotient SAB/LAB for the ratio 15N enrichment/total N seem to be irrespective of animals, diets and 15N infused doses within the range of the experimental conditions used.
These equations also allow in estimating the underevaluation error (∇) of the N (or CP) supply to the animal from the synthesised SAB when LAB are used as the reference, because it can be estimated using the following expression:
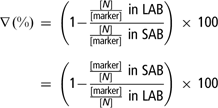
The marker concentration should be substituted by the 15N enrichment when 15N is used as the marker, as in this study. On the basis of the equation of Figure 1 obtained with all values (n = 32), this underevaluation error varied from 20.9% to 23.7% through the range of the LAB-15N enrichment observed. However, when 15N is not infused, the enrichment of both the bacteria types should be zero. Thus, without the independent term, the slope of the equation was 0.788 and, therefore, the above error will be a constant value: 21.2%. Mean values for this error calculated from data (n = 33) reported in cows (Martin et al., Reference Martin, Williams and Michalet-Doreau1994; Yang et al., Reference Yang, Beauchemin and Rode2001; Ahvenjärvi et al., Reference Ahvenjärvi, Vanhatalo and Huhtanen2002; Reynal et al., Reference Reynal, Broderick and Bearzi2005; Brito et al., Reference Brito, Broderick and Reynal2006, Ipharraguerre et al., Reference Ipharraguerre, Reynal, Liñeiro, Broderick and Clark2007), steers (Beckers et al., Reference Beckers, Thewis, Maudoux and Francois1995), sheep (Martín-Urúe et al., Reference Martín-Urúe, Balcells, Zakraoui and Castrillo1998; Chicunya and Miller, Reference Chicunya and Miller1999; Rodríguez et al., Reference Rodríguez, González, Alvir, Repetto, Centeno and Lamrani2000; Ramos et al., Reference Ramos, Tejido, Martínez, Ranilla and Carro2009 and data of this study) and in vitro (Komisarczuk et al., Reference Komisarczuk, Durand, Beaumatin and Hannequart1987; Ranilla et al., Reference Ranilla, Carro, López, Valdés, Newbold and Wallace2000; Carro and Miller, Reference Carro and Miller2002) ranged from 5.0% to 56.7% and averaged 19.6%, (CV = 56.4%), which is close to the error determined in this study. This high variability seems to be associated with the enrichment of the 15N source, which varied from 10% to 99% in the above cited studies.
The underevaluation derived from the equation between LAB and SAB enrichments obtained in this study, together with a good knowledge on the proportion of both the bacterial populations in the post-ruminal flow, can be used to obtain more accurate estimates of the microbial protein synthesis in the rumen. Unfortunately, information about the contribution of SAB and LAB (or other microorganisms) to the microbial flow from the rumen is still scarce. Therefore, more attention is required on this subject to facilitate the application of this correction. Nevertheless, even if this knowledge is not available, the use of a combined index obtained on the basis of the presumable proportions of both the bacteria types in the rumen outflow leads to much more accurate estimates of the microbial protein synthesis than those obtained using them separately (Fernandes, Reference Fernandes2007).
The expression indicated above to estimate the underevaluation of N supply from SAB can also be used in a similar manner to obtain similar estimates for protozoa. Protozoa have 15N enrichments lower or similar than SAB (Firkins et al., Reference Firkins, Berger, Merchen, Fahey and Mulvaney1987; Martin et al., Reference Martin, Williams and Michalet-Doreau1994; Reynal et al., Reference Reynal, Broderick and Bearzi2005). Thus, the final underevaluation of the microbial protein synthesis using LAB as the reference should be greater than the error discussed above considering only SAB.
The considered underevaluation of the protein supply to the animal from SAB will be larger if expressed as truly protein, because of the lower true-protein concentration in LAB than in SAB. In these terms, this underevaluation ranged across the four experiments from 26.8% to 40.8% and averaged 32.5% (s.e. = 3.04).
The differences in AA composition between SAB and LAB may be a consequence of differences in multiple factors (type of bacteria (Gram-positive or Gram-negative), species distribution, growth rate and state, etc). However, the similar variations observed across experiments for some AA seem to indicate some constancy in these differences. The results show a good agreement with those obtained at two intake levels by Rodríguez et al. (Reference Rodríguez, González, Alvir, Repetto, Centeno and Lamrani2000). Thus, only some partial divergences were observed for methionine and threonine among essential AA. The differences in the essential AA profiles also agree with those shown by Korhonen et al. (Reference Korhonen, Ahvenjärvi, Vanhatalo and Huhtanen2002), except for isoleucine and cysteine. These authors did not show changes for both AAs between both the populations, whereas they were greater in SAB than in LAB in our study. Martin et al. (Reference Martin, Bernard and Michalet-Doreau1996), also showed a higher cysteine concentration in SAB than in LAB. Among non-essential AA, results of alanine support the hypothesis of a lower proportion of Gram-positive species in SAB than in LAB, as indicated by Rodríguez et al. (Reference Rodríguez, González, Alvir, Repetto, Centeno and Lamrani2000). d- and l-alanine levels represent 50% of the murein AA, and the thickness of the murein layer in the cell wall is between 8 and 40 times higher in Gram-positive than in Gram-negative bacteria. As a consequence, murein forms a large proportion of the cell wall in Gram-positive organisms (50% or more), whereas in Gram-negative it forms usually <10% of the cell wall, and sometimes only 1% (Cummins, Reference Cummins1989). Furthermore, higher systematic concentrations of alanine have been observed in LAB (Lalles et al., Reference Lalles, Poncet and Toullec1992; Martin et al., Reference Martin, Bernard and Michalet-Doreau1996; Rodríguez et al., Reference Rodríguez, González, Alvir, Repetto, Centeno and Lamrani2000; Yang et al., Reference Yang, Beauchemin and Rode2001; Korhonen et al., Reference Korhonen, Ahvenjärvi, Vanhatalo and Huhtanen2002). Differences in AA composition between both the bacteria types may also affect the estimation of the AA supply from SAB when LAB are used as the reference sample. Although, on the basis of our results an additional variation of this error can be expected for some essential AA, more studies are required to confirm the possible errors and to precise their magnitude.
Less attention has been paid to the supply of microbial lipids to the ruminant in comparison with proteins. However, our results also show large errors for the lipid supply from SAB when LAB are used as the reference. Thus, based on the initial underevaluation of 21.2% for CP and the concentration of both CP and lipids in both the bacterial populations, this underevaluation ranged from 55.2% to 63.3%, and averaged 59.6% (s.e. = 1.72) in these four experiments.
Conclusions
There are some differences in chemical composition between LAB and SAB affecting microbial nutrient flow estimates when LAB isolates are used as the reference samples. Especially, the lower 15N/total N ratios in SAB determine large underevaluations of the nutrient supply to the ruminant from SAB. This underevaluation can be predicted for CP (21.2%), without isolating and examining SAB, using 15N as the marker. These underevaluations will be larger for the supply of true protein (32.5%) and lipids (59.6%) as a consequence of the higher concentrations of true protein and lipids in SAB compared with LAB. These observations may be considered to obtain more accurate estimates of the microbial nutrient supply, and to improve the accuracy in protein evaluation for ruminants.
Acknowledgements
Financial support was provided by the CICYT funded Projects AGL 2001-3662, AGL 2005-01712 and AGL 2006-08300. Analyses of 15N isotope ratios were performed at the Servicio Interdepartamental de Investigación, Universidad Autónoma de Madrid, Spain.