1 Introduction
1.1 Aim
This paper explores the application of an autocorrelation measure in quantifying some aspects of glottalization (complete or partial glottal closure) in natural English speech. The measure is illustrated by applying it to an existing corpus of recordings which had already been used in a sociophonetic study where glottalization was one among several target variables analysed auditorily.
1.2 Glottalization
In this paper we use the term ‘glottalization’ to mean a relatively extensive short-term gesture in the direction of glottal closure, associated with a specific phonological segment. A related and partly overlapping term is ‘laryngealization’, which is sometimes applied only to relatively mild degrees of glottal constriction such as found in creaky voice (Ladefoged & Maddieson Reference Ladefoged and Maddieson1996: 48), but is used by Laver (Reference Laver1994: 330–333) for the full continuum of constriction gestures including complete glottal stop. Glottalization in the sense intended here is attested in numerous varieties of English as an accompaniment to, or as a complete replacement for, certain voiceless oral stops, as the result of two (optional) processes applying in different environments which have been termed ‘glottal reinforcement’ (or ‘pre-glottalization’ or simply ‘glottalization’) and ‘glottal replacement’ (or ‘glottaling’), respectively (Laver Reference Laver1994: 332). The terms ‘glottal reinforcement’ and ‘glottal replacement’ will be used in this paper.
For both cases, the glottal articulation which occurs is commonly described as a complete glottal closure and transcribed with [ʔ], the IPA symbol for a full glottal stop. Thus the word butter after the application of glottal replacement of /t/ may be represented [ˈbʌʔə], and the word right after the application of glottal reinforcement as [raɪʔt] (Wells Reference Wells2008: 345), it being understood in the case of glottal reinforcement that the closures of the glottal stop [ʔ] and the oral stop [t], though formed and released in sequence, overlap for an interval of time, during which it would be more accurate to speak of a double articulated stop phase which could be represented [
 ]. The use of the symbol [ʔ] in these representations appears to imply a period of complete glottal closure. There are reasons to doubt, however, how often such ‘canonical’ glottal plosives appear in allophonic reflexes of oral stop consonants in natural English speech, the glottalization being commonly signalled instead by a period of audibly modified (‘laryngealized’) voicing in an otherwise relatively open vowel-like configuration.
Taking first the case of glottal replacement, previous studies, as well as our own data reported below, indicate that realization in the form of complete glottal closure (with a clearly defined hold phase, and possibly a release burst) is apparently rather rare. For example, Docherty & Foulkes (Reference Docherty, Foulkes, Foulkes and Docherty1999a) report a majority of tokens without a defined hold phase; see also Pierrehumbert & Talkin (Reference Pierrehumbert, Talkin, Docherty and Ladd1991). Two observations may be made here. First, if glottal closure is regarded as an articulatory target, it is – like any stop closure – easily achieved under deliberate control in laboratory conditions; the evident failure to achieve complete glottal closure in natural running speech may be of a piece with the commonly encountered weakening (lenition) which affects oral stop closures too.
Abundant previous research on stops draws attention to the frequency of incomplete closures. Zue & Laferriere (Reference Zue and Laferriere1979: 1042) conclude that ‘the stops can be realized with or without complete closure’, depending on the phonetic environment. Likewise, Crystal & House (Reference Crystal and House1988) refer to their 1982 study (Crystal & House Reference Crystal and House1982), which reported predominantly incomplete stop realizations (55%), in comparison to a figure of 41% reported in their 1988 paper. The weakening can in turn no doubt be partly explained as resulting from the incompleteness of articulatory gestures found very generally in casual speech (Shockey Reference Shockey2003), though Ashby & Przedlacka (Reference Ashby and Przedlacka2011) demonstrate that even slow and formal English speech (isolated words) recorded under monitored studio conditions and published as a model for use with pronunciation dictionaries provides plentiful examples of the same kinds of lenition.
A second observation is that quite apart from casual speech processes, incomplete glottal closure has been reported as the norm for ‘glottal stops’ across a wide range of the world's languages. Ladefoged & Maddieson (Reference Ladefoged and Maddieson1996: 75) say: ‘In the great majority of languages we have heard, glottal stops are apt to fall short of complete closure, especially in intervocalic positions . . .True stops occur reliably only when it is a matter of gemination’. It must be assumed that they mean to refer to realizations observed in citation forms, the type of data on which Ladefoged & Maddieson (Reference Ladefoged and Maddieson1996) is chiefly based, rather than forms affected by casual speech processes.
Turning now to the realizations of glottalization found in the output of the English glottal reinforcement process, there is much less evidence available about whether complete glottal closures are to be found, or whether they too commonly fall short of complete closure. This is probably because the acoustic record alone does not offer much prospect of differentiating between the appearance of a silent hold phase which is due to a sequence of overlapping glottal and oral closures and one that is due to an oral closure alone. As Roach (Reference Roach1979: 3) noted, the relevant events ‘take place in silence and can therefore not be detected by acoustic means’. Roach (Reference Roach1979) did gather production data from simultaneous photo-electric glottography, electro-palatography, and labiography which points to the occurrence of complete glottal closure ahead of oral closure in at least some instances, but it should be noted that this was for words read from a list by one subject (the experimenter himself).
Laver (Reference Laver1994: 332) gives the opinion that ‘[i]n some speakers of Received Pronunciation, complete glottal closure does not appear to be reached, at least not before the oral closure for the following stop is achieved’, though he does not state the evidence upon which this is based, nor any reason for restricting the observation specifically to Received Pronunciation. He goes on to add ‘[i]n such cases, the laryngealizing tendency will be audible as a secondary articulation on the segments preceding the oral stop’, but we might point out that a complete glottal closure, if present, is also likely to be made audible in exactly the same way, as a result of its laryngealizing effect on the preceding segments. There is certainly no reason to suppose that the effects of a complete glottal closure will spread any less freely into other parts of the host syllable that those of an incomplete closure. For our present purposes it is not necessary to make any specific assumption about whether instances of pre-glottalization involve total closure or not.
For the remainder of this paper, ‘glottalization’ will be used in the sense of a relatively localized interval in the signal associated with an underlying /t/ segment, which consists of – or includes – laryngealized voicing, and which is heard (by phonetically-trained listeners) as an instance of ‘glottal stop’, [ʔ]. For each of the tokens we examine, whatever its precise realization, we assume that an equivalent and not necessarily discriminable alternative realization incorporating a canonical glottal stop closure would be possible. Only those intervals of glottalization associated with realizations of underlying /t/ are considered here; we do not consider ‘glottal stops’ which are associated with no underlying segment, and which may be inserted optionally before a syllable-initial vowel in the so-called ‘hard onset’ or ‘hard attack’ (Wells Reference Wells2008: 367). It is an open question to what extent the realizations of those glottal stops resemble the ones reported here. Nor do we specifically consider glottalization (laryngealization) in its role as a phonatory adjustment (as in creaky voice).
1.3 Previous work on acoustics and perception of glottalized intervals
1.3.1 Natural speech
Reported acoustic manifestations of glottalization are very diverse and previous investigations of glottalization have used a variety of indicators to establish its presence or absence in the speech signal. Using acoustic data, Docherty & Foulkes (Reference Docherty and Foulkes1999b) report three degrees of voicing and presence or absence of stop bursts in their Newcastle tokens. In Dilley, Shattuck-Hufnagel & Ostendorf (Reference Dilley, Shattuck-Hufnagel and Ostendorf1996) and in Redi & Shattuck-Hufnagel (Reference Redi and Shattuck-Hufnagel2001), a combination of auditory and visual-acoustic criteria was applied, the latter consisting of an inspection of both waveform and spectrographic displays for discernible evidence of glottalization; on this basis, Redi & Shattuck-Hufnagel (Reference Redi and Shattuck-Hufnagel2001) draw attention to several correlates of glottalization such as aperiodicity, lowered f0, or irregularity of shape and amplitude of successive periods. Visual-acoustic criteria have also been employed in an attempt to delimit glottalization sites by Jones (Reference Jones2007) who combines them with f0 measurements; and for segmentation purposes in larger-scale studies, where glottalization is one of the possible realizations of the underlying voiceless alveolar stop (Zue & Laferriere Reference Zue and Laferriere1979, Zue & Seneff Reference Zue and Seneff1988, Byrd Reference Byrd1994). The last two of these describe data segmented by the same set of criteria used to delimit a regular oral segment boundary. Again, the procedure is a combination of listening to the tokens to be labelled and utilizing visually salient acoustic landmarks. As Zue & Seneff (Reference Zue and Seneff1988) state, in the case of stops ‘the boundary between the closure interval and the release of a stop is an important one that should be assigned’. Although it is not explicitly stated, the implication might be that only complete glottal stops were segmented, with no information as to how the incomplete ones had been handled or whether indeed there were any in the data. Likewise, Zue & Laferriere's (Reference Zue and Laferriere1979) data contains a subset where /t/ before a syllabic nasal ‘is usually realized as a glottal stop with visible glottal irregularities in the preceding vowel’ (Reference Zue and Laferriere1979: 1040). However, they claim that ends and beginnings of segment types are reflected by changes in amplitude and are ‘quite well defined on the spectrograms’. It therefore seems as if the criteria are again visual, and segmentation decisions were based on those glottals that exhibited a well-defined closure. No mention is made of whether any other type was present.
Some of the observed range of variation in acoustic realization may perhaps result from corresponding variation in articulation. Reported variation in glottal articulation has two main aspects: a continuum of degrees of constriction (Esling, Fraser & Harris Reference Esling, Fraser and Harris2005), and the implementation of different production strategies (Roach Reference Roach1980). But it is equally possible that a wide range of superficially dissimilar realizations may result from an essentially uniform underlying gesture.
In summary, it seems that previous work has not established any objective identification and annotation procedure that is applicable to the incomplete and diffuse intervals of glottalization that are apparently common in natural speech, and which we find predominantly in our corpus. As a result, there is little or no reliable information hitherto obtained from acoustic data on the duration of glottal events, since there has been no satisfactory method of demarcating their onsets and offsets. Durational characteristics of the wider class of plosives have received a significant amount of attention (Lisker Reference Lisker and Valdman1972, Zue & Laferriere Reference Zue and Laferriere1979, Luce & Charles-Luce Reference Luce and Charles-Luce1985, Crystal & House Reference Crystal and House1988, Byrd Reference Byrd1994). While some of the allophonic realizations of /t/ in these studies were glottal variants, there is little data specifically on glottals. According to Byrd (Reference Byrd1993), glottal stops have a mean closure duration of 65 ms, but the mention of ‘closure duration’ seems to imply that the commonest type of ‘glottal stop’, which lacks a clear closure, cannot have been included in that figure. Zue & Laferriere (Reference Zue and Laferriere1979) present a hierarchy of durations, ranging from 26 ms to 129 ms, with the nasally released /t/ tokens being on average 65 ms, but they do not distinguish between oral and glottal allophones of /t/. In fact their description of the data suggests that the figures are for both glottal and pre-glottalized tokens which have been treated as a single category.
1.3.2 Perception and synthesis
Research on the perception of glottalization using synthetic stimuli (Hillenbrand & Houde Reference Hillenbrand and Houde1996, Pierrehumbert & Frisch Reference Pierrehumbert, Frisch, van Santen, Sproat, Olive and Hirschberg1997, Shinohara, Huckvale & Ashby Reference Shinohara, Huckvale and Ashby2011) has shown that in the absence of a hold phase, stop-like percepts can be cued by changes in f0, changes in amplitude, or intervals of diplophonia (and by combinations of those factors). However, the factors selected, and the ranges over which they are varied in these experiments, are modelled on relatively few real tokens, which may themselves have been elicited under somewhat unnatural conditions. This raises the question of whether cues which are found to be effective in influencing the perception of synthesized examples will turn out to play similar roles in natural speech. The work reported in this paper will indicate that at least some such cues are not necessarily present in natural examples.
It can be assumed that a canonical glottal plosive, involving both a silent hold phase and a release, whether produced as a deliberate human performance or synthetically, will certainly give rise to a glottalization percept. But presence of glottalization is equally salient to the unaided ear in stimuli which are remote from the canonical pattern. Even expert listeners, far from reporting a range of diverse realizations of glottalization, commonly have the auditory impression of hearing a (voiceless) stop in relation to stimuli which in no way resemble the prototypical sequence of events for a plosive (Docherty & Foulkes Reference Docherty, Foulkes, Foulkes and Docherty1999a, Ashby & Przedlacka Reference Ashby and Przedlacka2011). This encourages a search for a more abstractly characterized auditory property shared by the diverse realizations of glottalization, and the present paper is intended as a contribution towards that search.
1.4 Hypotheses
We wish to establish acoustic properties that are common to the identified range of diverse glottalization events, and we propose irregularity of glottal pulsing (whether irregularity in period, amplitude or waveshape) as a candidate factor having a plausible perceptual interpretation. We hypothesize that the autocorrelation function, a measure of regularity in the speech wave (Holmes Reference Holmes, Mannell and Robert-Ribes1998), should be expected to exhibit minima in the region of glottal manoeuvres. Plotting the short-time peak autocorrelation as a function of time should yield a parameter in which regions of glottalization are readily identified as intervals in which autocorrelation falls to a value markedly lower than in neighbouring non-glottalized voiced regions. Applying this measure to those ‘glottal stops’ which result from glottal replacement of /t/ between sonorants, we should find clearly defined troughs in peak autocorrelation, and the temporal extent of these troughs should give an indication of the duration of the glottalization gesture. Applying the same measure differentially to groups of preglottalized and plain (non-preglottalized) alveolar stops should reveal, for the pre-glottalized category, an interval prior to the onset of complete closure, in which the peak autocorrelation is significantly lower than for the corresponding interval in the plain category.
2 Method and materials
2.1 Corpus and subjects
Data was taken from a corpus of Southern British English previously collected and analysed auditorily for a sociophonetic study which has already been reported in full (Przedlacka Reference Przedlacka2002). In that sociophonetic study t-glottalization was one of a number of phonetic variables which were targeted, and auditory judgements were made of three relevant categories which were noted as glottal stop [ʔ], preglottalized alveolar [ʔt] or plain alveolar stop without glottalization [t]. The subjects in the original study were 22 teenage speakers (12 female, 10 male) of phonologically similar accents, covering London (Cockney), the Home Counties (counties which adjoin London), and Received Pronunciation (RP), a non-localizable variety which is of the same generally southern type. The data, consisting of single words or phrases, was gathered using elicitation methodology in one-to-one interviews. The original analog recordings were made using a Beyer CP340 microphone and Marantz recorder. They are field recordings, made in the subjects’ familiar school setting, and using an entirely spoken procedure (not reading). Overall, there can be little doubt that the recording methodology favoured a relaxed and natural mode of speech. The recordings were subsequently digitized at a sampling rate of 16 kHz, providing an 8 kHz bandwidth, ample for the reanalysis undertaken here. All relevant data from all 22 subjects was re-analysed in the present study. In all, the material furnished almost 600 tokens of non-word-initial /t/, with glottal and pre-glottalized variants as possible allophonic realizations.
In the original project the auditory judgements relating to all tokens for all variables were made by the experimenter herself, who listened to items several times in varied orders to improve reliability. The study included an additional accuracy check on 224 tokens (about 10% of all the data, sampling all the variables) performed by two other trained phoneticians, who transcribed independently. The results showed an overall average discrepancy of 5.35%, constituted by 12 out of 224 tokens where at least one of the two additional judges disagreed with the experimenter's analysis. Category consistency agreement in this checking procedure was higher for consonantal variables (such as glottalization) than for vowel quality variables. The existing judgments of glottalization from the earlier study are thus probably sufficiently reliable to merit a search for quantitative corroboration. Whereas subjects were selected in the earlier study to sample the speech of particular locations, all subjects were considered together for the present investigation. The locality variable tested in the original study was irrelevant, as we had no hypothesis that the varieties exhibited any differences in the acoustic realization of glottalization (though they might differ in the frequency with which it was employed, or the contexts where the glottalization processes applied). There is no difference in age among the subjects, leaving gender as the only relevant category for subdivision of the subjects in what follows. This is done not from any expectation or hypothesis that glottalization would differ by gender, but simply because male–female differences (most notably in fundamental frequency range) make the pooling of data problematic.
2.2 Inspection of waveforms and spectrograms
Considering first intervocalic examples of glottal stop, we note that hardly any of the tokens in our corpus have the canonical form of a silent gap followed by a release burst. In this respect, our data is consistent with previous studies reviewed above.
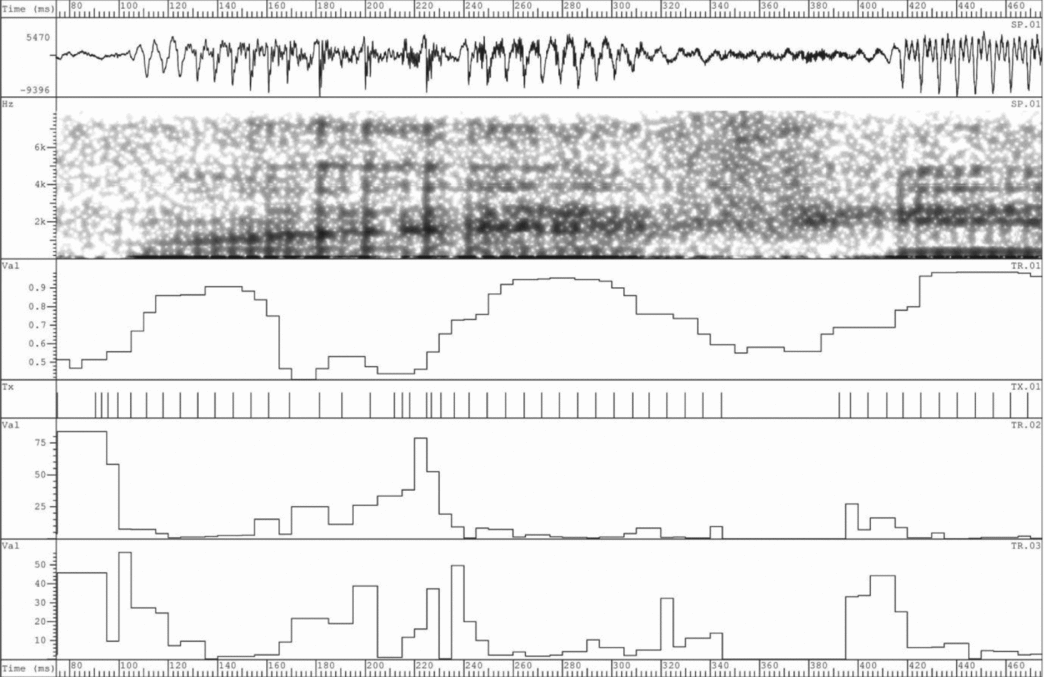
In our data, a range of superficially different variants is present, but even after repeated listening with assistance from waveforms and spectrograms we cannot report that we detect any auditory distinction among the types. Visually some glottal stops appear essentially vocalic in nature with continued voicing and formants (Figure 1); often the formants can be traced making a glide from one vowel quality to another. Other types exhibit varying degrees of visually obvious irregularity in glottal pulsing (Figure 2). Less frequently, tokens also show the presence of higher frequency aperiodicity (noise), or creaky voicing. It may be worth pointing out that since the vocal folds are themselves the articulators there is no difference in principle between a ‘hold’ phase and a single unusually long closed phase in the vibratory cycle. Similarly, there are conditions under which one and the same sequence of events might be described with equal accuracy as an interval of irregular pulsing or as a rapid decline and recovery in f0.
The word butter pronounced by a female speaker, with the intervocalic [t] realized as an interval of glottalization heard as [ʔ], as displayed in SFS. From top, waveform, wideband spectrogram, short-time peak autocorrelation. The autocorrelation reaches 0.9 or more in the two vowels and falls to approximately 0.45 during the glottalization interval (roughly centred around t = 140 ms).

The word whatever pronounced by a male speaker, with the intervocalic [t] realized as an interval of glottalization heard as [ʔ], as displayed in SFS. From top: waveform, wideband spectrogram, short-time peak autocorrelation, estimated pitch epochs, jitter, shimmer (the last two calculated as percentage perturbation relative to a running average from five periods). The autocorrelation reaches 0.9 or more in the three vowels and falls to approximately 0.4 during the glottalization interval (roughly centred around t = 200 ms), a lower value than in the voiced fricative [v] around t = 350 ms.

Thus, like earlier investigators, we find that visual inspection of waveforms and spectrograms reveals a diffuse cluster of acoustic characteristics in the general locality of a glottalization manoeuvre, but that the composition of the cluster is variable, and its temporal extent not at all well-defined.
2.3 Autocorrrelation
The testing of our hypothesis required the addition of an autocorrelation track alongside the audio signal for each token in our corpus. Autocorrelation may be defined as the cross-correlation of a signal with itself at a range of delays. A regularly repeating signal (or indeed any series of sample values) will correlate perfectly with itself when delayed by one whole period of repetition (or by an integral multiple of the period). The autocorrelation function will take a high value (maximum 1) for any signal that is repetitive, or nearly so, and it is therefore a natural measure to apply in looking for repetition (regularity) in a signal. While it is routinely computed as an intermediate step within digital signal processing software (e.g. as a means of extracting f0), there seems to have been little use hitherto in speech research of the autocorrelation function directly. Autocorrelation curves somewhat similar to those we give below have been published by Yegnanarayana et al. (Reference Yegnanarayana, Rajendran, Worku and Dhananjaya2008), though only for a small number of illustrative tokens, and autocorrelation has been used in speech engineering applications as a degree-of-voicing measure – that is, as an indication of how far voicing predominates in the excitation source for speech (Holmes Reference Holmes, Mannell and Robert-Ribes1998). Surana (Reference Surana2006) contains a valuable discussion of methods for automatic detection of irregular pitch periods in speech. In this work we have employed autocorrelation estimation algorithms provided by the Esection and vdegree programs, which are components of the Speech Filing System (SFS) (Huckvale Reference Huckvale2010).
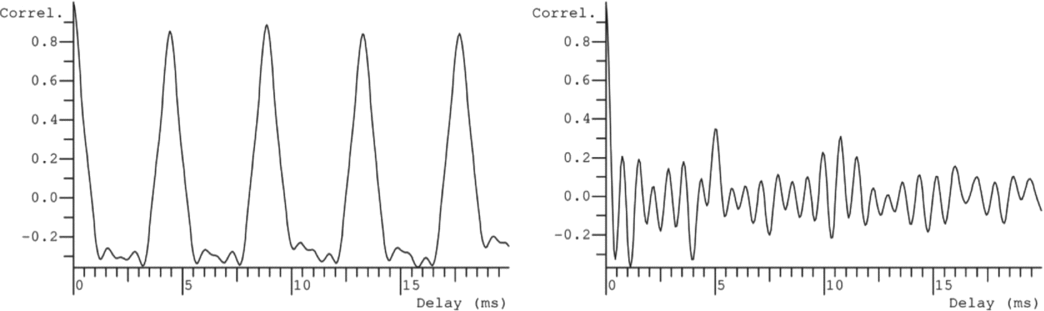
The complete autocorrelation function has three dimensions: at any point in time along the signal, it has a magnitude which varies between +1 and –1 as a function of delay (Figure 3), autocorrelation taking a negative value when the delay is such as to align the alternate half-cycles of an approximately symmetrical wave. But in the work reported here we use the vdegree implementation, which plots the single highest positive peak as a function of time, regardless of delay. The result is effectively a time-varying index of signal regularity. Examples are shown in Figures 1 and 2, which illustrate how, for the intervocalic tokens, the peak autocorrelation does indeed exhibit sharply-defined local minima in the region of the expected glottal events, as predicted. It is striking that the autocorrelation tracks are alike, even though the glottalization events are superficially dissimilar if judged from the appearance of the spectrograms. Both jitter (fluctuation in period) and shimmer (fluctuation in amplitude) are likely to be, in varying proportions, components of the irregularity in vibration, and both of those quantities tend to show peaks during the autocorrelation minimum (Figure 2). However, our proposal in this paper is that perception of glottalization is cued by irregularity as such, rendering it unnecessary for the present purpose to attempt decomposition into jitter, shimmer, and other possible components (such as fluctuation in spectral tilt).
Autocorrelation functions computed at two time points in the signal of Figure 1. Left, regular vibration during a vowel at t = 240 ms, showing peaks at values of delay which are integral multiples of the fundamental period. Right, from the glottalized region at t = 140 ms showing lower autocorrelation during irregular pulsing. Plotting the single highest value from a succession of autocorrelation functions such as these, computed at 5 ms intervals throughout the signal, yields a short-time peak autocorrelation track of the type illustrated in Figures 1 and 2. The algorithm employs a window (maximum delay) of 30 ms.

2.4 Annotation and processing
The troughs in peak autocorrelation seen in Figures 1 and 2 above evidently indicate the onset, temporal extent, and offset of glottalization and lend themselves to annotation. Consequently, for all intervocalic examples that had been heard as [ʔ], annotations were manually placed in pairs (i) at the first sample where the decline in autocorrelation began after a peak in the first vowel, and (ii) at the sample where autocorrelation recovered to a peak in the second vowel. The two annotations can be regarded as marking the beginning and the end of the glottalization manoeuvre for an intervocalic glottal stop.
For the tokens heard as preglottalized alveolar stops, the prediction was that an interval of lower peak autocorrelation should be found at some point prior to the onset of total articulatory closure (regardless of whether that closure was oral, glottal, or a combination of the two). For this, the overall energy track (in conjunction with the spectrogram) was used to place a single annotation at the point where a major drop in energy indicated the location of the onset of total closure.
Scripts written in Speech Measurement Language (SML) (Huckvale Reference Huckvale2010) were then used to aggregate the time-varying data across all available tokens: short-term peak autocorrelation (expressed as a fraction between 0 and 1), f0 (Hz), and energy (in dB relative to an arbitrary reference). For the intervocalic examples, the time interval between the two annotations was recorded and the other properties (autocorrelation, F0 and energy) were then time-normalized for comparison. For the preglottalized or plain alveolar stops, the scripts collected data over a 100 ms interval prior to the annotation placed at the estimated instant of closure, as it was hypothesized that glottalization, if present, should peak during that interval, manifesting itself as a reduction in autocorrelation.
3 Results
3.1 Duration of intervocalic tokens
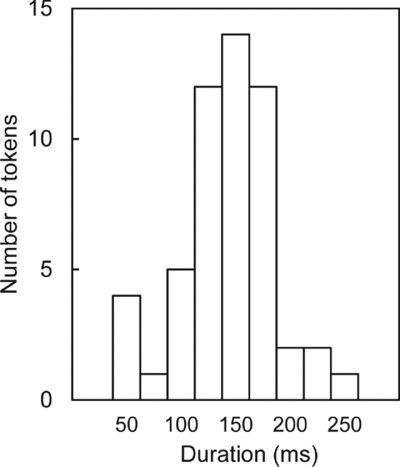
The segmentation protocol given above led to the successful annotation of 53 tokens heard as intervocalic [ʔ], most of which could not have been unambiguously demarcated by any previous segmentation method. (By intervocalic, we mean more strictly located between sonorants, and without regard to word boundaries.) The durations of these tokens (mean = 131 ms; s.d. = 43 ms) are shown in Figure 4, and are sharply clustered. These are of the same order of magnitude as durations reported for consonantal segments generally, though as seen above there is little published data which is directly comparable. It should be recalled that in the present study we are not measuring closure duration but duration of the whole glottal manoeuvre, as evidenced by the autocorrelation minimum. The onset and offset of this period include intervals which one might consider to be transitional periods.
Frequency of intervocalic glottalization intervals as a function of duration (measured as time between pairs of annotation points on the autocorrelation track). Durations have been grouped into bins 25 ms wide. Numbers on the abscissa relate to the upper bound of the bin they label.

3.2 f0 and glottalization
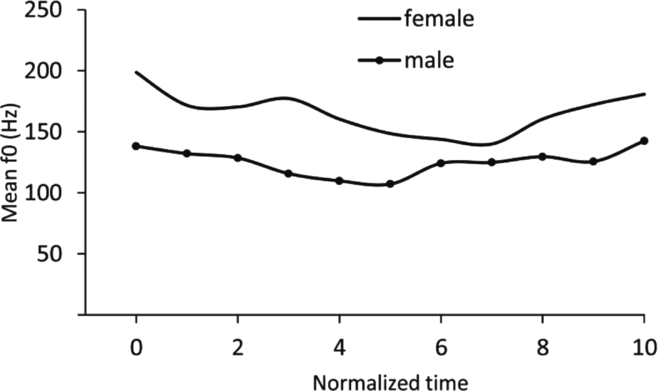
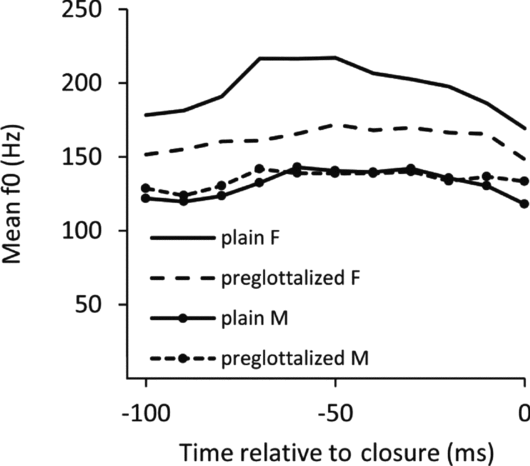
Mean f0 tracks for intervocalic [ʔ] are shown in Figure 5, and for the interval just prior to closure formation in preglottalized and plain [t] in Figure 6. In the intervocalic case, the mean f0 tracks are concave for both males and females, with the lowest mean value being located towards the middle of the normalized duration, and the highest mean values at beginning and end. The values for individual tokens are very scattered, however, and in order to test whether the apparent dip in f0 is reliable, a non-parametric analysis of variance (Kruskal–Wallis) was applied to f0 values from the first, middle and last sample points of the interval. This indicates the presence of a difference for males (p = .02), though not females (p = .231). Some of the variability in f0 must probably be attributed to failures in operation of the f0 estimation algorithm when dealing with a rapidly-changing signal, though of course the same criticism applies equally to other studies. On the whole, the dip in f0 which might be expected from previous studies – particularly synthesis experiments – is only weakly indicated in the present data.
Mean f0 during intervocalic glottalization intervals, time normalized.

Mean f0 in a 100 ms interval before complete closure for groups of [t] tokens judged as plain and preglottalized.

In the case of preglottalized or plain [t] realizations, mean f0 was plotted for the 100 ms interval ahead of the moment of closure, and results are shown in Figure 6. For male speakers, mean f0 is closely similar for plain and preglottalized categories; for female speakers a lowering of f0 in glottalized tokens is evident. A Mann–Whitney U test was applied at the 50 ms point in these curves. This confirms that preglottalized and plain tokens differ in f0 only for female speakers (U = 42,000.5; n1 = 96; n2 = 119; p = .001). For male speakers there is no difference in f0 between the two token types (U = 10,648; n1 = 164; n2 = 129; p = .923). The cause of this male–female difference is unclear. It might indeed be the case that a glottal manoeuvre in the direction of increased constriction is automatically accompanied by f0 lowering for females. But since auditory categorization was equally unproblematic for tokens from males and females, judgement can hardly have been based heavily on f0.
3.3 Energy and glottalization
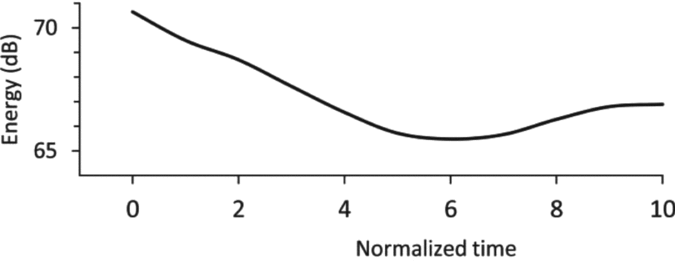
The mean energy over time in intervocalic tokens was plotted in the same manner as for f0 (Figure 7). The mean curve displays a downwards excursion, but this is small in extent compared with the ranges employed in Hillenbrand & Houde (Reference Hillenbrand and Houde1996). Furthermore, a Mann–Whitney U test reveals that the means at times 5 and 10 (mid-point and end of the normalized duration) are not significantly different (U = 1,629; n1 = 53; n2 = 53; p = .156), so the natural examples effectively show a shallow unidirectional drop, not the dip in amplitude found to be effective in synthesis. It is therefore safe to conclude that a dip in energy cannot have played more than a minor role in determining auditory classification of the natural tokens.
Mean energy during intervocalic glottalization intervals, time normalized.

3.4 Autocorrelation: Intervocalic tokens
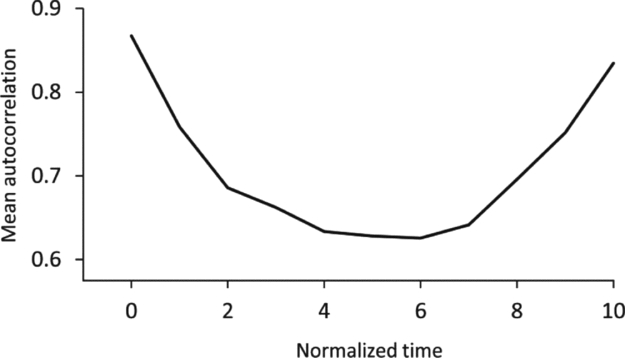
The average peak autocorrelation (Figure 8) suggests, in line with our hypothesis, that the glottal events are characterized as a class by a decline in regularity of vocal fold vibration, followed by recovery. This would be consistent with a production mechanism consisting of a glottal constriction gesture applied and then relaxed (necessarily interacting with individual and gender characteristics, and with the immediate speech context, including prosody). If peak autocorrelation is further viewed as a component of a degree-of-voicing measure, the shape of this curve – from good voicing to less good and back – may help to explain in some degree why intervocalic glottal stops are perceived as ‘voiceless’ even though they fail to exhibit the relatively long period without glottal pulses which is supposedly typical for voiceless segments.
Mean peak autocorrelation during intervocalic glottalization intervals, time normalized.

3.5 Autocorrelation: Preglottalized and plain [t] tokens
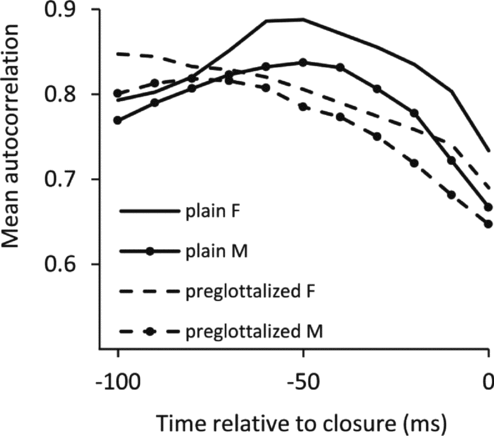
The hypothesis is that tokens which had been judged as preglottalized should as a class exhibit lower peak autocorrelation in the period leading up to closure than the plain alveolars. Figure 9 shows that this is indeed the case for both male and female speakers. Again, a Mann–Whitney U test was applied. At time –50 ms, plain > preglottalized for females (U = 3,777.5; n1 = 96; n2 = 119; p < .001) and males (U = 7,967.59.5; n1 = 164; n2 = 129; p < .001). This supports the proposal that auditory categorization of tokens as preglottalized or plain could be based on an assessment of regularity of vocal fold vibration in an interval just prior to the formation of the complete stop closure.
Mean peak autocorrelation over a 100 ms interval before closure for groups of [t] tokens judged as plain and preglottalized.

The curves for glottalized and plain are robustly distinct over a period of several tens of milliseconds, and the test just applied at –50 ms could be applied with similar results over much of the vowel preceding the stop. It is implausible that the listener's judgment relates to a single point; it is more likely to be affected by the curves as a whole (possibly by the pattern of dynamic change rather than by absolute values). Though there is no doubt about the statistical reliability of the separation of the two groups, the ranges of peak autocorrelation values associated with each group are large and overlapping, and there can be no question, with the present data at least, of establishing a threshold value which will separate glottalized and plain cases. One of the factors which may contribute to this is that both ‘plain’ and ‘glottalized’ categories potentially cover a range of articulatory possibilities which are likely to have varying effects on peak autocorrelation. For example, within the plain category there may be tokens which do not follow the pattern of the canonical voiceless stop. A token with preaspiration or any other aperiodic energy preceding the hold phase will exhibit lower peak autocorrelation at that point, and the application of a simple determinative threshold would wrongly tend to categorize such examples as glottalized. The measurement of peak autocorrelation is thus a valuable adjunct to auditory judgment by trained listeners, but certainly not a replacement for it.
4 Discussion and conclusions
Of the various parameters examined, the autocorrelation function is apparently the most effective and consistent acoustic property for corroborating auditory impressions of glottalization. This is true for both intervocalic examples of single glottal stop, and for glottal gestures which accompany (reinforce) oral articulatory closures. Dips in f0 and energy, which have been found to be effective cues in synthesis, are evidenced weakly, and to some extent inconsistently, in the natural speech data.
The use of natural speech data is a particularly important feature of this study, since glottals are undoubtedly prone to hyperarticulation if elicited under laboratory conditions, bearing in mind that the textbook canonical glottal stop is easily performed and imitated as a non-speech event. The autocorrrelation measure proposed here has given satisfactory results with field recordings which were not originally made with any form of acoustic analysis in mind. In further work we hope to extend it to other corpora, and to legacy data.
We are not the first to suggest that irregularity per se is the unifying characteristic of glottalization. Redi & Shattuck-Hufnagel (Reference Redi and Shattuck-Hufnagel2001: 427) state that a variety of acoustic features may be ‘suggestive of glottalized voice quality, including a drop in f0 or amplitude, or the presence of irregular pitch periods’. Hillenbrand & Houde (Reference Hillenbrand and Houde1996: 1183) mention ‘irregular glottal vibrations that are associated with glottal constriction’. Stevens (Reference Stevens1998: 565) calls attention to glottalization ‘manifested . . . by low-frequency irregular glottal pulses’. But direct use of the autocorrelation function, as advocated and evaluated in the present work, appears to provide a valuable way to quantify and demarcate regions of irregularity. It has the potential to help in the exploration of the acoustic characteristics of other less than fully understood glottal phenomena across languages.