Implications
Soil intake in outdoor rearing systems is a potential route of entry for pollutants into the food chain, especially when the area has been previously exposed to a deposit of pollutants. Although small amounts of soil are always ingested by grazing dairy cows, it is necessary to characterise factors affecting the increase in soil intake and finally to quantify their impact. Such knowledge allows the proposal of management tools aimed at limiting soil ingestion by animals when grazing conditions become worse and to ensure safety of produced food.
Introduction
Soil may voluntarily or involuntarily be ingested by grazing ruminants along with pasture. Voluntary soil intake, or soil licking, is generally induced by a notable deficit in different mineral nutrients, and would rarely concern domestic herbivores (Healy and Ludwig, Reference Healy and Ludwig1965) but mainly wildlife (Kreulen and Jager, Reference Kreulen and Jager1984). Domestic ruminants may ingest soil inadvertently either indirectly, that is, soil particles deposited on vegetation, or when grass is pulled out with its roots and adherent soil particles. This involuntary soil intake by domestic ruminants during grazing can be a potential route of entry for contaminants into the food chain, especially of radionuclides (Beresford and Howard Reference Beresford and Howard1991; Crout et al., Reference Crout, Beresford and Howard1993), metals (Thornton and Kinniburgh, Reference Thornton and Kinniburgh1978; Abrahams and Steigmajer, Reference Abrahams and Steigmajer2003) and persistent organic pollutants (Manz et al., Reference Manz, Wenzel, Dietze and Schüürmann2001; Mamontova et al., Reference Mamontova, Tarascova, Mamontov, Kuzmin, McLachlan and Khomutova2007). Several recent crises implicating hazardous industrial facilities have shown that soil could be a non-negligible risk factor for food-producing and free-range animals when this soil has previously been polluted, particularly with organic pollutants (Thébault Reference Thébault2005; Allard Reference Allard2009). Indeed, soil can accumulate and retain deposited pollutants much longer than other exposed matrices, potentially justifying its central role in food safety issues. Therefore, potential soil intake by grazing dairy cows needs to be refined nowadays in order to be integrated in food safety issues.
Soil intake in wild animals (Beyer et al., Reference Beyer, Connor and Gerould1994), in sheep (Healy et al., Reference Healy, Cutress and Michie1967) or in cattle (Healy Reference Healy1968; Fries et al., Reference Fries, Marrow and Snow1982) can be estimated from marker techniques such as acid-insoluble ash (AIA). Available literature data on soil intake by cattle on pasture are often old and do not allow easy extrapolation to current grazing systems. Some studies were carried out in very extensive grazing conditions (Healy Reference Healy1968; Mayland et al., Reference Mayland, Florence, Rosenau, Lazar and Turner1975). Mayland et al. (Reference Mayland, Florence, Rosenau, Lazar and Turner1975) and Thornton and Abrahams (Reference Thornton and Abrahams1983) estimated soil intake very roughly in herds in which heifers, suckler and dairy cows were mixed, that is, cattle with very different levels of dry matter (DM) intake. Fries et al. (Reference Fries, Marrow and Snow1982) reported a soil intake of less than 1% of total DM intake (i.e. <0.2 kg/day) for dairy cows; however, data obtained for dairy heifers and dry cows suggest higher soil intakes when grazing conditions become worse (3% of DM). Nevertheless, soil intake by grazing cows would vary greatly depending on feeding and management systems. Average daily soil intake hardly exceeded 0.5 kg per cow and some extreme values would barely exceed 1 kg daily (Healy, Reference Healy1968; Thornton and Abrahams, Reference Thornton and Abrahams1983). These levels of soil intake need to be re-evaluated in current outdoor rearing systems, with heavier cows of greater milk yield and DM intake and generally higher grazing pressure potentially increasing the risk of soil intake. Finally, these previous studies determined soil intake by using very roughly estimated input variables, in particular AIA concentrations in soil and feed digestibility. A refined determination of the different input variables allows a more precise estimation of soil intake to be made.
The aim of this study was to evaluate the range of reliable values of soil intake in lactating dairy cows under intensive grazing conditions and to identify possible management strategies in order to limit its intake in the case of crises. We focused on grazing pressure, that is, daily pasture allowance, and on supplementation level as two potential factors affecting the risk of high levels of soil intake.
Material and methods
Two trials with a broad range of grazing conditions were carried out to determine soil intake in grazing dairy cows according to pasture allowance, sward type and maize silage-based supplementation. The two experiments were conducted at the INRA experimental farm of Méjusseaume (1.71°W, 48.11°N, Brittany, France), with loamy soils.
Trial 1
The purpose of Trial 1 was to determine the effects of sward type and pasture allowance on milk production and herbage intake of dairy cows strip grazing in spring (Ribeiro Filho et al., Reference Ribeiro Filho, Delagarde and Peyraud2005). Four treatments were compared with a 2 × 2 factorial arrangement of treatments, with two sward types (RG: pure perennial ryegrass v. GC: perennial ryegrass–white clover mixture) and two pasture allowances (low PA = 20 v. medium PA = 35 kg DM/cow per day above ground level). A total of 24 multiparous Holstein cows in their first half of lactation (105 ± 17 days in milk) and yielding 30.9 ± 3.6 kg of milk were allocated according to their pre-experimental characteristics (days in milk, milk yield, milk fat and protein concentrations, BW) into four homogenous groups and used in a 4 × 4 Latin square design. Cows were not supplemented during the trial. Each period lasted 10 days and all measurements were recorded during the last 5 days of each period.
Two 2-ha paddocks were used: the four treatment groups grazing as separated herds in adjacent sub-paddocks within each 2-ha paddock. The area allocated daily to each treatment was adjusted by means of electric fences from a daily estimate of the pre-grazing pasture mass as described by Ribeiro Filho et al. (Reference Ribeiro Filho, Delagarde and Peyraud2005). Fresh pasture was allocated once daily each morning.
Trial 2
The aim of Trial 2 was to determine the effects of pasture allowance and supplementation level on milk production and herbage intake of dairy cows strip grazing perennial ryegrass swards in autumn (Pérez-Prieto et al., Reference Pérez-Prieto, Peyraud and Delagarde2011). Four treatments were compared with a 2 × 2 factorial arrangement of treatments, with two pasture allowances (medium PA = 40 v. high PA = 65 kg DM/cow per day above ground level) and two supplementation levels (0 v. 8 kg DM of a mixture 7 : 1 of maize silage and soyabean meal). A total of 12 multiparous Holstein cows in late lactation (237 ± 41 days in milk) and yielding 17.9 ± 2.3 kg of milk were allocated according to their pre-experimental characteristics (days in milk, milk yield, milk fat and protein concentrations, BW) into four homogenous groups and used in a 4 × 4 Latin square design. Each period lasted 14 days and all measurements were recorded during the last 5 days of each period.
Two 4-ha paddocks were grazed throughout the experiment: the four treatment groups grazing as separated herds in adjacent sub-paddocks within each 4-ha paddock. The area allocated daily to each treatment was adjusted by means of electric fences from a daily estimate of the pre-grazing pasture mass as described by Pérez-Prieto et al. (Reference Pérez-Prieto, Peyraud and Delagarde2011). Fresh pasture was allocated once daily each morning. Supplement was given individually once daily before the morning milking.
Measurements
Detailed sward and animal measurements related to grazing and feeding management, as well as to milk production and herbage intake were previously described by Ribeiro Filho et al. (Reference Ribeiro Filho, Delagarde and Peyraud2005) for Trial 1 and by Pérez-Prieto et al. (Reference Pérez-Prieto, Peyraud and Delagarde2011) for Trial 2. Briefly, pre-grazing and post-grazing sward heights were measured by means of an electronic platemeter (30 × 30 cm, 4.5 kg/m2, AGRO-Systèmes, La Membrolle, France). Milk production was measured individually at each milking. Pasture intake was determined individually from an ytterbium oxide and faecal index method in Trial 1 and from the n-alkanes technique in Trial 2. Additional or specific measurements in soil, feed and faeces related to soil intake determination are described below.
Soil intake was estimated using the AIA marker, that is, the insoluble and therefore indigestible fraction of the ingested ash. Soil of the A-horizon (0 to 5 cm) was sampled from each paddock through 20 sub-samples homogeneously distributed per hectare according to the French standard methodology (Association Française de Normalisation, 1992) by inserting 5-cm deep moulds (8 cm diameter) into the surface of the earth. After removing plants and roots, soil samples were dried at room temperature, stones larger than 2 mm were removed and the soil was then crumbled and sieved to 1 mm before analyses.
Faeces were sampled twice daily after each milking directly in the rectum of each cow during the last 5 days of each period. This technique avoids any possible faecal contamination by soil during sampling. Faecal samples composited per cow and period were then oven-dried at 80°C (Trial 1) or freeze-dried (Trial 2) before milling through a 0.8 mm sieve. In Trial 1, faecal ash concentration was first determined individually. Faecal AIA concentration was then determined on triplet samples within each treatment × period group after pooling faecal samples of three cows. These two triplet samples per group were obtained after balancing milk yield, parity and faecal ash concentration between triplets. In Trial 2, all chemical analyses were performed on each individual faecal sample.
Pasture AIA concentration was determined from pasture samples cut above 5 cm (Trial 1) and 2.5 cm (Trial 2) from ground level. Cutting height was adapted to pre-grazing sward height, much lower in Trial 2 than in Trial 1 (see the section ‘Results’). In Trial 1, a representative sub-sample was dried (48 h at 80°C) and ground (0.8 mm sieve) before analysis. In Trial 2, herbage samples were initially rinsed in cold water to remove soil particulates and then oven-dried 48 h at 80°C before grinding to 0.8 mm. In Trial 2, maize silage was sampled once daily and soybean meal was sampled once weekly before oven drying, milling and preparation as described for pasture before chemical analyses.
Chemical analyses
Ash was determined by calcination at 550°C for 5 h (Association Française de Normalisation, 1997) in a muffle furnace. AIA concentrations in pasture, soil and faeces were determined according to van Keulen and Young (Reference Van Keulen and Young1977) by two calcinations at 550°C with an intermediate boiling step (15 min) in 3 N HCl. More details about chemical analyses, that is, concentrations of nitrogen, acid detergent fibre (ADF), n-alkanes or digestibility, can be found for Trial 1 in Ribeiro Filho et al. (Reference Ribeiro Filho, Delagarde and Peyraud2005) and for Trial 2 in Pérez-Prieto et al. (Reference Pérez-Prieto, Peyraud and Delagarde2011).
Calculations
Soil intake as a proportion of total DM intake was calculated for each triplet of cows (Trial 1) or individually (Trial 2) at each period according to the following equation (Beyer et al., Reference Beyer, Connor and Gerould1994):

where soil intake is the proportion of dry soil in the ingested DM (g/100 g DM), AIAD is the diet AIA concentration (kg/kg DM), AIAF is the faecal AIA concentration (kg/kg DM), AIAS is the soil AIA concentration (kg/kg DM) and DMDD is the diet DM digestibility.
AIAD was the pasture AIA concentration in Trial 1 and on unsupplemented treatments in Trial 2. For supplemented treatments in Trial 2, AIAD was calculated individually from the known proportion and AIA concentration of each feed in the diet. Similarly, DMDD was the pasture DMD in Trial 1 and on unsupplemented treatments in Trial 2. For supplemented treatments in Trial 2, DMDD was calculated individually from the known proportion and DMD of each feed in the diet. Possible digestive interactions between forages were ignored because they are probably of small-scale, as shown by Pérez-Ramírez et al. (Reference Pérez-Ramírez, Peyraud and Delagarde2012) estimating pasture DM digestibility by different methods when fed to dairy cows supplemented with 5 to 14 kg DM of a maize silage–soyabean mixture. Sensitivity analysis of soil intake estimate to changes in DMDD shows that a 1% unit overestimation of DMDD (if any digestive interaction) would lead to a 5% underestimation of soil intake. DM digestibility of supplements (maize silage and soyabean meal) were calculated by subtracting 0.02 from organic matter digestibility (OMD; R. Baumont, personal communication). Organic matter digestibility was estimated from pepsin–cellulase digestibility (Aufrère and Michalet-Doreau, Reference Aufrère and Michalet-Doreau1988). Pasture DMD was derived from pasture OMD according to the following equation established from a series of in vivo experiments (R. Baumont, unpublished):

In Trial 1, pasture OMD was estimated from the faecal crude protein and ADF concentrations using a multiple regression (Ribeiro Filho et al., Reference Ribeiro Filho, Delagarde and Peyraud2005) based on 31 in vivo experiments (J.L. Peyraud et al., unpublished). In Trial 2, pasture OMD was calculated from pepsin–cellulase digestibility of pasture samples cut at 2.5 cm as described by Pérez-Prieto et al. (Reference Pérez-Prieto, Peyraud and Delagarde2011).
Soil intake in kg/day was calculated from soil intake calculated as previously described in proportion of total DM intake and from the pasture and supplement intakes.
Statistical analyses
In Trial 1, animal data were analysed using the following model (PROC MIXED; SAS Institute, 2004):

where Yijkl , μ, triplet i , period j , allow k , sward l , [allow k × sward l ], eijkl represent the analysed variable, the overall mean, the random effect of the triplet (i = 1 to 8), the fixed effect of the period (j = 1 to 4), the fixed effect of pasture allowance (k = 1 to 2), the fixed effect of sward type (l = 1 to 2), the interaction between pasture allowance and sward type and the residual error term, respectively.
In Trial 2, animal data were analysed using a similar model:

where Yijkl , μ, cow i , period j , allow k , suppl l , [allow k × suppl l ], eijkl represent the analysed variable, the overall mean, the random effect of the cow (i = 1 to 12), the fixed effect of the period (j = 1 to 4), the fixed effect of pasture allowance (k = 1 to 2), the fixed effect of supplementation (l = 1 to 2), the interaction between pasture allowance and supplementation and the residual error term, respectively.
Pasture variables, averaged per treatment and period, were analysed using the following model (PROC GLM; SAS Institute, 2004):

where Yjkl , μ, period j , allow k , factor l , [allow k × factor l ], ejkl represent the analysed variable, the overall mean, the fixed effect of the period (j = 1 to 4), the fixed effect of pasture allowance (k = 1 to 2), the fixed effect of the second factor, that is, sward type in Trial 1 or supplementation in Trial 2 (l = 1 to 2), the interaction between pasture allowance and factor and the residual error term, respectively.
Significance is stated when P < 0.05 and tendency when P < 0.10.
Results
Trial 1
Characteristics of pasture and soil
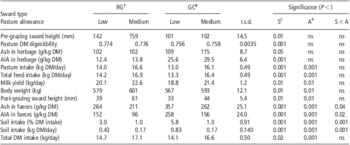
Pre-grazing pasture characteristics were only affected by sward type (Table 1). Pre-grazing sward height was lower in GC than in RG swards (101 v. 150 mm, P < 0.01), irrespective of pasture allowance. All pastures were of good quality, with a pasture DMD averaging 0.766. Pasture DMD was, however, lower on GC than on RG swards (−0.02, P < 0.001). Pasture ash concentration averaged 107 g/kg DM and was slightly greater in GC than in RG swards (+10 g/kg DM, P < 0.05). Pasture AIA concentration on GC was twice as that on RG swards, averaging 28 and 13 g/kg DM, respectively (P < 0.001). Consequently, AIA represented 13% of total ash in RG swards and 25% of total ash in GC swards.
Effect of sward type and pasture allowance on pre-grazing sward characteristics, pasture intake, animal performance, faecal composition and soil intake in grazing dairy cows (Trial 1)

DM = dry matter.
†RG = pure ryegrass pasture.
‡GC = ryegrass-white clover pasture.
§S = sward type.
A = pasture allowance.
The soil contained 955 g ash/kg DM and 884 g AIA/kg DM, that is, 93% of total ash. Soil AIA concentration showed very small variations between sampling sites (±3 g/kg DM, i.e. 0.3% of CV, n = 8).
Cow performance and post-grazing pasture height
Treatment effects on animal performance have previously been described by Ribeiro Filho et al. (Reference Ribeiro Filho, Delagarde and Peyraud2005). Briefly, pasture DM intake and milk yield averaged 14.9 and 20.7 kg/day, respectively (Table 1). Pasture DM intake (+2.8 kg DM/day; P < 0.001) and milk yield (+2.5 kg/day, P < 0.01) were greater at medium than at low pasture allowance, irrespective of sward type. Pasture DM intake was lower on GC than on RG swards (−0.7 kg DM/day, P < 0.001), as was milk yield (−1.3 kg/day, P < 0.01). BW increased with pasture allowance (573 and 597 kg, respectively, for low and medium PA, P < 0.01) and was slightly higher on RG swards by comparison with GC swards (+10 kg, P < 0.01).
Post-grazing sward heights were generally low, ranging from 33 to 61 mm between treatments. Post-grazing sward height was lower at low than at medium pasture allowance (−16 mm, P < 0.01) and on GC compared with RG swards (−12 mm, P < 0.01).
Faecal composition and soil intake
Faecal ash and AIA concentrations averaged 273 and 165 g/kg DM, respectively, and were affected by pasture allowance and sward type, with an interaction between both factors (P < 0.05; Table 1). Faecal ash concentration was 53 g/kg DM lower at medium than at low pasture allowance for RG swards, and lower by 95 g/kg DM at medium than at low pasture allowance for GC swards. The corresponding figure for faecal AIA concentration was a decrease of 56 and 102 g/kg DM for RG and GC swards, respectively. The highest faecal ash and AIA concentrations were observed in GC swards at low pasture allowance and lowest faecal ash and AIA concentrations were found in RG swards at medium pasture allowance. The faecal AIA : ash ratio ranged from 0.45 to 0.72 between treatments.
Soil intake averaged 2.7% of total DM intake, that is, 0.40 kg DM/day. It was affected by pasture allowance in interaction with sward type (P < 0.001). At medium pasture allowance, soil intake was ∼1% of total DM intake for both sward types. At low pasture allowance, cows ingested significantly more soil than at medium pasture allowance (P < 0.001), particularly on GC swards (3.0% and 5.8% DM intake on RG and GC swards, respectively). Similar results were observed when soil intake was expressed in kg DM/day. Soil intake averaged 0.17 kg DM at medium pasture allowance, irrespective of sward type. At low pasture allowance, soil intake was greater than on medium pasture allowance (+0.46 kg DM, P < 0.001), and particularly on GC compared with RG swards (0.83 v. 0.43 kg DM, interaction sward type × pasture allowance: P < 0.001). Maximum soil intake for one cow triplet in any period reached 1.3 kg DM/day or 8.6% of the total DM intake (shown in Figures 1 and 2, respectively).
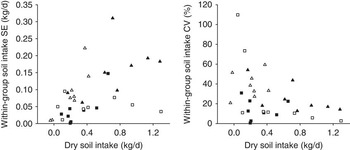
Variability of dry soil intake expressed either as standard error (s.e.) or as coefficient of variation (CV) within each treatment × period group (Trial 1, between-triplet variability: ▪, ryegrass pastures; □, ryegrass–white clover pastures; Trial 2, between-cow variability: ▴, unsupplemented cows; ▵, supplemented cows).

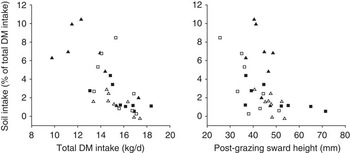
Relationship between total DM intake or post-grazing sward height and soil intake in grazing dairy cows (Trial 1: ▪, ryegrass pastures; □, ryegrass–white clover pastures; Trial 2: ▴, unsupplemented cows; ▵, supplemented cows). Each point is the mean of a treatment × period group.

Trial 2
Characteristics of pasture and soil
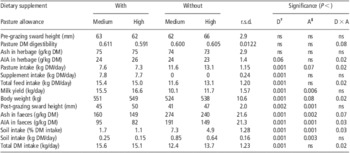
Pre-grazing sward height (63 mm), pasture ash concentration (74 g/kg DM) and pasture DMD (0.60) were not affected by treatments (Table 2). Pasture DMD was particularly low for perennial ryegrass swards, even in autumn. Pasture AIA concentration averaged 24 g/kg DM, that is, 32% of total ash. Although between-treatment variations of pasture AIA concentration was low, pasture AIA concentration was slightly greater (+2 g/kg DM) at high than at medium pasture allowance, but only in supplemented treatments (interaction: P < 0.02).
Effect of pasture allowance and dietary supplement on pre-grazing sward characteristics, pasture intake, animal performance, faecal composition and soil intake in grazing dairy cows (Trial 2)

DM = dry matter.
†D = dietary supplement.
‡A = pasture allowance.
The loamy soil contained 928 g ash/kg DM and 857 g AIA/kg DM, that is, 92% of total ash. Soil AIA concentration showed small variations between sampling sites (±9 g/kg DM, i.e. 1.0% of CV; n = 12).
Cow performance and post-grazing sward height
Treatment effects on animal performance have previously been described by Pérez-Prieto et al. (Reference Pérez-Prieto, Peyraud and Delagarde2011). Briefly, pasture intake was reduced on average by 4.9 kg DM/day (P < 0.001) when cows received the dietary supplement (Table 2). Unsupplemented cows ingested 1.5 kg DM/day more at high than at medium pasture allowance, whereas pasture allowance had no effect on pasture intake in supplemented cows (interaction pasture allowance × dietary supplement: P < 0.02). The dietary supplement was completely ingested by each cow. Total DM intake averaged 15.4 and 13.1 kg DM/day for supplemented and unsupplemented cows, respectively (P < 0.001), with similar interaction between pasture allowance and dietary supplement as pasture intake.
Milk yield averaged 13.5 kg/day and increased from 10.9 kg/day in unsupplemented treatments to 16.1 kg/day in supplemented treatments, irrespective of pasture allowance (P < 0.001). Milk yield was also greater at high than at medium pasture allowance (14.2 v. 12.8 kg/day, P < 0.01). The BW of supplemented cows was higher than that of unsupplemented cows (550 v. 531 kg, P < 0.001). BW was the lowest in unsupplemented cows at medium pasture allowance (interaction dietary supplement by pasture allowance: P < 0.05).
Post-grazing sward height averaged 46 mm. This value was greater at high than at medium pasture allowance (49 v. 43 mm, P < 0.001) and for supplemented cows compared with unsupplemented cows (48 v. 44 mm, P < 0.01).
Faecal composition and soil intake
Faecal ash concentration was lower in supplemented than in unsupplemented cows (155 v. 257 g/kg DM, P < 0.001) and at high than at medium pasture allowance (195 v. 217 g/kg DM, P < 0.01; Table 2). The effect of supplementation on faecal ash concentration tended to be greater at medium than at high pasture allowance (interaction: P = 0.07). In the same manner, faecal AIA concentration was lower in supplemented than in unsupplemented cows (89 v. 165 g/kg DM, P < 0.001) and at high than at medium pasture allowance (116 v. 143 g/kg DM, P < 0.001). The effect of supplementation on faecal ash concentration was greater at medium than at high pasture allowance (interaction: P < 0.05). The faecal AIA : ash ratio averaged 0.57 and 0.66 in supplemented and unsupplemented cows, respectively.
Soil intake averaged 3.7% of the total DM intake, that is, 0.47 kg/day. The proportion of soil in total DM intake was four times greater in unsupplemented than in supplemented cows (6.1% v. 1.4%, P < 0.001) and to a lesser extent, also greater at medium than at high pasture allowance (4.5% v. 3.0%, P < 0.001). The amount (kg/day) of soil ingested varied in a similar manner, with lower soil intake when cows were supplemented (−0.54 kg/day, P < 0.001) and at high compared with medium pasture allowance (−0.15 kg/day, P < 0.01). When expressed as a proportion of total DM intake, the decrease in soil intake when cows were supplemented was greater at medium than at high pasture allowance (interaction pasture allowance × dietary supplement: P < 0.05). When soil intake was expressed in kg DM/day, this interaction was not significant (Table 2). The highest soil intake for a treatment group in any period reached 10.4% of total DM intake, that is, 1.3 kg/day. The highest soil intake reached for one individual cow in Trial 2 was 11.1% of total DM intake or 1.45 kg/day (individual data not shown).
Discussion
Methodological considerations
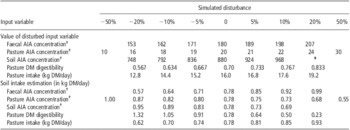
Rough estimation of some variables such as feed digestibility, feed intake or concentrations of markers in feed and soil would potentially reduce the accuracy of soil intake estimation. Sensitivity of the soil intake estimation simulating the impact of planned disturbances to the different input variables is illustrated in Table 3. Soil intake estimation appears mainly sensitive to pasture DM digestibility, faecal AIA concentration and then soil AIA concentration, but in practice some input variables are estimated more precisely than others. The soil composition of the plots used in our trials varied little, but Jurjanz et al. (Reference Jurjanz, Germain, Juin and Jondreville2011) reported differences of up to 91 g AIA/kg dry soil between samples taken in a given plot. Faeces should be sampled directly from the rectum of animals in order to avoid contamination by soil. It can be considered that AIA concentration disturbances in faeces and soil would poorly affect the estimation of soil intake as they would generally vary by no more than 10 g/kg DM, corresponding to a difference in the estimated soil intake of less than 10% (Table 3). The determination of AIA concentrations in herbage can vary more readily through contamination by soil, therefore affecting the estimation of soil intake in a non-negligible manner. Soil-contaminated pasture samples tend to overestimate pasture AIA concentration, leading to a great underestimation of the calculated soil intake as shown in Table 3. The much greater pasture AIA concentration in GC than in RG swards in Trial 1 was not expected, as no differences in AIA concentration between white clover and perennial ryegrass are reported in the literature. One reason could be a greater soil contamination in the GC than in the RG pastures during sampling because of lower pre-grazing sward height. By simulation, a 2% contamination of pasture samples by soil is sufficient to explain the large observed discrepancy between GC and RG swards’ AIA concentrations (28 v. 13 g/kg DM). Assuming only 1% contamination by soil, that is, ∼50% overestimation of pasture AIA concentration, soil intake could have been underestimated by ∼30% (Table 3). In this case, soil intake could have been close to 1.1 kg DM/day in GC sward at low pasture allowance instead of the 0.83 kg DM/day estimated in our calculations. Indeed, it is highly recommended to rinse pasture samples after sampling as in Trial 2. The digestibility of herbage can also vary widely, although very low digestibilities as in Trial 2 are generally not representative of high-quality pastures. Soil intake estimation appears very sensitive to pasture DM digestibility (Table 3). The DM digestibility estimation error would generally not exceed ±0.03 from in vitro or from faecal index techniques (Penning, Reference Penning2004). Accurate estimation of soil intake requires at least such a level of precision, a 5% error in pasture DM digestibility (i.e. ±0.033 points in our case) leading to an 18% error in soil intake estimation (i.e. ±0.14 kg/day in our case, Table 3). Conversely, a very roughly estimated digestibility, as used in wildlife surveys, can lead to considerable imprecision in soil intake estimations by the AIA method.
Sensitivity analysis of the estimation of soil intake according to planned disturbances of the different input variables

DM = dry matter; AIA = acid-insoluble ash.
The standard situation corresponds to an absence of disturbance, that is, 0%, with a soil intake of 0.78 kg DM/day.
†In g/kg DM.
‡Value which cannot be obtained.
Calculated least significant differences for dry soil intake were 0.14 and 0.15 kg/day in Trials 1 and 2, respectively. This indicates that a soil intake difference between treatments of less than 0.15 kg/day would not be detectable with this method, although all input variables were measured with adequate methodology. Methods based on rarer markers such as titanium or aluminium have been proposed for more precise estimations of soil intake (Fries et al., Reference Fries, Marrow and Snow1982; Beyer et al., Reference Beyer, Spann and Day1999).
Soil intake within a given treatment × period group, that is, between triplets (Trial 1) or cows (Trial 2) in the same plot was analysed (Figure 1). The standard error of dry soil intake ranged between 0 and 0.30 kg/day and did not exceed 0.20 kg/day at highest soil intake, which is close to the precision of the method. Finally, soil intake CV did not exceed 20% at highest soil intake (Figure 1), indicating that, with very severe grazing conditions, cows did not have the opportunity to avoid soil ingestion while grazing. This would indicate that high soil intake is actually involuntary and that cows cannot select pasture without eating soil in these conditions. Higher CV at low dry soil intake appears to be related to the low mean value itself rather than to the differential between-cow selection.
Soil intake and its variation factors
The soil intake values recorded in our trials showed that grazing dairy cows can ingest, under disadvantageous circumstances, over 1 kg dry soil per day. This is in accordance with previously reported values (Mayland et al., Reference Mayland, Florence, Rosenau, Lazar and Turner1975; Fries et al., Reference Fries, Marrow and Snow1982; Thornton and Abrahams, Reference Thornton and Abrahams1983), generally classified as extreme and not relevant to current outdoor systems. Healy (Reference Healy1968) showed that soil intake increased with increasing stocking rate: soil intake had a yearly average of 0.5 kg/day at 1.2 cows/ha, increasing to 0.85 kg/day at 1.65 cows/ha and finally reaching 1.06 kg/day at 2.5 cows/ha, with 1.86 kg/day during the winter period. He reported that these differences were mainly because of a strong increase in soil intake over the New Zealand winter and at high stocking density. Our average and extreme values seem close to those reported in previous studies focused on extensive ranching (Mayland et al., Reference Mayland, Florence, Rosenau, Lazar and Turner1975; Fries et al., Reference Fries, Marrow and Snow1982; Thornton and Abrahams, Reference Thornton and Abrahams1983) even if higher soil intake can be hypothesised in the case of trampling or when cows graze under heavy rainfall (Healy, Reference Healy1968).
The effect of such high soil intake levels on ruminal fermentations, pasture digestibility, pasture intake and finally milk production is unknown. We can expect negative effects such as dilution of nutrients and reduced palatability of soil-contaminated feed, but also positive effects such as improved ruminal metabolism and a clay effect on digestive tract health (Dunn et al., Reference Dunn, Emerick and Embry1979; Ouachem and Nouicer, Reference Ouachem and Nouicer2006).
In the two trials, lower pasture allowance clearly increased the risk of higher soil intake by grazing dairy cows. This result can be explained by a lower post-grazing sward height at the lowest pasture allowance. Although this general relationship was confirmed in both trials, the slope was specific in each trial, rendering the definition of a general threshold difficult. Indeed, similar pasture allowance between both trials cannot be compared directly as differences in pasture quality (especially digestibility), pre-grazing sward height, grazing weather and stage of lactation would modulate the effect of pasture allowance on pasture and soil intake. Nevertheless, it can be assumed that a high intake of DM on pasture, that is, 15 kg in our conditions, due to high pasture allowance, would efficiently limit soil intake (Figure 2). A quite similar relationship can be shown with post-grazing sward height used as an indicator of grazing severity (Figure 2): soil intake increased strongly when post-grazing sward height dropped under 50 mm, despite some very low intakes even on short swards. Indeed, a short sward would incite cows to graze very close to the ground. They would then more frequently ingest parts of the plants that have been contaminated by splashed soil or even lift grass tufts and ingest soil adhering to the roots. In extreme cases, cows would directly touch the soil with their mouth. Thus, a sward height of 25 mm was reported to be a threshold under which it is very difficult for cows to catch the grass (Delagarde et al., Reference Delagarde, Faverdin, Baratte and Peyraud2011), thus amplifying the aforementioned mechanisms.
As shown in Trial 2, the ingestion of supplementation would efficiently reduce soil intake, probably because of the increase in post-grazing sward height and the strong reduction in grazing time for supplemented cows (Pérez-Prieto et al., Reference Pérez-Prieto, Peyraud and Delagarde2011). Moreover, ingested soil is diluted with a higher amount of ingested DM and there is no risk of soil intake when eating the supplements indoors. Fries et al. (Reference Fries, Marrow and Snow1982) confirmed the lower soil intake when sparse vegetation-grazing cows received supplementation, with no details of time spent outside. Thus, soil intake could also be limited by reducing the time the cows spend on pasture when the grazing conditions become worse.
Practical implications
On the basis of a 200-day grazing season and daily soil intake ranking between 0.2 and 0.8 kg/cow, the yearly soil intake can be estimated at between 40 and 160 kg of dry soil per cow. Previous estimations by Healy (Reference Healy1968) in New Zealand ranked from 90 to 360 kg of dry soil per year for cows that also spent the winter outside. Thus, the amount of removed soil via ingestion by cows can reach up to 320 kg/ha at an average stocking rate of 2 cows/ha and, in very intensive grazing systems (3 cows/ha), nearly 500 kg of dry soil/ha. This soil is mainly taken from the very fertile surface of the plot. Our work provides tools to limit soil intake by dairy cows on pasture, particularly when animals graze on surfaces that could have previously been exposed to a deposit of atmospheric pollutants.
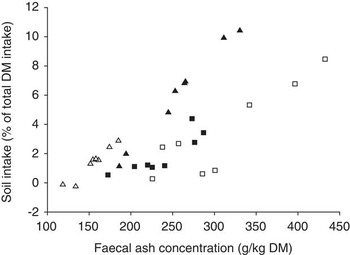
Although not quantified, visual observation of the pasture is the first indicator of increased soil intake as grazing close to ground level generally damages vegetation, which may sometimes disappear. Indeed, grass will act as a ‘buffer’ between the cow and soil. The roles of sward height and allowance levels have been discussed previously and especially post-grazing sward heights of less than 50 mm appear to expose cows to the ingestion of increased amounts of soil. When such short swards are grazed by cows in a previously exposed area, the animals must be closely monitored in order to remove them rapidly when vegetation becomes sparse. A second indicator could be increased faecal crude ash concentration. This generally indicates that the soil intake of animals has increased (Figure 3). As previously shown through the relatively low between-cow CV of soil intake within a paddock (Figure 1), cows grazing under the same conditions display similar soil intake, and therefore the sampling of only a fraction of the animals, or a number of faecal samples, would indicate average soil intake by the herd. Thus, faecal AIA concentration is well correlated to the more easily measurable faecal crude ash concentration (AIAF = 0.872 × AshF − 60.2, R 2 = 0.92, plot not shown), and high soil intake can be suspected for a faecal ash concentration greater than 300 g/kg DM, particularly on low supplemented cows.
Relationship between faecal AIA or ash concentrations and soil intake in grazing dairy cows (Trial 1: ▪, ryegrass pastures; □, ryegrass–white clover pastures; Trial 2: ▴, unsupplemented cows; ▵, supplemented cows). Each point is the mean of a treatment × period group.

The distribution of supplementary feed has been clearly identified as an efficient way to limit soil intake. Nevertheless, this supplementary feed, and also licks, should not be distributed on soil but in a trough or in a rack (hay). Finally, soil ingestion can be limited by all methods used to reduce the time of access of the cows and closeness to the surface of the paddock.
Conclusion
Grazing dairy cows would ingest daily less than 250 g of dry soil under good grazing conditions. As soil can represent a route of entry for persistent pollutants into the food chain, grazing in historically polluted areas should be managed to limit an increase in soil intake. Low herbage allowance, a post-grazing sward height <50 mm and high stocking rates are risk factors that were shown to be responsible for an increase in soil intake. When grazing conditions are more severe, dry soil intake by dairy cows grazing in intensive rearing systems can increase up to 1 kg/day and individual intakes can even exceptionally reach 1.3 kg/day. Conversely, the distribution of a dietary supplement and a reduced time of access to the paddock surfaces could efficiently limit the increase of soil intake.
Acknowledgements
J. Lassalas, P. Lamberton and the staff of UMR1080 INRA-Agrocampus Ouest Production du Lait (experimental farm of Méjusseaume and laboratories) are gratefully acknowledged for their care of experimental animals and assistance with measurements throughout the studies, and for being part of the laboratory chemical analyses. P. Hartmeyer from UR Animal et Fonctionnalités des Produits Animaux (Nancy) is also acknowledged for AIA determination, as well as ‘Caractères et caetera’ for post-editing the English style.