Introduction
In the prehospital setting, blood pressure (BP) predicts a patient’s clinical course, directing acute management and guiding resuscitation treatment. Relative to all demographics and diagnoses, BP is one of the first vital signs taken when Emergency Medical Services (EMS) arrive at the scene. A patient’s BP is useful when assessing for organ perfusion, identifying stroke risk, and diagnosing sepsis.Reference Polito, Isakov and Yancy1 Studies suggest that it may also provide insight into patient outcome following traumaReference Reisner, Chen and Kumar2 and has prognostic value in patient mortality.Reference Bruijns, Guly and Bouamra3
Though it is recognized as a valuable component in the initial screening assessment, BP remains one of the most difficult vital signs to obtain accurately. Many methods have been employed in an attempt to make BP measurement not only exact, but also easy to monitor.Reference Nitzan, Slotki and Shavit4 Current techniques range from rapid, palpated pressures to hands-free, automated, oscillometric pressures to invasive, intra-arterial (IA) pressures. Each method comes with its own advantages and disadvantages. Factors that precipitate erroneous non-invasive blood pressure (NIBP) measurement are numerous, and include device inconsistencies, faulty procedures, and user error.Reference Bur, Hirschl and Herkner5-Reference Zhang, Zhang and Chen11 During prehospital transport, measured BPs vary widely. In part, EMS intervention prompts the physiologic change,Reference Dinh, Oliver and Bein12 but studies suggest that recording consecutive BP can cause discrepancies that may not correlate with real change over time.Reference Jones, Simpson and Ahmed13 Variation in BP has also been shown to occur with differing machinesReference Kallem, Meyers and Cucchiara14 and techniques.Reference Rinfre, Cloutier and L’Archeveque15
The study of BP in the prehospital setting is difficult because of multiple confounding variables.Reference McMahon, Hogg and Corfield16,Reference Wildner, Pauker and Archan17 For this reason, researchers have attempted to extrapolate the results of BP studied in the intensive care unit (ICU) to the prehospital setting. The controlled ICU environment offers reliable invasive BP readings with which to compare the NIBP methods. Previous studies have suggested that IA monitoring delivers the gold standard in BP measurement.Reference Van Bergen, Weatherhead and Treloar18 Readings from individual arterial line sampling are interchangeable with integrated mean arterial pressures.Reference Muecke, Bersten and Plummer19 When compared to IA devices, NIBP methods poorly reflect actual BP. In a randomized ICU crossover trial by Ribezzo, et al,Reference Ribezzo, Spina and Di Bartolomeo20 manual and oscillometric measurements were found to be significantly higher in systolic and lower in diastolic than IA measurements. These findings suggest that manual and oscillometric devices should not replace IA BP monitoring in this critically ill population. Another analysis of septic patients in the ICU by Riley, et al drew similar conclusions about the accuracy and utility of oscillometric BP monitoring in these patients.Reference Riley, Chen and Latham21 The inconsistent nature of NIBP techniques has led researchers to consider implementing IA lines in the prehospital setting. One study demonstrated success in four previously established, physician-staffed, EMS systems without any compromise to patient care.Reference Wildner, Pauker and Archan17 Financial and practical constraints limit this approach.
Despite extensive investigation, researchers have not yet ranked the accuracy of NIBP methods. The aim of this study, therefore, is to evaluate the validity of NIBP techniques by comparing them to concurrent invasive measurements.
Methods
Participant Selection
The study was conducted at a large, urban, tertiary-care Level I trauma center/teaching hospital using a convenience sample of patients with pre-existing radial intra-arterial blood pressure (RIBP) devices. The patients enrolled were from two medical and one neurologic/trauma ICU. The study protocol was reviewed and approved by the medical school’s institutional review board – study ID: H00010976. Authorization was obtained from ICU leaders to screen patients for established RIBP catheters via the hospital’s electronic medical record (EMR). Inclusion criteria were the following: adults age ≥18 years old who are English speaking with capacity to consent, adults age ≥18 years old who are English speaking without the capacity to consent but with enrollment permission granted by a Legal Authorized Representative (LAR), and the presence of a RIBP device previously established by the treating team. Exclusion criteria included subjects who were < 18 years old, had baseline physiology not amenable to standard BP measurement, had upper extremity lymphedema, had a history of axillary surgery, were clinically unstable as determined by their care team, were pregnant, or were prisoners. Clinical stability for enrollment was confirmed by the treating team. Formal consent was waived because of minimal risk to subjects and processes that were within the standard of care. A “Fact Sheet” was provided to the awake patient and/or their LAR prior to enrollment. Since permission was required, some family members declined to allow the investigators to enroll certain patients, which prevented the investigators from enrolling a true random or consecutive sample.
Data Collection
Eight systolic blood pressure (SBP) measurements were collected from each subject in the same arm as the RIBP device, including two RIBP and six NIBP measurements. The NIBP techniques that were evaluated included oscillometric, auscultated, and palpated methods. The hospital’s standard RIBP catheter was used for the study - Arrow RA-04020 Radial Artery Catheterization Set 20 Gauge x 4.45cm radiopaque polyurethane (Teleflex; Morrisville, North Carolina USA) - which was transduced via Edwards Lifesciences TruWave 3cc/60in (150cm) tubing (Edwards Lifesciences Corp.; Irvine, California USA). The two RIBP measurements were recorded from the monitor - Philips Intellivue M8007A Patient Monitor (Koninklijke Philips N.V.; Amsterdam, Netherlands). The two oscillometric measurements were recorded with the automated sphygmomanometer using the same monitor. The two auscultative measurements were recorded with a manual cuff - Welch Allyn DS45-11 Gauge with Durable One Piece, Adult Cuff (Welch Allyn, Inc.; Skaneateles Falls, New York USA). The two palpated measurements were recorded with the same manual cuff. Cuffs were placed with the bottom edge two-three centimeters above the antecubital fold for all measurements. The investigators determined the palpated SBP by applying the cuff in the standard location, palpating the radial artery pulse while maintaining finger contact with this location throughout the measurement, inflating the cuff until the pulse was no longer felt, and then slowly deflating the cuff until the radial pulse was felt again. The pressure noted at the time of the radial artery pulse returning was documented as the SBP. Examiners used standard examination gloves throughout the procedure. This procedure and the use of standard examination gloves are consistent with the standard practice employed by EMS providers in the field in this system. Each reading was collected in identical order by the same investigators and separated by three-minute intervals for pressure normalization. Appropriate cuff size was determined by the participant’s nurse using a Welch Allyn FlexiPort Disposable Blood Pressure Cuff (Welch Allyn, Inc.; Skaneateles Falls, New York USA). All pressures were collected with the patient in a semi-recumbent position. Vasoactive medications administered up to 24 hours prior to data collection, patient demographics, and primary diagnosis were extracted from the EMR.
Data Analysis
Based on the wide variability in the standard deviation of BP measurements from several previous studies,Reference Skirton, Chamberlain and Lawson22 it was determined that 44 patients were required to detect a clinically significant difference in SBP of 5mmHg with 80% power and alpha of 0.05. Mean SBP differences between RIBP measurements and individual NIBP measurements were compared, as were differences between NIBP measurements using the paired t-test with dependent samples. Statistical significance of these differences was determined along with 95% confidence intervals (CI). Repeated measures analysis of variance (ANOVA) testing was applied to the entire sample. The data were then stratified into subgroups, which were determined a priori to categorize variation according to patient demographics, primary diagnosis, and use of vasoactive medication during the preceding 24 hours of data collection. Bland Altman plots were used to graphically compare measurement techniques and evaluate the limits of agreement (LOA). All calculations and plots were developed using MedCalc Software v.18.10.2 (MedCalc Software; Ostend, West Flanders, Belgium).
Results
Patient Demographics and Subgroups
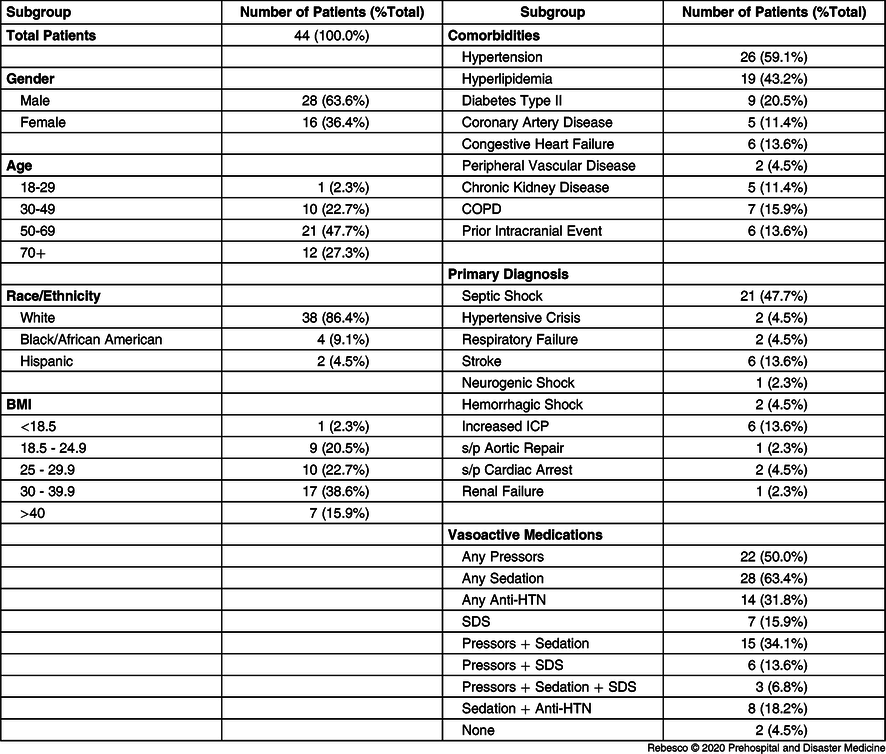
There was a total of 44 patients enrolled in the study with more males than females (63.6% versus 36.4%). The average age was 58.4 years and nearly one-half of the group was in the 50-69-year age group. Most of the patients were White (86.4%), with four Black/African American, and two Hispanic. Only one patient was underweight while nine patients had a normal body mass index (BMI) of 18.5-24.9 (20.5%). The majority of patients were either overweight (25.0-29.9 = 22.7%), obese (30.0-39.9 = 38.6%), or morbidly obese (>40.0 = 15.9%). The most common pre-existing comorbidities included 26 patients with hypertension (59.1%), 19 patients with hyperlipidemia (43.2%), and nine patients with Type II diabetes (20.5%; Table 1).
Patient Demographics

Note: This table shows the demographic information of the patient population broken down by gender, age, race/ethnicity, BMI, comorbidities, primary diagnosis requiring arterial line placement, and vasoactive medications that the patients were receiving or had received in the preceding 24 hours. It shows the gross number of patients in each demographic and the percentage of the total patient population.
Abbreviations: BMI, body mass index; COPD, chronic obstructive pulmonary disease; ICP, intracranial pressure; s/p, status post; HTN, hypertensive; SDS, stress dose steroids.
The most common primary diagnosis for which the patients had an IA line placed was septic shock (47.7%). The next most common diagnoses were stroke and increased intracranial pressure (ICP), which each represented 13.6% of the study population. More than one-half of the patients were receiving some form of sedation (63.4%), while 50.0% of the patients were on vasopressor medication and 34.1% were on both sedation and vasopressors.
Analysis of the Entire Sample
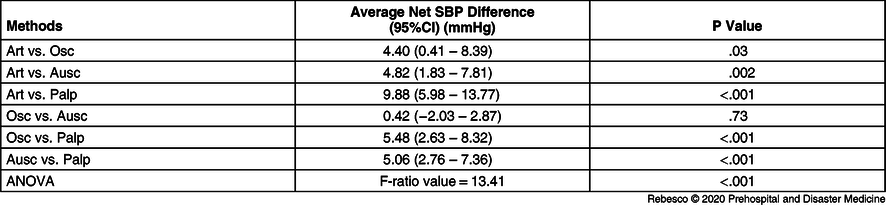
Every NIBP method differed significantly from the gold standard of IA measurement (Table 2).
Net SBP Comparison by Method for Entire Sample

Note: This table describes the average net SBP differences, their associated 95% CI, and the associated P value when comparing individual methods of measurement for the entire sample. The difference is obtained by subtracting the value for the 2nd listed method from the 1st listed method. An ANOVA for the entire sample is listed with its associated F-ratio value and P value.
Abbreviations: ANOVA, analysis of variance; Art, arterial; Ausc, auscultated; Osc, oscillometric; Palp, palpated; SBP, systolic blood pressure.
However, when compared to the RIBP measurement, only the palpated method differed more than the predetermined 5mmHg level of clinical significance (9.88mmHg less than RIBP; P < .001). The palpated method also showed a statistically and clinically significant lower reading than the oscillometric method (5.48mmHg; P < .001) and the auscultated method (5.06mmHg; P < .001). There was no statistically significant difference between the oscillometric and auscultated methods (0.42mmHg; P = .73).
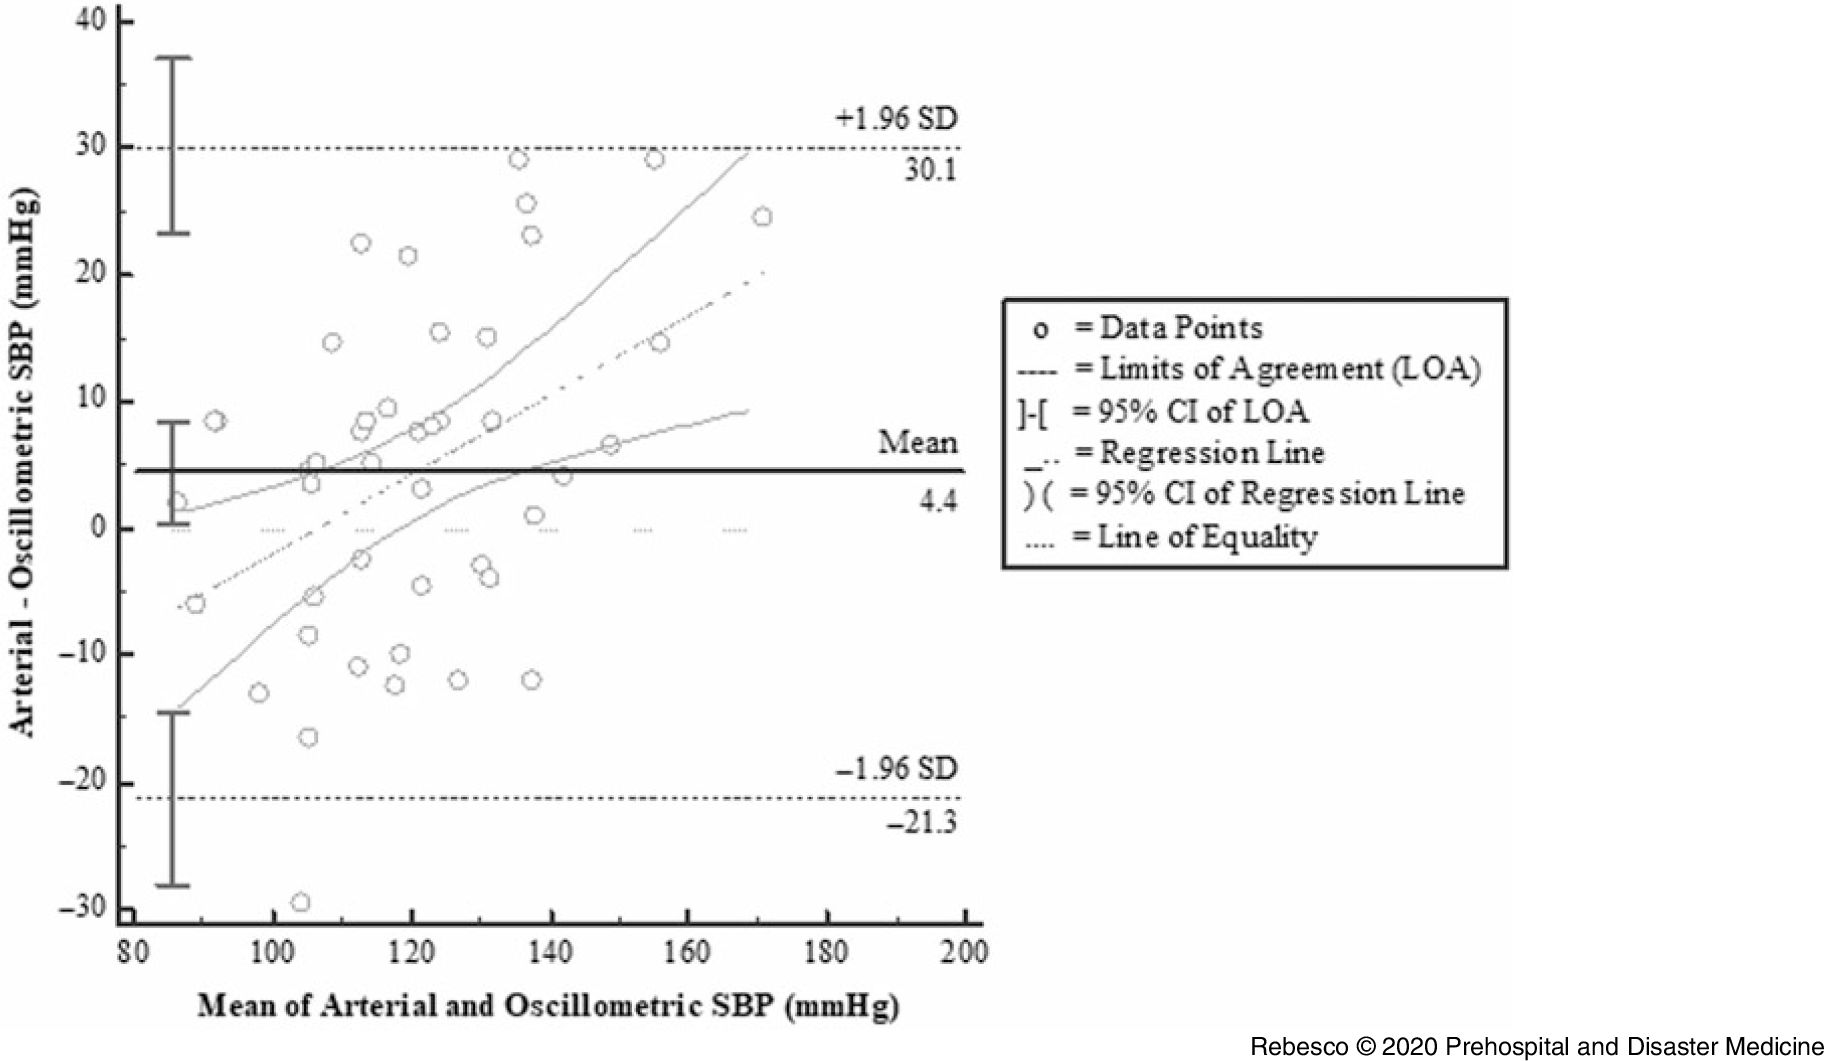
For all comparisons, the LOAs between different methods of SBP measurement were broad (Figure 1; Supplemental Figures 1-5 [available online only]).
Net Difference versus Average Value for Arterial and Oscillometric SBP Measurements of Entire Sample.

There was a relatively steep line of regression when comparing the differences between RIBP and oscillometric measurements, and it crossed the line of equality at approximately SBP of 110mmHg. When comparing RIBP with auscultated SBP, the line of regression did not cross the line of equality until approximately 85mmHg. There was a relatively flatter regression line when comparing RIBP and palpated SBP measurements, as well as when comparing auscultated and palpated SBP measurements.
Demographic Subgroup Analysis
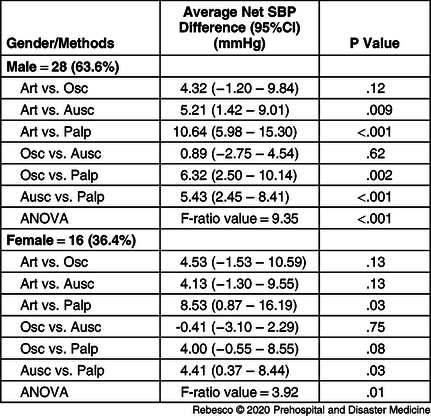
Additional analysis was performed on predetermined subgroups of gender, BMI, major diagnosis requiring IA line placement, and which vasoactive medications they were receiving or had received within the 24 hours preceding data collection (Table 3).
Net SBP Comparison by Method for Gender Subgroups

Note: This table describes the average net SBP differences, their associated 95% CI, and the associated P value when comparing individual methods of measurement for the gender subgroups. The difference is obtained by subtracting the value for the 2nd listed method from the 1st listed method. An ANOVA for each subgroup is also listed with its associated F-ratio value and P value. The bolded subheadings list the gender subgroup, the gross number of patients in the subgroup, and the percentage of the total patient population.
Abbreviations: ANOVA, analysis of variance; Art, arterial; Ausc, auscultated; Osc, oscillometric; Palp, palpated; SBP, systolic blood pressure.
For the male subgroup, there were statistically and clinically significant differences between RIBP versus auscultated measurements (5.21mmHg; P = .009), RIBP versus palpated (10.64mmHg; P < .001), oscillometric versus palpated (6.32mmHg; P = .002), and auscultated versus palpated (5.43mmHg; P < .001). The only difference in the female subgroup that was clinically and statistically significant was between RIBP versus palpated measurements (8.53mmHg; P = .03).
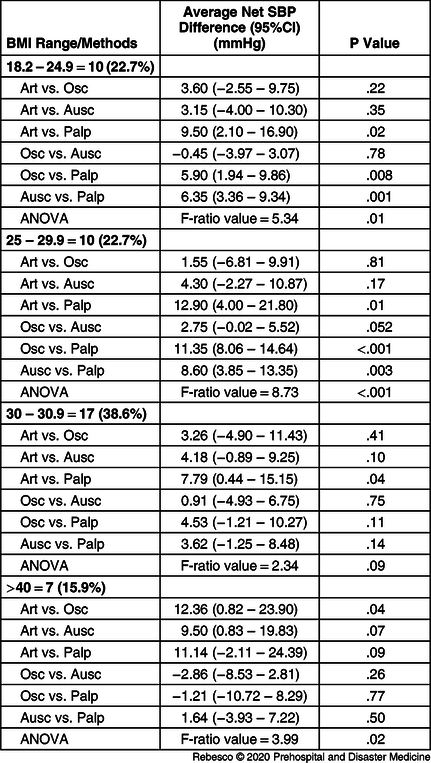
There were statistically and clinically significant differences in the normal weight group when comparing RIBP versus palpated (9.50mmHg; P = .02), oscillometric versus palpated (5.90mmHg; P = .008), and auscultated versus palpated (6.35mmHg; P = .001). The one underweight patient had a BMI of 18.2 and was included in the normal weight subgroup. The same three comparisons were also the only ones that met statistically and clinically significant difference in the overweight group at 12.90mmHg (P = .01), 11.35mmHg (P < .001), and 8.60mmHg (P = .003), respectively. The only other statistically and clinically significant differences were for RIBP versus palpated in the obese group (7.79mmHg; P = .04) and RIBP versus oscillometric in the morbidly obese group (12.36mmHg; P = .04; Table 4).
Net SBP Comparison by Method for BMI Subgroups

Note: This table describes the average net SBP differences, their associated 95% CI, and the associated P value when comparing individual methods of measurement for the BMI subgroups. The difference is obtained by subtracting the value for the 2nd listed method from the 1st listed method. An ANOVA for each subgroup is also listed with its associated F-ratio value and P value. The bolded subheadings list the BMI subgroup, the gross number of patients in the subgroup, and the percentage of the total patient population.
Abbreviations: ANOVA, analysis of variance; Art, arterial; Ausc, auscultated; BMI, body mass index; Osc, oscillometric; Palp, palpated; SBP, systolic blood pressure.
Diagnostic Subgroup Analysis
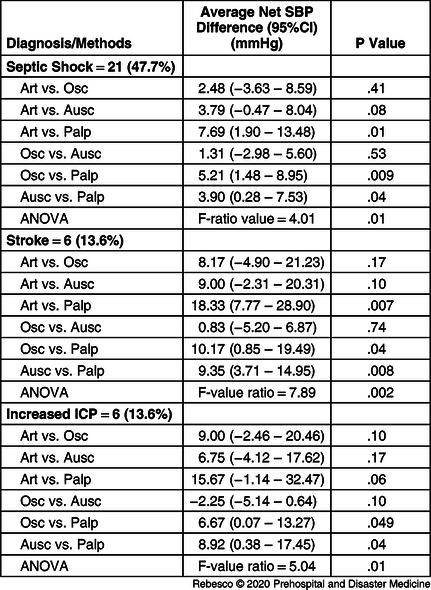
For the diagnostic subgroups, there were only three subgroups that contained more than two subjects, including septic shock, stroke, and increased ICP. The septic shock subgroup showed clinically and statistically significant differences when comparing RIBP versus palpated (7.69mmHg; P = .01) and oscillometric versus palpated measurements (5.21mmHg; P = .009). The stroke subgroup showed clinically and statistically significant differences when comparing RIBP versus palpated (18.33mmHg; P = .007), oscillometric versus palpated (10.17mmHg; P = .04), and auscultated versus palpated measurements (9.35mmHg; P = .008). The increased ICP subgroup showed clinically and statistically significant differences when comparing oscillometric versus palpated (6.67mmHg; P = .049) and auscultated versus palpated measurements (8.92mmHg; P = .04; Table 5).
Net SBP Comparison by Method for Major Diagnostic Subgroups

Note: This table describes the average net SBP differences, their associated 95% CI, and the associated P value when comparing individual methods of measurement for the major diagnostic subgroups that contained six or more patients. The difference is obtained by subtracting the value for the 2nd listed method from the 1st listed method. An ANOVA for each subgroup is listed with its associated F-ratio value and P value. The bolded subheadings list major diagnostic subgroup, the gross number of patients in the subgroup, and the percentage of the total patient population.
Abbreviations: ANOVA, analysis of variance; Art, arterial; Ausc, auscultated; ICP, intracranial pressure; Osc, oscillometric; Palp, palpated; SBP, systolic blood pressure.
Medication Subgroup Analysis
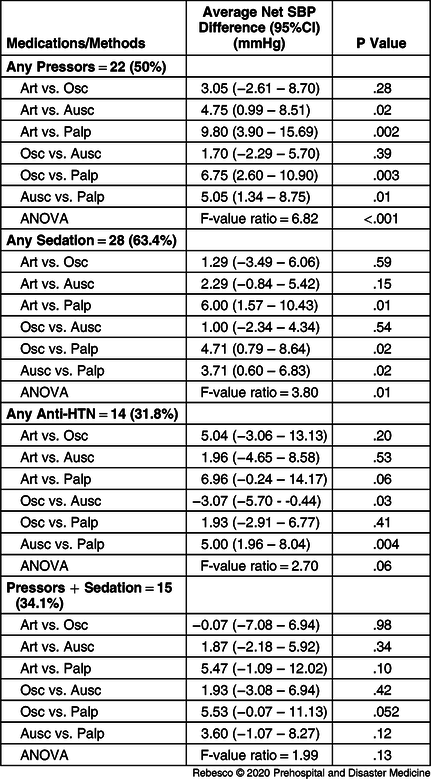
There were four medication subgroups which had 14 or more subjects: those receiving pressors, sedation, anti-hypertensives, and pressors + sedation. For the pressors subgroup, there were statistically and clinically significant differences between RIBP versus palpated measurements (9.80mmHg; P = .002), oscillometric versus palpated (6.75mmHg; P = .003), and auscultated versus palpated (5.05mmHg; P = .01). The only difference in the sedation subgroup that met statistical and clinical significance was RIBP versus palpated measurements (6.00mmHg; P = .01). The only difference in the anti-hypertensive subgroup that met statistical and clinical significance was auscultated versus palpated measurements (5.00mmHg; P = .004). There were no differences within the pressors + sedation subgroup that met statistical and clinical significance (Table 6).
Net SBP Comparison by Method for Major Medication Subgroups

Note: This table describes the average net SBP differences, their associated 95% CI, and the associated P value when comparing individual methods of measurement for the major vasoactive medication subgroups that contained 14 or more patients. The difference is obtained by subtracting the value for the 2nd listed method from the 1st listed method. An ANOVA for each subgroup is also listed with its associated F-ratio value and P value. The bolded subheadings list the vasoactive medication subgroup, the gross number of patients in the subgroup, and the percentage of the total patient population.
Abbreviations: ANOVA, analysis of variance; Art, arterial; Ausc, auscultated; HTN, hypertensive; Osc, oscillometric; Palp, palpated; SBP, systolic blood pressure.
Discussion
Primary Outcome
This study supports the notion that NIBPs significantly under-estimated RIBP. Despite the relative ease in application of NIBP devices, it is important to consider the implications of an artificially low NIBP reading when it is used as an RIBP equivalent. Titration of vasoactive medications and fluid administration both depend on accurate and current BP. Radial intra-arterial BP readings with poor arterial pressure waveforms are often corroborated with NIBPs to ensure adequate line placement for continuous monitoring. The inaccuracy of BP across NIBP techniques suggests a need for caution in the implementation and interpretation of those readings.
Differences Between NIBP Methods
Comparing the differences between RIBP and oscillometric SBP measurements indicate some variability between the differences in these measurements across the spectrum of low and high BP measurements. The regression line crosses the line of equality at approximately SBP of 110mmHg, indicating that oscillometric measurements may be falsely elevated in hypotensive patients and falsely decreased in more hypertensive patients. Note the regression line does not meet the line of equality until approximately 85mmHg when comparing RIBP and auscultated SBP measurements, indicating that auscultated measurements are routinely falsely lower than RIBP measurements at most physiologic SBPs.
Conversely, there is a relatively constant difference between RIBP and palpated measurements across the spectrum of BP readings with palpated SBP being routinely and significantly lower than RIBP. These data suggest that palpated measurements provide poor estimates of actual SBP. Further, when comparing palpated SBP to oscillometric and auscultated SBPs, on average, there are clinically significant lower readings, especially near normal SBP of 120mmHg. Note in Supplemental Figure 3 that there is a negative sloped regression line that crosses the line of equality at approximately 120mmHg, indicating that auscultated SBP may be lower than oscillometric in more hypotensive patients while the former is higher than the latter in more hypertensive patients, but on average, they are grossly equal, especially near normal SBP.
Palpated SBP measurement is commonly used in prehospital assessments when the noise on-scene makes auscultating Korotkoff sounds difficult. The results of this study suggest that palpated BP measurement should only be used when oscillometric and auscultated methods have failed or are unavailable. Additionally, although the study found that both oscillometric and auscultated methods have statistically significant net SBP differences when compared to RIBP, the differences were not greater than 5mmHg, and therefore may not have clinical relevance.
In practice, auscultated measurements are often used to verify oscillometric measurements if there is an unexpected reading or technical error. The consistency between these methods in the data collected here suggests that interchangeable use of these methods may be adequate, especially near normal SBP. However, other studies present conflicting evidence regarding their equivalency.Reference Skirton, Chamberlain and Lawson22-Reference Myers24
There are clear benefits to the variety of NIBP techniques available, and future research is needed to develop a conversion factor for each technique relative to RIBP. In this data set, differences between RIBP and palpated methods were consistent across the spectrum of BPs, suggesting that the error may be independent of the patient’s pressure. Conversely, as seen on the Bland-Altman plots, oscillometric and auscultated measurements were found to have greater variability in their differences across the wide range of SBP. Regardless of the NIBP technique, readings taken at the extremes of pressure tended to have greatest variability between the methodologies. This finding reaffirms the importance of RIBP measurement in critically ill patients.
Subgroups
Similar to the overall data set, two diagnostic subgroups had clinically significant differences in average net SBP when comparing RIBP versus palpated SBP. This may be of greater clinical relevance in stroke patients, where the average net difference in SBP was >18mmHg and the entire 95% CI was above the 5mmHg margin. Interestingly, as the BMI of the patients increased, there was less difference found between the techniques when compared to palpated BP, possibly suggesting the practice retains some utility in heavier patients. A comparison of medication subgroups revealed statistical and clinical significance between RIBP versus palpated measurements when looking at the vasopressor and sedation groups independently. However, data for those subjects on both vasopressors and sedation were not found to be significant. Again, conclusions from these data are limited, especially as the CIs for these subgroups fall below the threshold of clinical significance.
Limitations
The primary limitation in the study was small sample size, resulting in inadequate numbers to power all subgroup analyses. Participants were recruited as a convenience sample from a single center because some LARs declined to allow the investigators to enroll their family members, which precluded the investigators from enrolling a true random or consecutive sample. The investigators’ hospital access was also restricted to the neurological/trauma and medical ICUs. Cardiac and other surgical ICU patients may have further diversified the admitting diagnoses and included patients with different physiology and baseline health. While ICU patients afford study subjects with existing RIBP monitoring, their physiology and medication exposure differ from that of the typical prehospital population.
Though data collection was limited to 30 minutes, future studies might consider the effect of fluctuating BPs over time, especially in subject populations who are dependent on vasoactive medications. Simultaneous collection of each NIBP with the current RIBP reading may lessen the impact of this confounder. Also, randomizing the order in which each NIBP reading is collected would help minimize BP reading changes due to noise during the procedure as the investigator provides initial instruction of the procedure,Reference Schulze, Kroke and Saracci25,Reference Tolonen, Koponen and Naska26 circadian influence or patient wakefulness,Reference Mancia, Ferrari and Gregorini27,Reference Parati, Ochoa and Salvi28 and stress or discomfort. Future studies will depend on larger sample size and will aim to study these effects in the prehospital population.
Conclusion
This study found that external cuff pressures collected using auscultated, oscillometric, and palpated techniques generally under-estimated internal RIBPs. The clinically significant average difference between palpated SBP and RIBP challenges the practice of obtaining palpated BP to estimate actual SBP. The alternative use of auscultated and oscillometric methods may be appropriate as differences between the measurements were non-significant. Additional studies are required to better quantify the margin of error intrinsic to these commonly used NIBP techniques to ensure accurate interpretation of this vital sign.
Conflicts of interest/funding
This research did not receive any specific grant from funding agencies in the public, commercial, or not-for-profit sectors. The authors have no conflicts of interest to report.
Supplementary Material
To view supplementary material for this article, please visit https://doi.org/10.1017/S1049023X20000916