After the Civil War (1861–65) and Reconstruction (1865–76), the Democratic Party worked to reestablish white dominance and solidify racial boundaries in the American South. But by the early 1890s, Democratic control of southern ballot boxes—and potentially the racial hierarchy it supported—was threatened by the Populist Party, a left-wing opposition movement led by small farmers and laborers, both white and Black (Abramowitz Reference Abramowitz1953; Gerteis Reference Gerteis2007; Ali Reference Ali2011). To stem the rising Populist tide, some empirical studies suggest that Democratic supporters turned to lynching Black citizens in areas where the Populists were well-organized (Inverarity Reference Inverarity1976; Olzak Reference Olzak1990; Epperly et al. Reference Epperly, Witko, Strickler and White2020); acts of collective violence reasserted white supremacy and acted as a deterrent to further Populist mobilization. Other studies, however, find little evidence of such a relationship (Soule Reference Soule1992; Tolnay and Beck Reference Tolnay and Beck1995).
In light of these conflicting findings, we argue that scholars of lynching need to look beyond the Populist Party, focusing instead on the broader populist movement. If populism was the disruption to the social order that caused Democratic activists seeking to maintain the social order to lynch, then the origins of the Populist Party and its agenda need to be considered. Therefore, we consider the first organization of this period that promoted and spread a populist message throughout the South, the Southern Farmers’ Alliance.
The Alliance, which emerged as a regional force around 1888, became a large organization of rural white farmers by the early 1890s. It is also the organization from which the Populist Party emerged (e.g., Hicks Reference Hicks1959 [Reference Hicks1931]; Schwartz Reference Schwartz1988); the party’s agenda was taken directly from the Alliance (Hirano Reference Hirano2008: 137–38). Since populism itself was a challenge to the Democratic establishment, the Alliance threatened the social order well before the Populists ever ran a single candidate for office. If Democratic supporters wanted to maintain their political and social dominance, they needed to deter Alliancemen from agitating too vigorously for change while working to keep them from potentially supporting and voting for the new Populist Party. Lynching was one potential solution to keeping the populist threat under control by asserting Democratic power and reaffirming racial boundaries. We hypothesize, then, that lynching was used more frequently as a tool to reinforce the social order and quell populist sympathies where the Alliance had more local chapters, known as suballiances.
Yet how the Alliance related to the Populists and Democrats varied across states. Thus, state context may have played an important role in the relationship between Alliance organizational density and lynching. In some states, Alliance leaders and members were convinced a new political party was needed, hence the oft-cited observation that the Populist Party developed from the Alliance (e.g., Hicks Reference Hicks1931; Schwartz Reference Schwartz1988). In these states, such as North Carolina (Hicks Reference Hicks1925), Alabama (Hild Reference Hild2007: 153–55; Webb Reference Webb1997: 86–113), and Texas (Martin Reference Martin1933; Barnes Reference Barnes1984: 30–57), lynching may have been used to deter Alliancemen from supporting the creation of—and later, voting for—such a Populist Party. In other states, Alliance leaders and members formed relationships with local Democratic leaders, who sought to appeal to them with populist rhetoric. In these states, such as South Carolina (Kantrowitz Reference Kantrowitz2000a, Reference Kantrowitz2000b), Tennessee (Lester Reference Lester2006: 157–207), and Mississippi (Halsell Reference Halsell1945), strong Populist Parties never formed, so if there is a populism-lynching connection, it may have been the result of Democratic efforts to reaffirm the racial hierarchy and the social order in locations where the Alliance had been stronger. However, the various studies cited here do not provide guidance on how state context may affect our hypothesis concerning greater numbers of Alliance organizations and lynching.
Therefore, to test this hypothesis and investigate the potential importance of state context to the populist threat, we study two neighboring states from those mentioned above: North Carolina, where the Alliance was able to create a strong Populist Party, and South Carolina, where the Democratic Party formed relationships with Alliancemen and a competitive Populist Party never developed. We estimate models of lynching at the county level with counts of local Alliance organizations (the origins of the populist threat) and Populist Party vote percentages (used in Epperly et al. Reference Epperly, Witko, Strickler and White2020), in addition to other factors traditionally used in empirical studies of lynching.
The results show that the Alliance is systematically related to lynching in one of the two states (South Carolina). Thus, we conclude that state context did affect the Alliance-lynching connection. Specifically, in North Carolina, we find no relationship between lynching and Alliance organizing. These findings support studies that find no connection between the Populist Party and lynching (Soule Reference Soule1992; Tolnay and Beck Reference Tolnay and Beck1995). They, further, add to the literature by suggesting that where the Alliance created vibrant county-level environments and populism and biracial cooperation could succeed, Democrats did not (or perhaps could not) use lynching to solidify the party’s position. Likely, this is because lynching would have been an ineffective deterrent to populist organizing.
However, in South Carolina, where the Democratic Party actively worked to coopt the Alliance’s agenda and prevent the formation of a Populist Party, lynching was more prevalent where the Alliance had more local organizations. Here, we believe that Democratic supporters used lynching to exert control over any remaining, dissenting former Alliancemen, as well as to maintain the social order. This is a new finding that connects populism, and not simply the Populist Party, with lynching.
Overall, these results demonstrate that the Southern Farmers’ Alliance is a critical piece to understanding populism and its connection (or lack thereof) to lynching. They also signal that future research needs to study the causes and consequences of lynching in the late nineteenth century American South with an eye towards the interplay between the Alliance, populism, and Democrats in each of the former Confederate states.
From the Farmers’ Alliance to the populist party
The Southern Farmers’ Alliance,Footnote 1 which developed from the Farmers’ State Alliance in Texas,Footnote 2 was a federated association that began to expand throughout the region in the late 1880s. It grew in prominence by merging with the Louisiana Farmers’ Union in 1887 and absorbing the Agricultural Wheel, which was strong in Arkansas, soon after. Continuing its efforts to expand, the Alliance gained popularity among struggling white farmers and witnessed exponential growth across the South. Given the federated structure of the association and the localism of the largely rural South, power was concentrated in local groups called suballiances, which were key to organizing, recruiting, and mobilizing white farmers. Ultimately, the Alliance reached its peak membership, claiming over one million members, in 1890 (Hicks Reference Hicks1959[1931]; McMath Reference McMath1977[1975]), despite national leadership failing to build a strong, financially viable national organization (see Hofstadter Reference Hofstadter1955: 103; Chamberlain et al. Reference Chamberlain, Yanus and Pyeatt2020).
The Alliance’s policy goals—outlined in the 1890 Ocala Demands—were particularly appealing to struggling farmers in cotton regions suffering from declining market value (Schwartz Reference Schwartz1988)—the same areas most prone to lynching events during economic downturns (e.g., Raper Reference Raper1933; Beck and Tolnay Reference Beck and Tolnay1990). Among the Alliance’s key policy proposals were the much-promoted “subtreasury plan,” whereby the federal government would establish offices in counties to gather and store agricultural products for farmers; in return, farmers received four-fifths of the products’ value up front in paper money, with 1% interest charged so long as the goods were sold within twelve months. The Ocala Demands also called for government ownership of railroads and the free circulation of silver. These demands also received support from the Colored Farmers’ Alliance, which remained separate but collaborated with the Southern Farmers’ Alliance (Abramowitz Reference Abramowitz1953; Dann Reference Dann1974; Gerteis Reference Gerteis2007: 140–45).
Democrats were quick to take notice of this mass mobilization and, in many states, Alliance-supported Democrats swept into office in the 1890 elections. However, once in office, Democrats created little change (see Proctor Reference Proctor1950: 164–65). Debates soon raged among Alliance leadership and membership—the former most concerned with political goals, the latter with economic reforms (Schwartz et al. Reference Schwartz, Rosenthal and Schwartz1981)—over whether or not to create a new political party. While not all were in favor, many southern Alliancemen lent their support to the creation of the People’s or Populist Party, which essentially adopted the Ocala Demands in its Omaha Platform of 1892. This transition to partisan politics marked the end of the national (and most state) Farmers’ Alliance(s) (Chamberlain et al. Reference Chamberlain, Yanus and Pyeatt2020).
The Alliance-lynching connection
The rapid rise and fall of the Alliance—and its subsequent rebirth as the Populist Party—is potentially important to the study of lynching. The Alliance was a mass movement that activated rural, white southerners’ political potential, and the group’s dissolution resulted in a large group of citizens whose partisan loyalties were up-for-grabs by both the Democrats and the Populists. By adopting the Alliance’s agenda almost wholesale, the Populists made a strong push for both Black and white farmers’ support (Gerteis Reference Gerteis2007: 145–49). Seeing the Populist Party as an emerging threat to the social order, the Democratic Party and its leaders also attempted to co-opt some Alliance goals, striving in the early 1890s to both thwart Populist Party organizations and to limit the party’s appeal to voters.Footnote 3
Each suballiance, then, represented a mobilized group of citizens that either the Populists or the Democrats could try to recruit in support of their electoral goals. Counties—the main electoral unit in the postbellum South—with more suballiances were particularly important battlegrounds due to the number of potential voters up-for-grabs. For the reasons discussed above, Populists enjoyed a natural advantage in these locations; Democrats saw suballiance-rich counties as particularly potent threats to the social order due to the large number of potential defectors. In an attempt to promote party loyalty, the Democrats, thus, may have been particularly inclined to use lynching to reaffirm racial boundaries in these places (see Smångs Reference Smångs2016b).Footnote 4 Such a strategy would be consistent with studies showing more lynchings occurred in areas with high Populist support. There was a need to react to and disincentivize Populist voting, and lynching was one potential way to achieve this. Alternatively, in counties where former Alliancemen were already leaning towards or supportive of the Democratic Party, lynching may have been used to solidify the white supremacist regime. This would tamp down interest in creating a Populist Party altogether and proactively help to maintain Democratic dominance. In both cases, Democratic supporters had to pay attention to the electoral and social threat posed in counties with more suballiances, and lynching was a means through which white, Democratic dominance could be affirmed while undercutting the Populist Party.
In total, the mixed results of the existing literature on the Populist-lynching connection may benefit from a focus on the Alliance-lynching connection, with emphasis placed on the transition from the large, federated association to partisan politics. This was the point at which white hegemony and Democratic rule was at risk—a risk greater in areas in which the Alliance was strong. How this transition occurred, then, is of importance for understanding the potential Alliance-lynching connection.
Bordering states moving in opposite directions: The Carolinas
A good comparison of different transitions from the Alliance to partisan politics can be found in the cases of North and South Carolina. Though neighboring states, they did not experience the rise of the Farmers’ Alliance, its demise, and the creation of the Populist Party in the same way. In the early part of the period, the Farmers’ Alliance was strong and populist sentiment was high in both states. But, as time went on, political elites in North and South Carolina responded very differently to the Populist Party, resulting in varied political alliances in the two states. And, while neither of the Carolinas experienced as many lynching events as Deep South states such as Mississippi and Georgia, between 1888 and 1895, white mobs killed Black residents in 28 lynching events in South Carolina and 13 lynching events in North Carolina. These factors—coupled with the availability of complete data for both states’ Alliances—make North and South Carolina excellent comparative test cases to better understand the complex relationship between lynching, the Alliance, and the Populist Party.
In North Carolina, the Farmers’ Alliance spread under the watchful eye of Leonidas Lafayette Polk, editor of the state’s major agricultural newspaper, The Progressive Farmer, which helped spur an agricultural awakening in 1887 and 1888. A staunch advocate of political and economic reform and the Alliance’s subtreasury plan, Polk’s inability in 1890 to motivate Democratic politicians who initially espoused support for the group’s demands placed him at the forefront of a movement for a third party. This culminated with the creation of the People’s (Populist) Party in early 1892. Likely slated to be the party’s presidential candidate, Polk died suddenly in June 1892.
After Polk’s death, Tar Heel Alliancemen opposed to the third-party plan rallied to the Democratic cause. This was in large part because the Democrats nominated Elias Carr, the Alliance’s state president from 1889 to 1891 and a staunch opponent of third-party activism, as their gubernatorial candidate in 1892 (Steelman Reference Steelman1980); he was victorious. North Carolina farmers, thus, left the Alliance in large numbers, mirroring similar patterns elsewhere. Yet, unlike in other states, a remnant of the North Carolina Farmers’ Alliance remained throughout the 1890s and into the early twentieth century. Led by Marion Butler, Alliance supporters helped foster the Populist Party’s growth in the state and found common anti-Democratic ground with North Carolina Republicans. By fusing tickets with Republicans at the state level—and simultaneously maintaining ties to the Democrats nationally—a Populist-Republican state legislature was elected in 1894. The 1896 election brought more success, with Republicans winning the governorship and a fusion government leading the state (Hicks Reference Hicks1925). However, Democrats responded with a vehemently white supremacist campaign in 1898, and Butler (who was no fan of Blacks in government) and the Populists found themselves trying to fend off claims of supporting Black power while also trying to maintain favor with the Republican Party (which received significant support from Black voters). Ultimately, the Democrats reasserted control and limited Black voting rights, thereby creating a largely one-party state by 1900 (Edmonds Reference Edmonds1951).
In South Carolina, the situation was quite different. The role of the Farmers’ Alliance must be understood in light of “Pitchfork” Ben Tillman’s efforts to seize control of the Democratic Party from its Bourbon, conservative leadership in Charleston and Columbia. Speaking as the voice of white farmers and dubbed the “Agricultural Moses,” Tillman’s efforts to organize farmers in the mid-1880s preceded the arrival of the Farmers’ Alliance between 1888 and 1889. Naturally, these earlier efforts laid the groundwork for the state’s Alliance to join forces with Tillman—an outspoken white supremacist who supported the use of violence, including lynching, to suppress and oppress Black voices—in the 1890 gubernatorial election. After the election, Tillman’s Democrats showed no willingness to work with Republicans, and as the Alliance’s influence waned, his appeal to white farmers severely undercut enthusiasm for the Populist Party in the state (Kantrowitz Reference Kantrowitz2000a, Reference Kantrowitz2000b). In fact, while the Populists received votes for president in 1892, there was no Populist gubernatorial candidate in 1894; Tillman’s competition in that race was a disgruntled former Democrat who attracted votes from the Bourbon faction.
To summarize, the Alliance in North Carolina aided in the creation of the most electorally successful Populist Party in the South. This contrasts with South Carolina, where the Alliance was quickly captured by the Tillman-led Democrats, resulting in the least electorally successful Populist Party in the South. Given these two very distinct histories, we expect that the Alliance’s presence in a county may relate more to lynching in South Carolina than in North Carolina because Tillman’s capture of the Alliance preempted attempts to foster a third party. Instead of Democrats supporting lynching as a means to suppress Populist voting (Inverarity Reference Inverarity1976; Olzak Reference Olzak1990; Epperly et al. Reference Epperly, Witko, Strickler and White2020), the Democrats captured the support of likely Populist Party identifiers from the outset and channeled that mobilization into their own party. We do not argue here, then, that the Alliance itself was sponsoring violence; instead, we argue that it could be a key piece in the complex network of organizations and groups that helped to foster a civic environment in which lynching became popular.
Data
One of the most significant challenges of studying the Southern Farmers’ Alliance is a lack of available data. Unlike most other large, federated voluntary associations of the late nineteenth century, the Alliance’s record-keeping and publications were often incomplete and inconsistent. Only sporadic records have survived in libraries or archives, the result of an organization that outgrew its capacity to monitor its growth between 1888 and 1891 and did not survive long enough to consolidate disparate local records at a national headquarters.
Data, however, is available on the Alliance in some states and years. Specifically, counts of suballiances, the local groups in the Alliance, by county are available for North Carolina in 1889 and South Carolina in 1890 and 1891, years in which the Alliance was active and popular in both states. The North Carolina counts come from a list printed in The Progressive Farmer, the main periodical of the state’s Alliance (1889). The South Carolina counts are derived from state proceedings of the Farmers’ Alliance (1890) and a transcribed directory of all South Carolina suballiances (1891) created by the Works Progress Administration.Footnote 5 Both are available in the Records of the South Carolina Farmers’ State Alliance, 1888–99 in the South Caroliniana Library, Graniteville Room, at the University of South Carolina. Since the two South Carolina counts are highly correlated (.98), we create an average count based on these reports.
The models shown in this analysis employ counts of suballiances because they are the most theoretically-appropriate variable for our framework. Each local suballiance was an opportunity to mobilize white support, increasing the likelihood of a lynching event and/or the total number of lynchings during this period. A count, moreover, is a better representation of Alliance strength than a per capita measure because evidence suggests that most Alliance identifiers were not dues-paying members (Hofstadter Reference Hofstadter1955: 103); in part for this reason, complete membership data are unavailable. And, without complete membership statistics, we cannot say whether more citizens were mobilized in counties with higher ratios of suballiances to population or counties with lower ratios of suballiances to population. It may be, for example, that individual chapters drew larger followings in the latter case, perhaps due to higher population density. (We do, however, estimate and discuss per capita models in the Appendix.)
To measure lynching activity, we rely on the most recent version of Tolnay and Beck’s southern lynching dataset (1995), available through Bailey and Tolnay’s (Reference Bailey and Tolnay2015) Victims of Southern Mob Violence data project. The dataset uses the NAACP’s four-part definition of a lynching. To classify an incident as a lynching, there must be: 1) evidence of a killing; 2) the killing must have occurred illegally; 3) three or more persons must have taken part in the killing; and, 4) the killers must have claimed to be serving justice or tradition (Ames Reference Ames1942, as cited in Bailey and Tolnay Reference Bailey and Tolnay2015: 3).
We focus on lynchings that occurred in North and South Carolina from 1888 to 1895, or the period marking the rise of the Farmers’ Alliance throughout the region (and in the Carolinas) and the last year before the Populists moved into the national Democratic Party and Republican Daniel Russell won the gubernatorial election in North Carolina. Excluded were lynching events solely targeting white citizens (11 in North Carolina and two in South Carolina) and lynchings conducted by a Black mob (two in North Carolina and three in South Carolina, one of a white man), as the focus of our efforts are on white violence against Black citizens.
Two variables are of particular interest. The first measure is a count of the number of lynching events per county between 1888 and 1895. The second is a dummy variable signifying that at least one lynching event occurred in a county during the time period in question. In total, 12 North Carolina counties and 18 South Carolina counties had at least one lynching event between 1888 and 1895, with 11 of the 13 lynching events in North Carolina happening between 1888 and 1892, the prime period of Alliance activity, and 18 of the 28 lynching events in South Carolina happening between 1893 and 1895, after the Alliance’s peak period of strength.
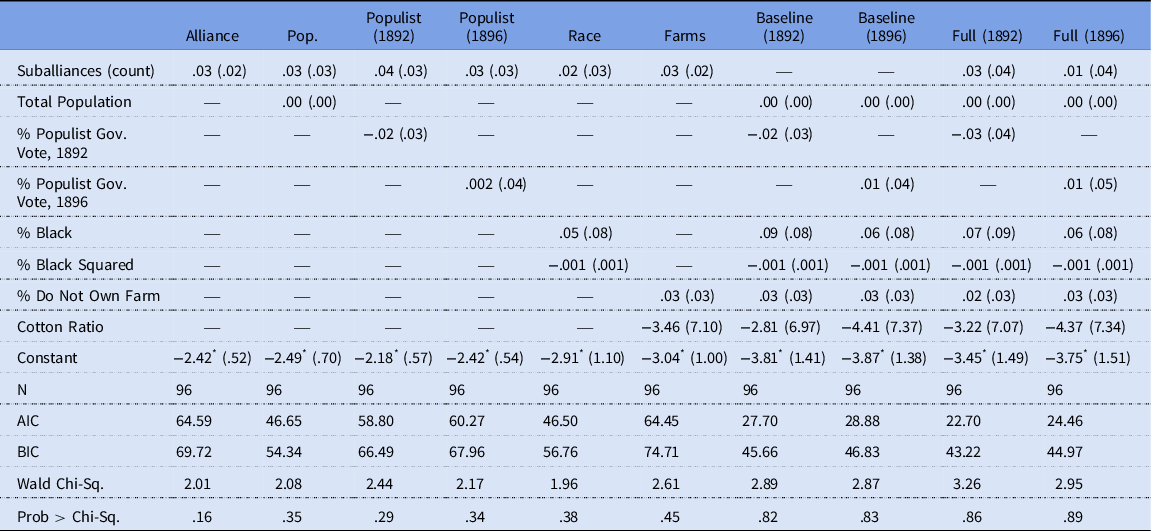
In South Carolina (n = 35 counties), there are eight counties with more than one white-on-Black lynching during this period; therefore, we have enough cases to estimate both a count model of total lynchings and a logistic regression model using a dummy variable indicating at least one lynching event (=1).Footnote 6 In North Carolina (n = 96 counties), there is only one county with more than one lynching event, so we estimate models only using the dummy variable.
Finally, Populist Party voting must be considered. For North Carolina, we use the percentage of the vote for the Populist gubernatorial candidate in 1892 and 1896; in South Carolina, we use the percentage of the vote for the Populist presidential candidate in 1892.Footnote 7 As noted earlier, the latter is the only major race featuring a Populist Party candidate in South Carolina, and in North Carolina, 1892 presidential and gubernatorial voting were highly correlated (.89). Therefore, these choices are reasonable given the available electoral data.
In multivariate models, we also control for a range of factors shown to predict lynching events. First, to control for the possibility that greater population increased the probability of a lynching event, we account for the total population of a county, using 1890 U.S. Census data. Second, we include the percentage of a county’s population that is Black. This is also generated using 1890 U.S. Census data, with the expectation that white-on-Black lynching events were more prevalent in counties with larger minority populations (Raper Reference Raper1933; Blalock Reference Blalock1967; Reed Reference Reed1972; Corzine et al. Reference Corzine, Creech and Corzine1983). Following the example of these previous studies, we also include a squared value of the percent Black to test for non-linear effects. Third, we use 1890 U.S. Census data to estimate the percentage of farmers working farms they do not own. There are two reasons to include this predictor, though they potentially work in opposite directions. On the one hand, especially before 1900, lynching events tended to occur in rural areas, where farm tenancy was important (Corzine et al. Reference Corzine, Huff-Corzine and Creech1988; Tolnay and Beck Reference Tolnay and Beck1995; Smångs Reference Smångs2016a). On the other hand, Alliance leadership tended to be wealthier, landed farmers, and its membership was solidly yeoman but with more tenant membership as the association expanded (Schwartz et al. Reference Schwartz, Rosenthal and Schwartz1981).Footnote 8 Fourth, we measure the impact of the cotton economy using Hagen et al. (Reference Hagen, Makovi and Bearman2013) ratio of acreage of cotton-producing farmland and total agricultural acreage (see also Epperly et al. Reference Epperly, Witko, Strickler and White2020). While cotton farming was not as important in North Carolina as it was in South Carolina, cotton’s significant effect on lynching activity in previous analyses (Beck and Tolnay Reference Beck and Tolnay1990; Tolnay and Beck Reference Tolnay and Beck1995; Bailey and Snedker Reference Bailey and Snedker2011; Epperly et al. Reference Epperly, Witko, Strickler and White2020) necessitates inclusion of a variable measuring its economic impact.
Overall, the goal of this analysis is to study the statistical relationship between the Farmers’ Alliance, the Populists, and lynching events in the late 1880s and early 1890s, in North and South Carolina, at the county level. More precise quantitative estimates are not possible given available data and the short duration of the study. Nevertheless, this study marks a critical step forward in studying the degree to which Farmers’ Alliance organizing and Populist Party voting were related to Black lynching events, and provides important insights for future lynching research.
Results
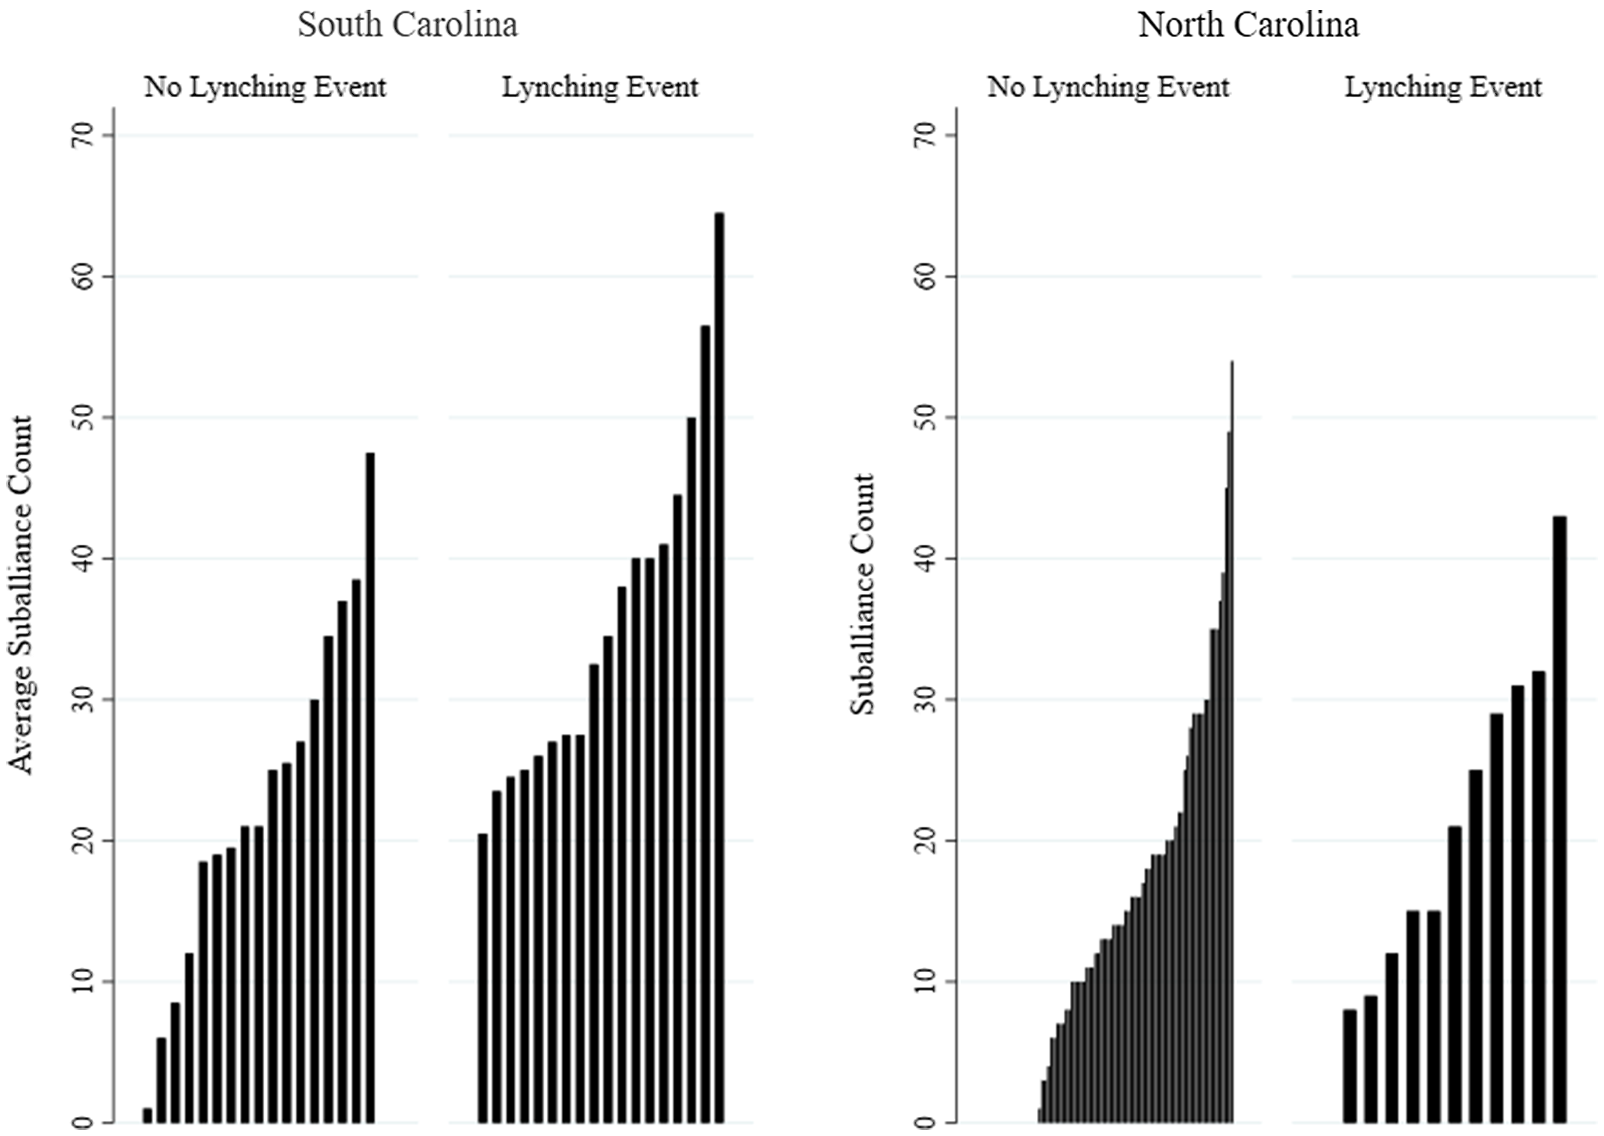
The first step in studying this relationship is to examine whether the average number of suballiances in a county varies based on whether (=1) or not (=0) a county had a lynching event between 1888 and 1895. This can be seen visually in Figure 1. For South Carolina, there is a statistically significant difference (p = .0043, two-tailed t-test); counties without a lynching event have a lower mean count of suballiances than counties with a lynching event (23 and 35.7, respectively). For North Carolina, the difference is not statistically significant (p = .17), and the means are closer together (14.6 and 20, respectively). Still, the relationship is in the expected direction; more suballiances existed in counties that experienced lynching events. In total, however, there appears to be a clearer statistical connection between lynching and the Farmers’ Alliance in South Carolina than in North Carolina.
Counts of suballiances, by state and presence of lynching event.
Sources: See Data section.
Note: Each bar represents the count of lynchings in a county, n = 35 in South Carolina and n = 96 in North Carolina.

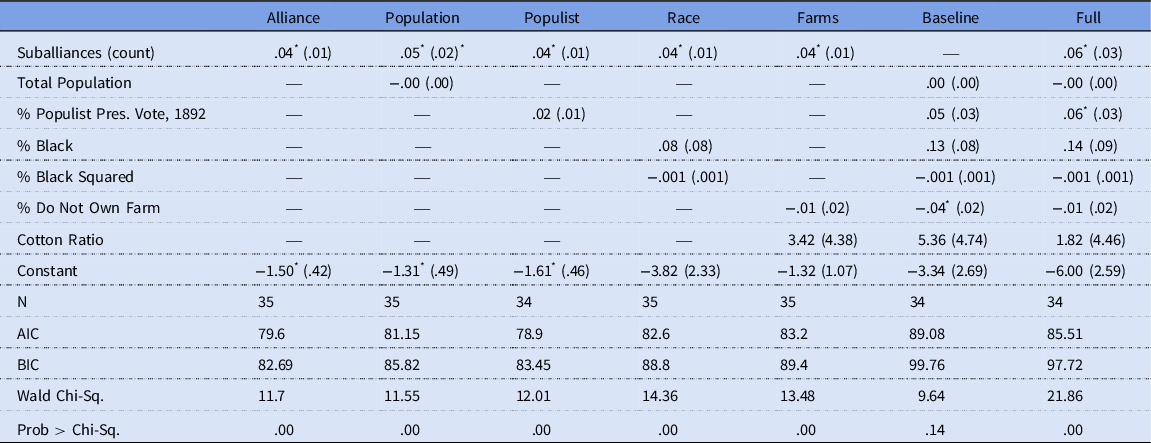
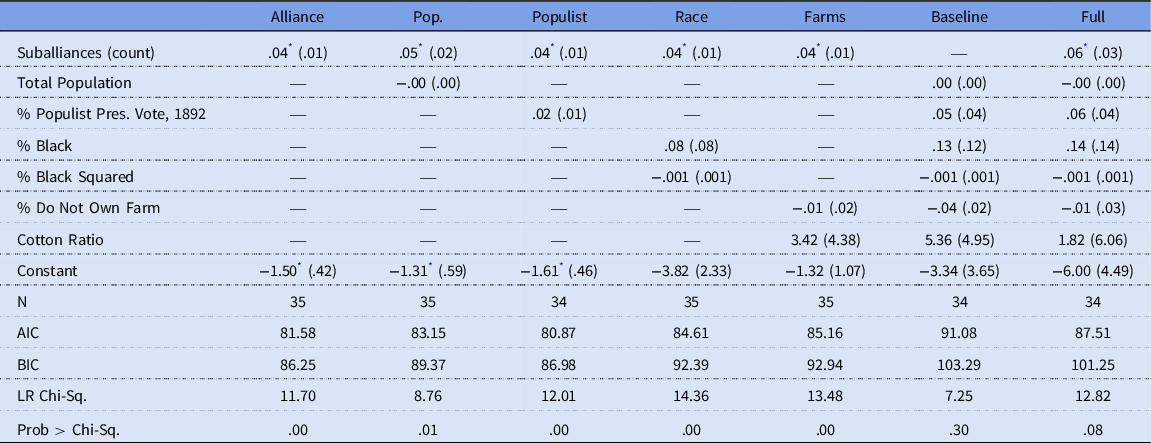
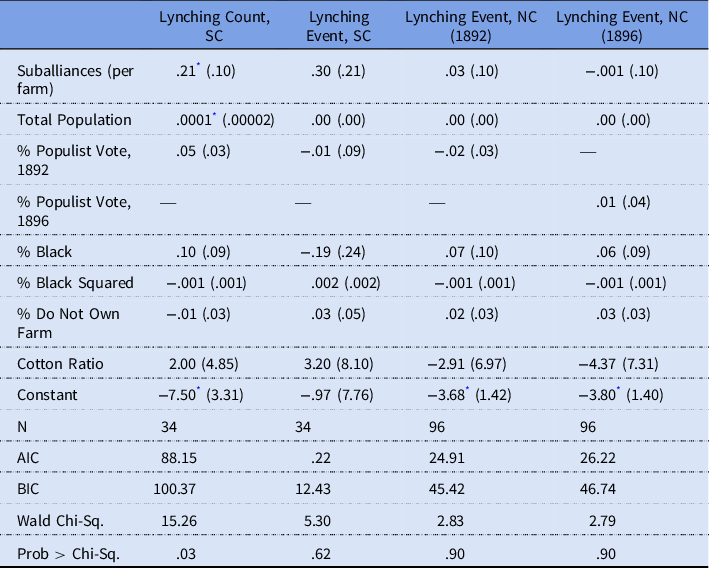
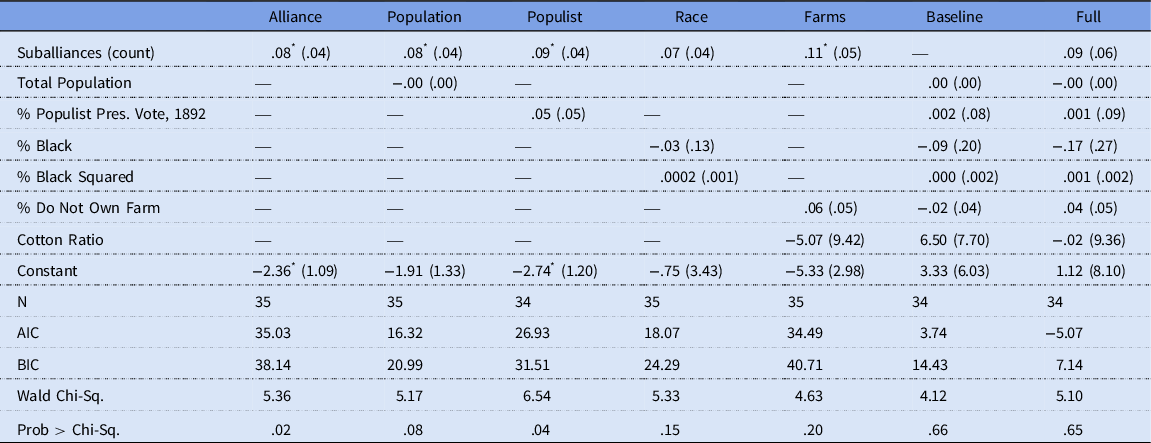
Next, we estimate models for each state, with lynching events and lynching counts serving as dependent variables. Models predicting lynching counts are estimated using Poisson regression with robust standard errors, and the presence or absence of a lynching event is estimated using Firth logistic regression.Footnote 9 Both are good choices for small samples and rare events. Iterative count models for South Carolina are presented in Table 1, with iterative event models shown in Table 2. We begin our analysis with only the suballiance variable, and then add total population, Populist voting, percent Black and percent Black squared, and the two farming (economic) variables in successive models, before presenting baseline (all predictors except suballiances) and full (including suballiances) specifications.
Predicting lynching counts in South Carolina

Sources: See Data section.
Notes: Coefficients with standard errors in parentheses. Models are Poisson regressions with robust standard errors.
* p < .05, two-tailed test.
Predicting lynching events in South Carolina
Sources: See Data section.
Notes: Coefficients with standard errors in parentheses. Models are Firth logistic regressions.
* p < .05, two-tailed test.
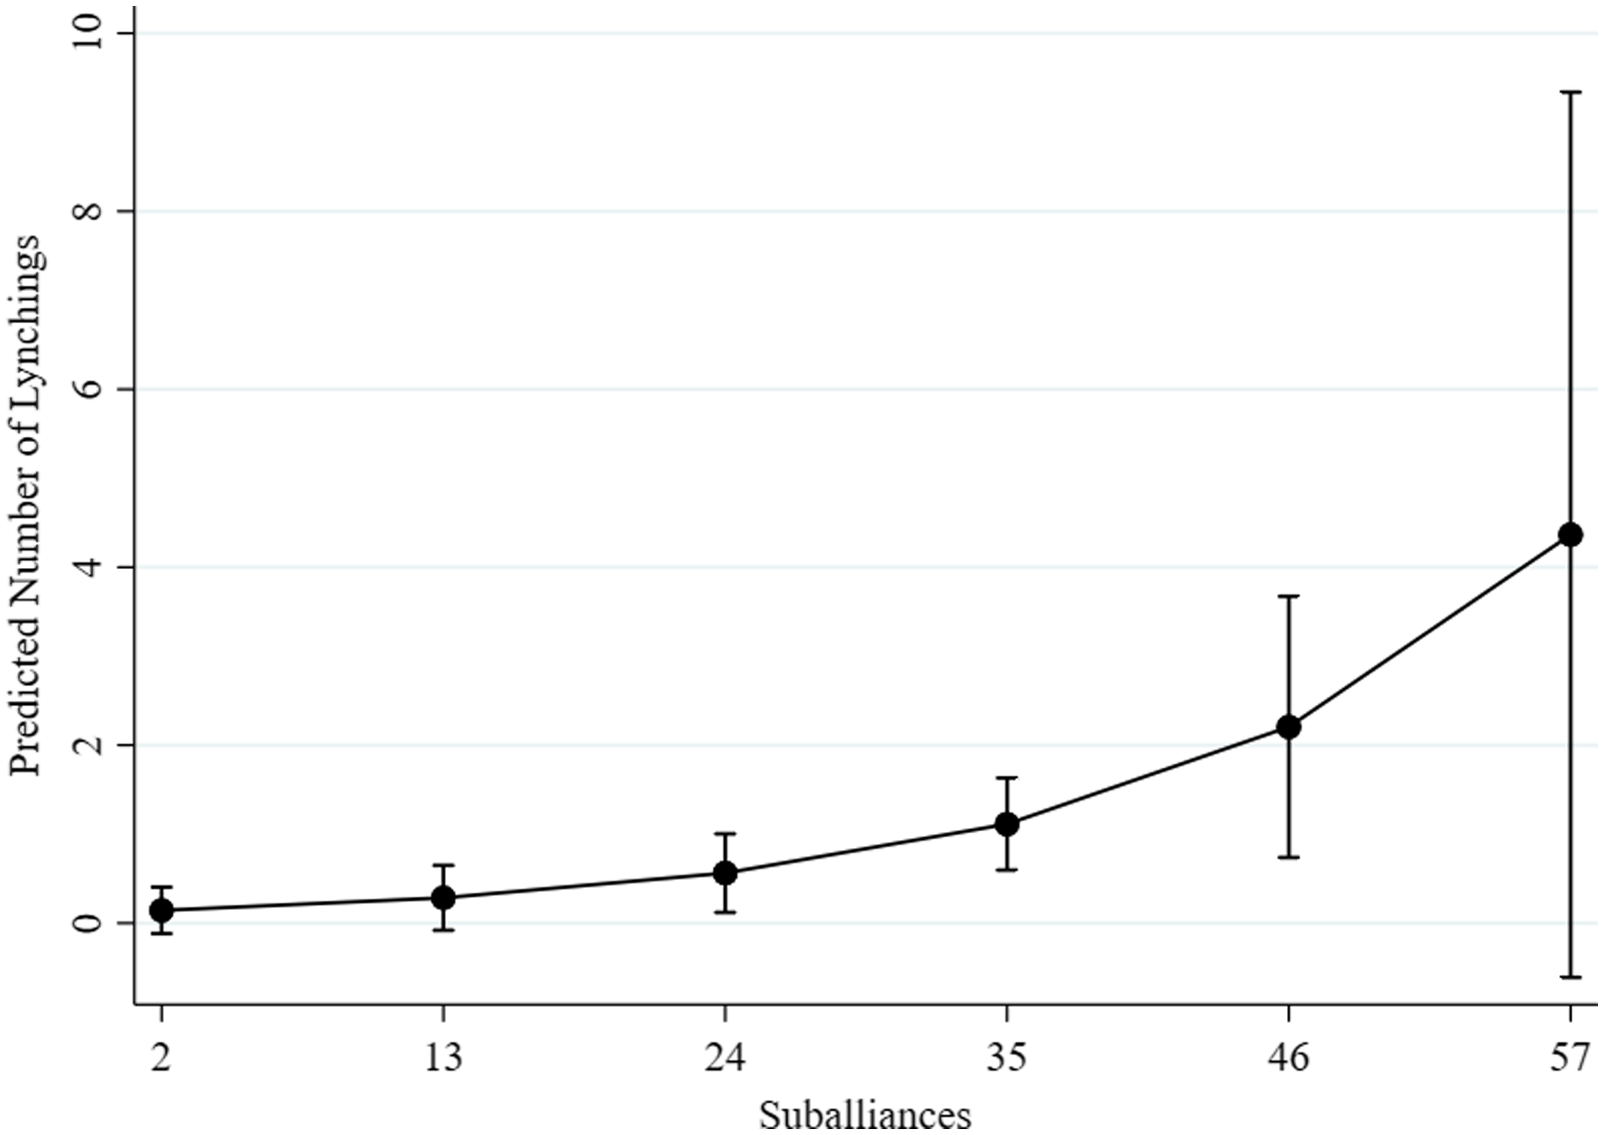
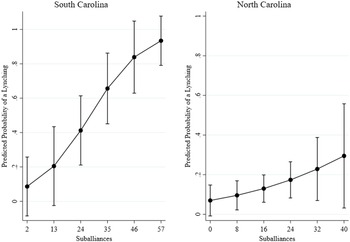
A few points stand out. As shown in the count models in Table 1 and illustrated in Figure 2,Footnote 10 the number of suballiances in a county is a positively signed, significant predictor of lynching counts by county in every specification. Only one other predictor—Populist Party voting for governor in 1892—has a statistically significant effect on lynching counts, and only in the full model. The event models in Table 2 also underscore the importance of suballiance counts for predicting the presence of a lynching event in a county; in four of the seven model specifications, suballiances are the only statistically significant predictor. In predictions generated from the Populist model, which are presented in Figure 3, the results indicate that a county with 13 suballiances has a 20% chance of a lynching; in a county with 46 suballiances, this probability rises to over 80%. Thus, these models provide compelling evidence that the presence of the Farmers’ Alliance is a strong correlate of lynching in South Carolina. Particularly given the timing of lynching events mentioned earlier, it seems that environments that sustained the Alliance evolved into environments conducive to lynching.
Predicted number of lynchings, by counts of suballiances, in South Carolina.
Sources: See Data section.
Note: Predicted estimates from the full lynching model (Table 1).


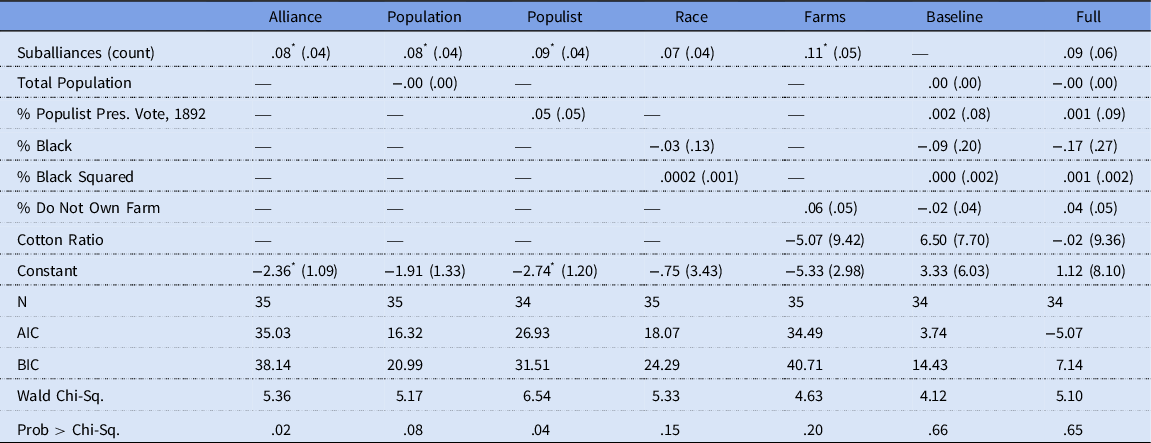
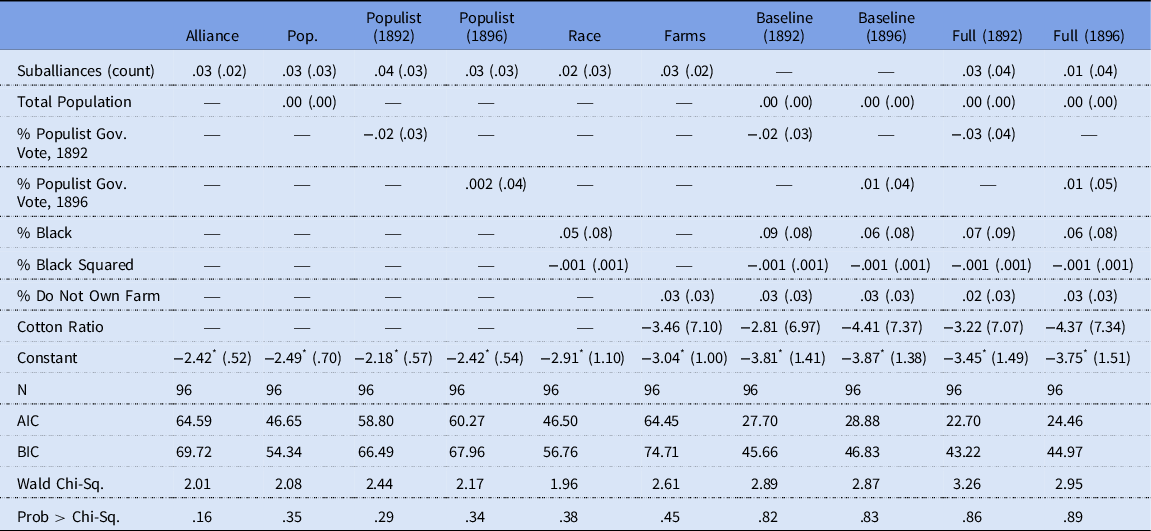
In North Carolina, shown in Table 3, we find no evidence that Farmers’ Alliance presence predicted lynching during this period. These results are underscored in Figure 3. The trajectory illustrated in this figure for North Carolina, though slightly positive, never attains statistical significance. Although the probability of a lynching event increases modestly, it always remains well below 40%.
Predicting lynching events in North Carolina
Sources: See Data section.
Notes: Coefficients with standard errors in parentheses. Models are Firth logistic regressions.
* p < .05, two-tailed test.
It also bears note that we find no evidence of a relationship between lynching and any of the control variables, including Populist Party voting, in North Carolina. One potential explanation for the latter finding is that the complexity of partisan politics complicated the relationship between the Alliance and lynching; in addition, the relative rarity of lynching in North Carolina may have added a level of randomness to where these events occurred. Either way, it is noteworthy that, in the state in which southern Populists had their greatest electoral successes, lynching events were not occurring where the Farmers’ Alliance or the Populists were strong, casting doubt on the theory that lynching events were Democratic-inspired events to tamp down Populist enthusiasm (Inverarity Reference Inverarity1976; Olzak Reference Olzak1990; Epperly et al. Reference Epperly, Witko, Strickler and White2020).
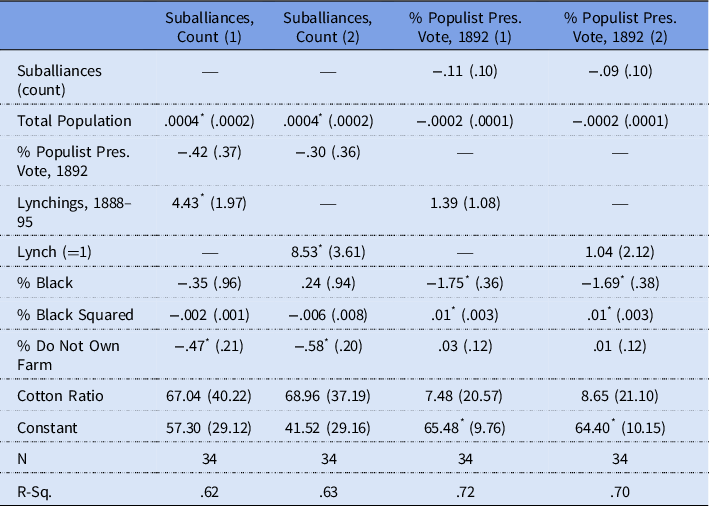
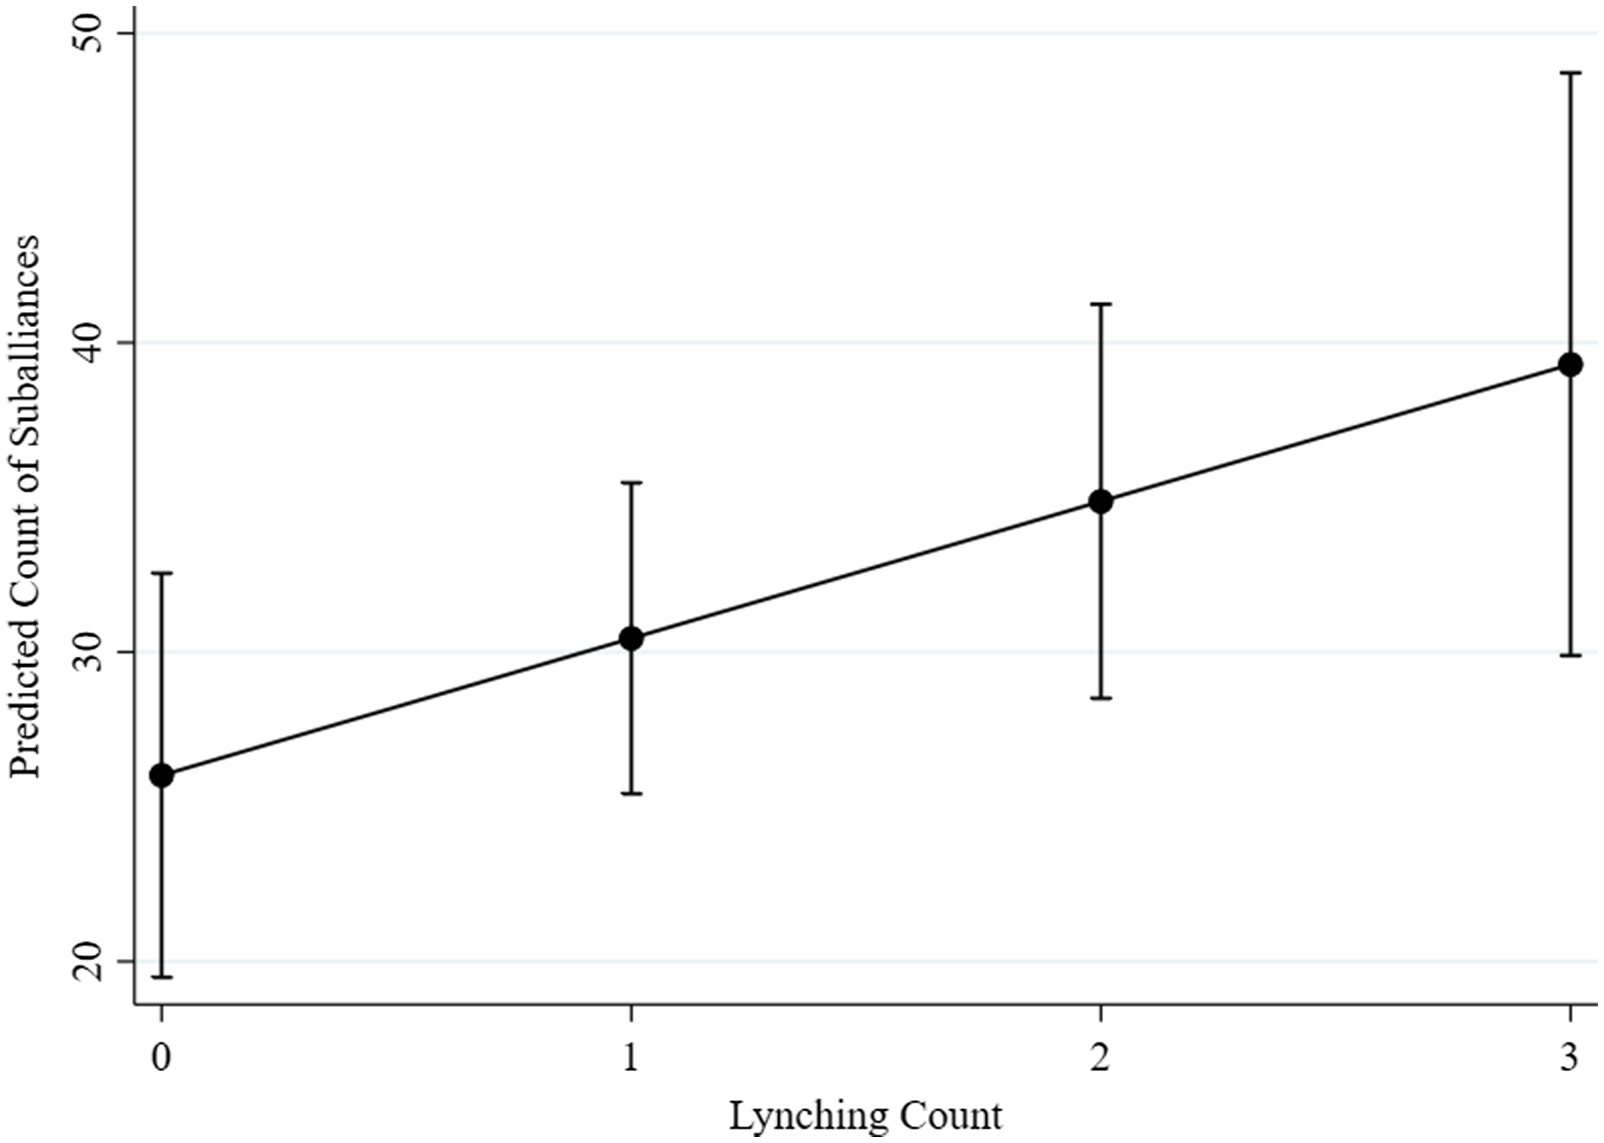
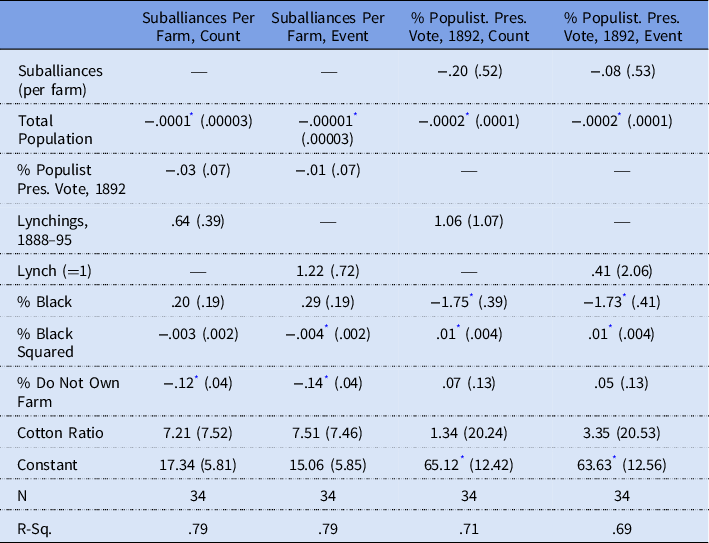
Given the findings for South Carolina and the lack of evidence of a connection in North Carolina, we must consider the possibility that the Farmers Alliance/Populist Party/lynching connection is stronger in the other direction, with lynching events predicting Alliance and Populist Party support. Such a finding would shed light on the supporters and mobilization of these two organizations. Table 4 shows the results of a series of OLS regression models estimating suballiance counts using Populist Party voting in the 1892 presidential election for South Carolina. Table 5 examines the same relationships in North Carolina using gubernatorial Populist voting in 1892 and 1896. Across both states, lynching (as a count or as an event variable) is only a positive, significant predictor of the average count of suballiances in South Carolina. As depicted in Figure 4, counties without any lynchings are estimated to have less than 25 suballiances on average; in counties with three lynchings, this estimate rises to an average of 40 suballiances. In South Carolina, then, there is a close relationship between lynching and suballiances.
Predicting farmers’ Alliance suballiances and populist voting in South Carolina

Sources: See Data section.
Notes: Coefficients with standard errors in parentheses. Ordinary least squares (OLS) regression models.
* p < .05, two-tailed tests.
Predicting farmers’ Alliance suballiances and populist voting in North Carolina

Sources: See Data section.
Notes: Coefficients with standard errors in parentheses. Ordinary least squares (OLS) regression models.
* p < .05, two-tailed tests.
Predicted suballiance count in South Carolina, by lynchings.
Sources: See Data section.
Note: Predicted estimates from the suballiances, count (1) model (Table 4).

Moreover, the average count of suballiances and Populist Party voting are negatively related in South Carolina, albeit not significantly. This indicates that where Populist voting did occur, it was not where the Alliance—generally supportive of Tillman—had been strong. This relationship persists despite the significant role other variables play in some of the models, whether lynching, the Black population, or the percentage of farmers who do not own farms. In conjunction with the lynching models in Table 1, the findings indicate that the Farmers’ Alliance was prevalent in the same milieu as lynching in South Carolina, but that the Populist Party’s connection to lynching was very weak. The Alliance-Democratic connection, however, was real, suggesting that it is possible that the Farmers’ Alliance may have been a mobilized constituency that Democrats in other parts of the South sought to harness and then use to support its pro-lynching sympathies.
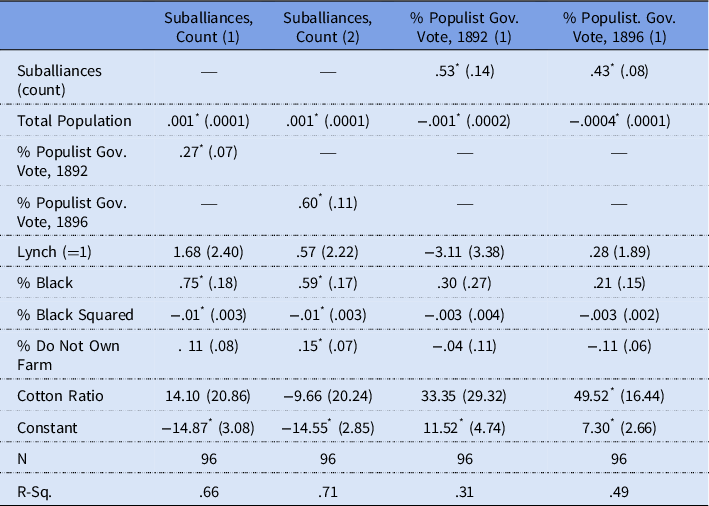
As shown in Table 5, lynching does not relate in any way to suballiances in North Carolina. Lynching is also never a statistically significant predictor of Populist Party voting in either state, and actually takes on a negative sign in the 1892 Populist voting models in North Carolina. Suballiance counts and Populist Party gubernatorial voting in 1892 and 1896 are positively related and statistically significant. The Populist Party’s success in North Carolina, then, owes a debt of gratitude to the mobilization of farmers via the Farmers’ Alliance. However, lynching events are not connected closely to either the Farmers’ Alliance or Populist support, confirming our intuition from Figure 1 that North Carolina’s lynching events were not directly related to the populism most often linked to southern lynching during this period.
Discussion and conclusion
In total, the findings clearly suggest that the Southern Farmers’ Alliance played a role in spreading populism and threatening the existing social order, though its connection to lynching depends on state context. In North Carolina, the Alliance had a strong and direct connection to the Populist Party, and populism had no connection to lynching. This suggests that the Democratic Party may have had little opportunity to, or interest in, capitalizing on lynching as a means of social control where the Alliance fostered a strong Populist Party. In these places, the costs of lynching were too high, and the potential payoffs in terms of social control were too low to make the activity beneficial at the ballot box or in society. But in South Carolina, where a strong Populist Party did not develop from the Alliance because the Democrats appealed to the mobilized white farmers with Tillman’s own brand of populism, there was a positive, significant relationship between more suballiances and more lynchings. It appears, then, that Democratic supporters sought to reaffirm the racial hierarchy in these counties while limiting Populist organizing among dissenting former Alliancemen. Therefore, the Alliance is central to arguments about populism and its relationship (or lack thereof) to lynching during this era.
The different empirical results in North and South Carolina suggest that there were significant state-by-state variations in the degree to which the Alliance and the Populist Party related to lynching as a form of social and political control. We therefore urge scholars to collect and analyze more complete data on the membership and organization of the Farmers’ Alliance throughout the South, and/or systematically gather qualitative evidence that could be coded to assess Farmers’ Alliance strength and/or messaging in states and localities. Through such work, it may be possible to better identify factors that enhanced or inhibited ties between the Alliance and the Populists, and how these affected efforts by Democratic supporters to control populism through lynching. This would ultimately advance scholarship on lynching by moving it beyond a simple emphasis on the Populist Party, and toward a more complete picture of the varied nature of the populist threat by addressing the origins of Southern populism (and the Populist Party itself) via the Alliance.
Likewise, given the lynching era’s (1883–1930) concurrence with the era in which federated associations of all stripes rose to prominence (Skocpol et al. Reference Skocpol, Ganz and Munson2000), similar efforts should be extended to other groups organizing in the South during the late nineteenth and early twentieth centuries, paralleling Bailey and Snedker’s (Reference Bailey and Snedker2011) work on church denominations. By the early 1890s, Confederate heritage associations like the United Confederate Veterans and the United Daughters of the Confederacy (UDC) developed and spread throughout the region, the latter organization being the premiere association connected to the Lost Cause message. The UDC erected monuments that at times mobilized women (Chamberlain and Yanus Reference Chamberlain and Yanus2021)—particularly white women in small urban areas with larger Black populations (Chamberlain and Yanus N.D.). Although lynching activity was on its slow decline by the time of the UDC’s ascendance, it is possible that Confederate heritage organizing fostered lynching events (and vice versa).
Appendix A
The appendix presents additional analyses to supplement those in text. To provide readers with context, we include brief explanations of each table here.
In Appendix Table A, we estimate the same South Carolina count models as presented in Table 1, but with negative binomial regressions. Though test statistics suggest that Poisson regressions with robust standard errors are more appropriate for these models, it is also possible to use negative binomial models. The results mirror those presented in text; the significant and substantive findings are robust across specifications.
Predicting lynching counts in South Carolina, negative binomial models

Sources: See Data section.
Notes: Coefficients with standard errors in parentheses. Models are negative binomial regressions.
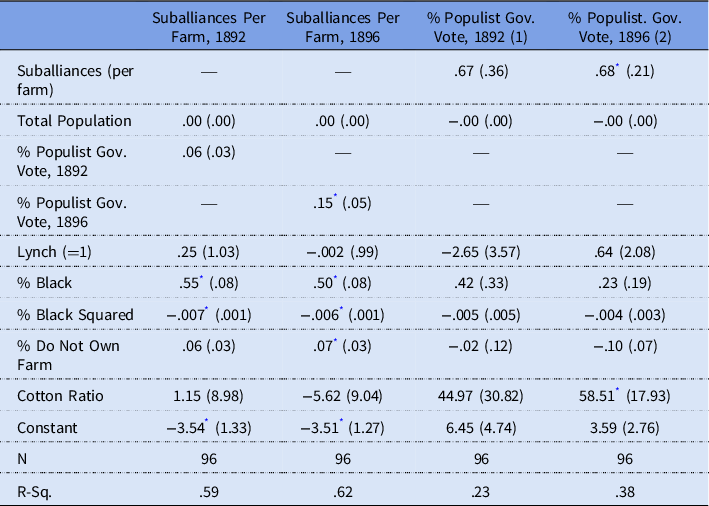
In Appendix Tables B–D, we estimate full models paralleling in-text tables using the per capita measure of suballiances (per farm) as a predictor of lynching counts and events (Table B), and as a dependent variable and a predictor of Populist voting in South Carolina (Table C) and in North Carolina (Table D). Appendix Table B reinforces the theoretical mechanism described in text. Specifically, it illustrates that per capita suballiances were not significantly connected to lynching in South or North Carolina; the depth of the organization did not matter, but the number of suballiances that mobilized white farmers did. In short, the more suballiances, the more opportunities to mobilize white sentiment, which, in South Carolina, was harnessed by the Democrats and was connected to lynchings.
In Appendix Table C, the per capita models reveal that suballiances per farm in South Carolina are not a product of lynchings, but are a product of increasing Black populations that begin to level off as the percentage Black increases; this differs from the in-text results, where lynchings are a consistent, positive predictor of suballiances. The percent that do not own a farm is negative and statistically significant, however, which does parallel the in-text results.
The Populist voting models, also shown in Appendix Table C, reveal that suballiances per farm never affect Populist voting in South Carolina, a finding that diverges from the in-text finding that total counts of suballiances depressed Populist voting. We believe the explanation for this is the same as offered for the results noted above for Appendix Table B. The models presented in Appendix Table C also show that the percent Black variables perform similarly to those in text. Taken together, these findings suggest that the lynching-Alliance connection in South Carolina stems from the mobilization of more local groups, regardless of the number of farms in a county.
Finally, Appendix Table D presents North Carolina models using the 1892 and 1896 Populist vote as both a predictor and a dependent variable. The results of the 1896 analyses match those presented in text; in this year, the results are the same for both total and per farm suballiances. However, the same cannot be said for 1892 Populist voting. In text, Table 4 reveals evidence that greater Populist voting in 1892 is significantly related to more total suballiances, greater percentages of the Black population (though less so as Black population increases), and a higher cotton ratio. The results for per farm suballiances shown in Appendix Table D, on the other hand, reveal that only percentage Black residents remains a significant predictor; Populist voting is not significantly connected to per farm suballiances. This finding provides another piece of evidence supporting the claim that more suballiances created more mobilization, which could be connected to Democratically-supported lynching (South Carolina) or Populist voting (North Carolina).
Appendix B
Per capita suballiance models

Sources: See Data section.
Notes: Coefficients with standard errors in parentheses. Count model is Poisson regression with robust standard errors. Event models are Firth logistic regressions.
Appendix C
Predicting per farm suballiances and populist voting (with per farm predictor) in South Carolina

Sources: See Data section.
Notes: Coefficients with standard errors in parentheses. Ordinary least squares (OLS) regression models.
Appendix D
Predicting per farm suballiances and populist voting (with per farm predictor) in North Carolina

Sources: See Data section.
Notes: Coefficients with standard errors in parentheses. Ordinary least squares (OLS) regression models.