I. INTRODUCTION
The Vickers indentation test is widely used to determine the hardness of materials including glasses. It is based on the indentation imprint left on the surface of material. However, glass shows an elasto-plastic behavior under stress, so that both elastic and inelastic deformations, such as plastic flow and densification, Reference Ernsberger1,Reference Peter2 take place under an indenter. Consequently, it has been noticed that the size and shape of indentation imprint after unload are different from those before unloading and that it changes depending on glass composition because the degree of permanent deformation or residual strain changes with glass composition. If a material is purely elastic, no mark should be left after unloading. The behavior of such material under an indenter has been studied by Lim and Chaudhri. Reference Lim and Chaudhri3 They performed in situ observations of indentation on polydimethylsiloxane (PDMS), which is an elastomer showing no plastic deformation, and found that the contact region under a Vickers indenter is not a square but bowed-in shape. They defined the ratio of the diagonal length to the opposite side length of the contact region as the bowed-in parameter and discussed the reason for causing a nonsquare shape. The ratio reported for PDMS is greater than 1.414 and reaches a value of 2.2. This means that the contact region of PDMS under a Vickers indenter is far from the shape of a perfect square. Using a Berkovich indenter, Deuschle et al. also reported the similar bowed-in geometries of the contact region of PDMS under load both by experimental in situ observations as well as by finite element calculations for tangential frictionless contact. Reference Deuschle, Deuschle, Enders and Arzt4 From these observations, it is considered that the bowed-in parameter may be used as an indicator of elasticity of glass under an indenter by determining the bowed-in parameter for various glasses, which requires the direct observation of real contact area under an indenter. However, such a bowed-in shape under load has not been observed nor described up to now for glass.
One important behavior of glass associated with Vickers indentation is the appearance of cracks at or near the contact point during loading or unloading. With a hope that such cracking events accompanying the indentation deformation lead to get a deeper insight into compositional variations of strength or brittleness of glass, many studies have been carried out. Reference Lawn and Marshall5–Reference Sehgal and Ito9 Although it has not been clarified yet how much elastic and inelastic deformations occur prior to fracture at or near the contact point, it has been found that glasses can be grouped into two types, depending on their fracture patterns caused by indentation: “normal glass” showing mainly median/radial cracks and “anomalous glass” showing Hertzian like cone cracks. Reference Arora, Marshall, Lawn and Swain7 The different deformation mechanisms were proposed: the plastic component of contact in normal glass is shear flow with conservation of material volume, while the plastic component in anomalous glass is permanent densification with resultant material volume shrinkage.
According to the expanding cavity model, the volume shrinkage under the indenter does not contribute to the expansion of the plastic zone under the indenter, and the driving force for radial cracking is reduced. Reference Chiang, Marshall and Evans10 Based on a similar approach, Yoffe also pointed out that the densification reduces the circumferential residual stress at surface. Reference Yoffe11 Since the volume ratio of densification to total lost volume by indentation changes with glass composition, Reference Yoshida, Sangleboeuf and Rouxel12 crack resistance during Vickers indentation improves with the increasing contribution of densification in some silicate glasses under the indenter. Reference Kato, Yamazaki, Yoshida and Matsuoka13,Reference Sellappan, Rouxel, Celarie, Becker, Houizot and Conradt14 These results show that the mechanism of inelastic deformation has a close connection with the cracking behavior of glass. However, there are still many unsolved problems related to the dynamic behavior of indentation cracking, e.g., when, where, and how does a crack nucleate during the indentation of glass? To get a clearer picture of the indentation responses of glass, more detailed experimental work on the indentation of glass is now required.
To observe the indentation deformation and cracking during loading and unloading, an instrumented indenter accompanied by an optical microscope has been used by several investigators. Reference Marshall and Lawn15–Reference Miyajima and Sakai24 Lawn et al. first reported that the in situ observation apparatus enabled one to observe the crack pop-in kinetics. Reference Marshall and Lawn15,Reference Lawn, Dabbs and Fairbanks16 Following that, Cook and Pharr reported the cracking sequences and crack geometries of some glasses and transparent ceramics under a Vickers indenter, Reference Cook and Pharr17 and clarified that material-dependent cracking sequences during an indentation cycle can be predicted from the indentation stress fields, which depends on the modulus-to-hardness ratio and on the contribution of densification under the indenter. Such an in situ observation apparatus is useful not only for observation of the cracking kinetics and crack propagation behavior Reference Cook and Liniger18 but also for the compositional variation of indentation fracture in glasses and ceramics Reference Tandon and Cook19–Reference Morris and Cook22 and for the evaluation of real contact area during indentation. Reference Sakai, Hakiri and Miyajima23,Reference Miyajima and Sakai24
The contact area at a given load is important to evaluate hardness and indentation modulus of a material. For depth-sensing indentation, the contact area during indentation is generally estimated from the indentation depth using a calibration procedure. The most popular calibration technique is the one proposed by Oliver and Pharr. Reference Oliver and Pharr25 The technique is now widely used for nanoindentation and for other depth-sensing indentations. However, it has been reported that the calibration procedure does not work in some cases, for example, as a result of pile-up under load. Reference Oliver and Pharr26 Since the real contact area is indispensable for estimating the contact stress during indentation, it is critical to determine the in situ contact area under a sharp diamond indenter. Sakai et al. reported that their instrumented indentation microscope with a transparent indenter should be a powerful tool in the science and engineering of indentation contact mechanics. Reference Sakai, Hakiri and Miyajima23,Reference Miyajima and Sakai24 This is also true for glass science and engineering. An indentation microscope with higher resolution is desirable to follow the cracking behavior of glass.
The purpose of this study is three-fold: one is to construct an indentation microscope capable of following the deformation behavior of glass under a Vickers indenter in situ, the second to determine the real contact area under the indenter, and the third to observe the appearance of cracks during loading and unloading.
II. EXPERIMENTAL PROCEDURES
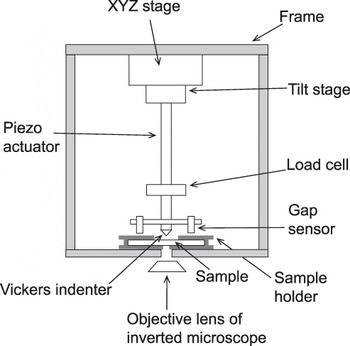
The direct observation setup was similar to those reported by Lawn et al. Reference Marshall and Lawn15,Reference Lawn, Dabbs and Fairbanks16 and Cook and Pharr. Reference Cook and Pharr17 The schematic drawing of the indentation microscope is shown in Fig. 1. A commercial inverted microscope (Olympus GX41, Toyko, Japan) was used to observe the indentation sequence from below. The self-made indenter composed of a diamond Vickers indenter, the load cell, the piezo-actuator, and the XYZ-stage, was put on the stage of the inverted microscope. The indenter was attached to the piezo-actuator (PSt 150/7/80 Mess-tek, Japan), which was driven at a constant rate controlled by the piezo-driver (M-26118S, Mess-tek, Japan).
Schematic illustration of the indentation microscope.

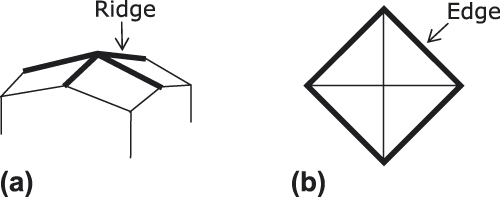
In this study, a Vickers indenter was used as the sharp diamond indenter, because it was reported Reference Lim and Chaudhri3 that ridges of Vickers indenter would affect the contact shape, which will be focused in this study and because Vickers indentation test has been widely used to model the contact damage of glass against foreign bodies. In this paper, the words “ridge” of Vickers indenter and “edge” of the indentation imprint are used as in the previous report. Reference Lim and Chaudhri3 The ridge of the indenter and the edge of the imprint are schematically shown in Fig. 2.
Schematic illustrations of (a) Vickers indenter and (b) Vickers indentation imprint.

The indentation load was monitored with the load cell (LUX-B-50N KYOWA, Japan). The XYZ-stage was used to align the XY-plane as well as to move the indenter close to the sample surface. The tilt stage was also used to adjust the position of the Vickers indenter. The glass sample with a thickness of about 1 mm was sandwiched between two stainless plates. The bottom plate has a 2-mm diameter hole through which the change occurring on the surface and inside is observed. The top plate has a larger 20-mm diameter hole so as to make indentation from the top. These plates were prepared to minimize the deflection of the glass plate during indentation. To obtain clearer images with higher resolution, it was indispensable to use an objective lens with an aberration correction ring (LCPLFLN50X-LCD, Olympus, Japan). This objective lens is the one designed and used for observing specimens through glass substrates, such as an observation of liquid crystals between glass plates. Using this correction ring, the aberration correction can be accomplished for 0–1.2 mm thickness of glass with a refractive index of about 1.5. The image was directly observed by a charged-coupled device (CCD) camera in the bright field. To get digital images or videos, the intense light (150 W halogen) was required instead of a normal light source (30 W halogen) attached with the inverted microscope. The imaging wave length was controlled with the interference filter with a center wave length of 550 nm. In some cases, the position of the tip of Vickers indenter from the sample surface was recorded by averaging the sensing values of two gap sensors (TRA616-200-V2, Mess-tek, Japan). The maximum indentation load was varied from 0.2 to 3.0 N, and the stroke rates during loading and unloading were constant at 0.1 μm/min. This stroke rate was controlled by the piezo-driver, and this stroke rate corresponds to the loading/unloading rate of about 1 N/min. The dwell time at a maximum load was constant at 1 s.
The samples used in this study were three kinds of commercial silicate glasses with various Poisson's ratios. Their compositions and some physical properties are shown in Table I. Silica glass was a dry one with low OH content (<5 ppm. MARUWA KE, Japan), because a sample with high OH content shows serious cracking during an indentation cycle even at a low (∼0.5 N) maximum indentation load. Such dry silica glass can be obtained through the electrically fused process of quartz. Soda–lime glass is a commercial microscope slide prepared by float process. Indentation tests of soda–lime glass were performed on tin side, which was confirmed by fluorescence under UV irradiation, but any differences in deformation behaviors between air side and tin side could not be recognized. The lead–silicate glass is a commercial product of Nippon Electric Glass Co., Ltd. The lead–silicate glass was machined and optically polished, and indentation tests were performed on the polished surface. All of the indentation tests were performed under flowing nitrogen gas (3–4 L/min) to minimize the occurrence of cracks during loading and unloading.
General compositions and physical properties of glasses used.

a Catalog values.
b Unpublished data (at 0.10 N).
III. RESULTS
A. Snapshots of the contact region during indentation
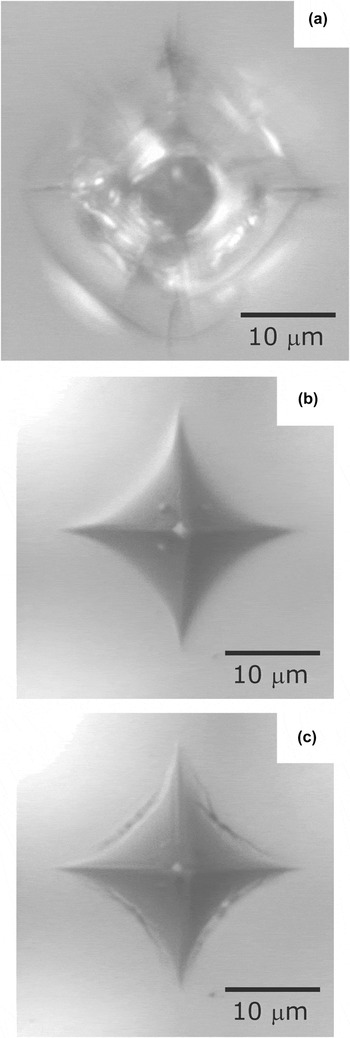
To avoid cracking during loading and to obtain the deformation image at a maximum load of 3 N for comparison among three glasses, it was necessary to etch the surface of silica glass by using a 0.056 wt% HF–0.014 wt% H2SO4 aqueous solution at room temperature for 22 hours. It has been reported that the indentation imprint of silica glass after unloading can be kept uncracked by flowing N2 on its surface, but edge cracks start to appear at or near indentation marks when the nitrogen flow is stopped. Reference Kurkjian, Kammlott and Chaudhri27–Reference Gross and Tomozawa29 The indentation imprint of the above-treated silica glass is kept unchanged by flowing N2, after complete unloading from the maximum load of 3.0 N. The results are shown in Fig. 3. Clearly, serious cracks can be observed in the nonetched silica glass in air [Fig. 3(a)], while a very smooth imprint was left after indentation in the etched silica glass under N2 flow [Fig. 3(b)]. When the nitrogen flow is stopped, however, edge cracks appear at the four curved sides of the indentation imprint [Fig. 3(c)]. Based on these results, all the indentation tests of silica glass were performed on the etched surface under N2 flow to avoid cracking during indentation.
Photos of Vickers indentation imprints of silica glass after complete unload. The maximum indentation load is 3.0 N. (a) Nonetched silica glass: The indentation was performed in air. (b) Etched silica glass: The indentation was performed under N2 flow. (c) Etched silica glass: The indentation was performed under N2 flow, and then the N2 flow was stopped before talking the photo.

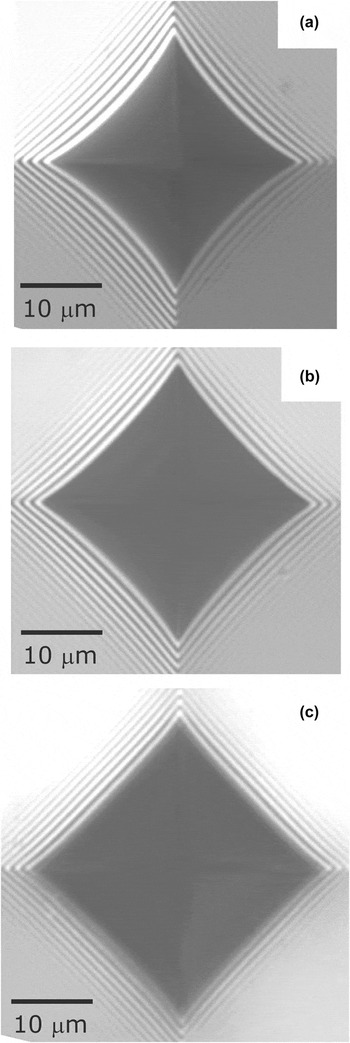
Figure 4 shows the photos of the indentation contact regions of three kinds of glasses under a maximum load of 3.0 N and under N2 flow. The very clear images were obtained under load. It is noteworthy that the contact regions for all three glasses are concave squares with bowed-in edges, but the degree of bowing is different depending on glass composition. Silica glass showed large bowing, while the lead–silicate glass showed small bowing. No remarkable cracking was observed on the in situ images of any of the glasses during loading, but various types of cracks appeared in soda–lime and lead–silicate glasses after unloading, as will be shown later.
Photos of the indentation contact regions of (a) silica, (b) soda–lime, and (c) lead–silicate glasses under a maximum load of 3.0 N and under N2 flow.

Another characteristic in the photos under load is the existence of fringe patterns around the contact region. This comes from the interference of light waves reflected from glass surface and the indenter. The interval between two black lines corresponds to the height difference of half a wave length between the glass surface and the indenter. This fringe pattern is quite similar to the Newton's rings of ball indentations. Reference Miyajima and Sakai24,Reference Chaudhri and Yoffe30,Reference Muller and Green31
B. In situ Meyer hardness
Since the Meyer hardness is defined as the value of the load divided by the contact area under an indenter, the actual contact area under an indenter in situ is needed to obtain its value. As described in introduction, however, the contact area is estimated from the diagonal length of residual mark after removal of the indenter because of difficulty in getting the actual contact area.
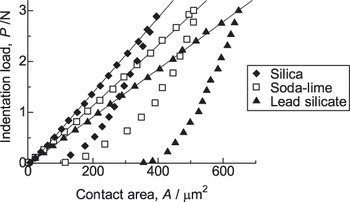
Figure 5 shows relations between the indentation load and the in situ contact area for three kinds of silicate glasses under N2 flow. Using the image processing program, ImageJ, the contact area was determined as the area of the dark region shown in Fig. 4. As pointed out by Chaudhri and Yoffe, Reference Chaudhri and Yoffe30 however, the obtained contact area is a little overestimated due to the resolution of the optical microscope. They claimed that the edge of the dark region corresponds to a gap between indenter and specimen surface of λ/4, where λ is the wave length of the light used. So, the correction factors for the diagonal length and for the opposite side were calculated for 3 N indentation on soda–lime glass and found to be 1.5 and 0.8%, respectively. Although these errors would result in the correction factor of 2–3% for the contact area, no corrections were made to get the contact area from the image, because it is within the experimental error.
Relations between the indentation load and the in situ contact area for three kinds of silicate glasses under N2 flow (Closed diamond: Silica glass, Open square: Soda–lime glass, Closed triangle: Lead–silicate glass). The solid lines are least square fits of the loading curves to linear functions.

In Fig. 5, an excellent linear relation can be seen in the loading curve, as the previous researchers reported for some glasses and ceramics using their indentation microscope. Reference Sakai, Hakiri and Miyajima23 From the slope of the loading curves for six indentations for each glass, the in situ Meyer hardness, which is the load divided by the in situ projected contact area, was calculated. The result agrees well with the reported value of Vickers hardness as shown in Table I. As for the unloading half cycle, on the other hand, the relation between load and in situ projected contact area is not linear due to the complicated elasto-plastic process in glass, as reported before. Reference Sakai32
C. Load and compositional dependences of contact shape under load
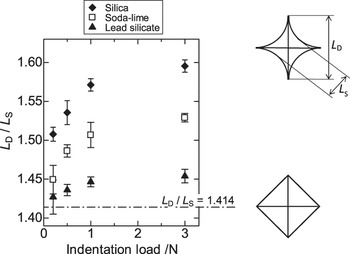
As shown in Fig. 4, the contact region is not a regular square but a concave square with the bowed-in edges. The bowed-in parameter is defined as the ratio of the diagonal length, L D, to the opposite side length, L S, as shown in the inserted figures in Fig. 6 Reference Lim and Chaudhri3 The relation between the bowed-in parameter and indentation load for three kinds of silicate glasses is shown in Fig. 6. The contact lengths are also not corrected as stated above. If the contact region is a regular square, the bowed-in parameter, or the ratio of L D to L S, is 1.414, so that the bowed-in parameter is considered as a measure of the degree of concaved shape. Regardless of the indentation load, the bowed-in parameter was larger than 1.414 for all the glasses and increased in the order of lead–silicate, soda-lime, and silica glasses. The bowed-in parameter decreased with decreasing the indentation load for every glass.
Relation between the bowed-in parameter, L D/L S, and indentation load for three kinds of silicate glasses under each load. The same symbols are used in Fig. 5. Error bars denote ±1 standard deviations. The inserted figures represent schematic illustrations of the contact regions (Concave and regular squares).

IV. DISCUSSION
A. Load and compositional dependences of contact shape under load
Although the bowed-in geometries of the indentation imprint on glass have been observed after unload, the occurrence of bowing at the edge of indentation mark during loading, such as the one shown in Fig. 4, has not been described up to now. Figures 4 and 6 show clearly the compositional dependence of the bowed-in parameter as well as load dependence.
As described in the introduction, a similar bowing-in has been observed in an elastomer showing no plastic deformation. Lim and Chaudhri Reference Lim and Chaudhri3 attributed this bowing-in to the pin cushioning of an elastic body, where the depth of contact is greater at the ridges of the indenter than the depth of the points between ridges. If plastic flow or shear flow were dominant under the sharp indenter, the displaced volume would tend to go up to the faces of the indenter and sometimes to form “pile-up”. After unload, in such cases, one can see the barrel-type impression with bowed-out edges. Reference Giannakopoulos and Suresh33 In case of glass, however, both elastic and inelastic deformations take place at the same time under an indenter during loading. The previous studies on normal and anomalous glasses showed that the shear driven plastic flow tends to takes place in normal glass such as soda–lime or lead–silicate glasses, while the compressive driven deformation occurs in anomalous glass such as silica glass. Reference Peter2,Reference Arora, Marshall, Lawn and Swain7
As stated above, the bowed-in parameter is a kind of indicator for elasticity of glass under an indenter. Figure 6 shows that all the glasses have the bowed-in parameter of more than 1.414, which indicates the smaller contribution of shear flow in glass under an indenter. After unload, however, one can observe the pile-up at the edges of the Vickers imprint on softer glass, like lead glass. Reference Kato, Yamazaki, Itakura, Yoshida and Matsuoka34 This suggests that the pile-up of lead glass can be formed during the unloading half cycle, not during loading. Figure 6 also shows that the bowed-in parameter increases in the order of lead–silicate, soda–lime, and silica glasses. This order is opposite to the order of Poisson's ratio of these glasses. Qualitatively, glass with high-Poisson's ratio has higher shear component than that with low-Poisson's ratio, and shear flow is easier. Reference Yoshida, Sangleboeuf and Rouxel12,Reference Rouxel, Ji, Hammouda and Moréac35 It is interesting that the elastic parameter, Poisson's ratio, is related with the inelastic behavior, permanent densification of glass. This is because the Poisson's ratio of glass depends on the atomic packing density of the glass. Reference Rouxel, Ji, Hammouda and Moréac35 The higher contribution of shear flow in glass with high-Poisson's ratio results in less bowing-in under an indenter. The bowed-in parameter obtained is also related to the elasticity index, H/E, Reference Lawn and Howes36 which is 0.1 for silica glass and 0.07 for lead–silicate glass. There is no question about the concept that the degree of bowing-in is associated with the ratio of elastic and inelastic deformations appearing in glass, but more experiments on various types of glasses with different Poisson's ratios or elasticity indexes are needed to make it more quantitative.
In Fig. 6, the bowed-in parameter, L D/L S, for every glass decreases with decreasing indentation load. This load dependence was also reported for the in situ observation of indentations on PDMS. Reference Lim and Chaudhri3 As the authors pointed out, the load dependence of the contact shape suggests that Vickers indentation is not geometrically similar due to ridge effects. The bowed-in shape results from the pin-cushioning effect by the ridges of Vickers indenter. The finite radius of curvature of the ridges of indenter (50–100 nm which was measured by atomic force microscope) probably affects the stress concentration degree and reduces the ridge effects at lower indentation loads. This load dependence of the contact shape would be also related to the load dependence of inelastic deformation mechanism of glass, Reference Kato, Yamazaki, Itakura, Yoshida and Matsuoka34,Reference Yoshida, Sangleboeuf and Rouxel37 where one of the present authors reported that the contribution of densification of glass under a Vickers indenter increases with decreasing the indentation load. Such load dependence of deformation mechanism or elasticity in glass surely affects the indentation size effect (ISE), which means that hardness increases with decreasing the load. To get a clearer picture on ISE of glass, however, further experimental and computational work on the deformation on glass under the indenter will be required.
B. Effect of contact shape on cracking
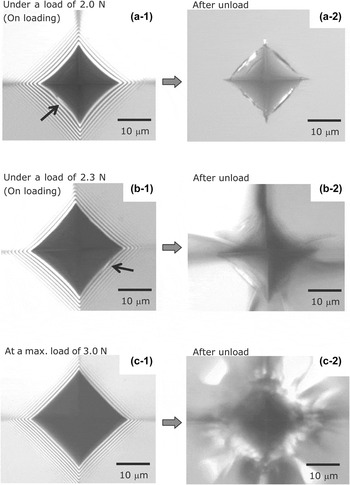
The sink-in at the center between the corners causes a tensile stress in the radial direction at the indentation edge. Depending on surface conditions, or flaw distributions, this tensile stress sometimes causes an edge crack along the edge of the indentation imprint as shown in Fig. 7. The arrows in Figs. 7(a-1) and 7(b-1) indicate the positions of edge cracks, which are initial cracks for silica and soda–lime glasses during loading of the Vickers indentations. In Fig. 7, the maximum indentation load for each glass is 3.0 N. Figure 7 also includes photos of the residual imprints after complete unloading. The photos of silica glass [Figs. 7(a-1) and 7(a-2)] were obtained under the N2 flow, because of severe cracking in air as shown in Fig. 3(a), but no etching was performed before the indentation test. To focus on a relation between the contact shape and the crack type, the condition of N2 flow was selected only for silica glass. Effects of environment and of surface conditions on indentation cracking will be focused on elsewhere.
Photos of the contact regions under load and the imprints after unload. The maximum indentation load is 3.0 N. The indentations were performed in air for soda–lime and lead–silicate glasses, and under N2 flow for etched silica glass, which was not etched prior to indentation. (a-1) Silica glass under a load of 2.0 N, (a-2) silica glass after unload, (b-1) soda–lime glass under a load of 2.3 N, (b-2) soda–lime glass after unload, (c-1) lead–silicate glass under a load of 3.0 N (the maximum load), (c-2) lead–silicate glass after unload. The arrows in (a-1) and (b-1) indicate the positions of initial edge cracks observed during loading.

During loading, edge cracks can be observed at around 2 N both for silica and for soda–lime glasses. This is due to the larger sink-in of these glasses as stated above. On the other hand, the initial crack of lead–silicate glass was not the edge crack. This is because the sink-in of lead glass is not so pronounced compared with silica and soda–lime glasses. It is noteworthy that edge cracking of soda–lime glass can be also observed during unloading. In Figs. 7(b-2), many edge cracks can be observed on the surface of the residual imprint. This is probably because some damage or faults created due to tensile stress at the edge can open into the edge cracks with an assist of the in-plane recovery of the imprint during unloading. This cracking mechanism is similar to that of the edge cracking on silica after stopping N2 flow as shown in Fig. 3(c).
It is considered that the edge cracks may be the triggers of radial cracking during unload Reference Lawn, Dabbs and Fairbanks16,Reference Abe38–Reference Wilantewicz43 if the residual stress is large enough. To reduce the risk of radial cracking of glass, the sink-in behavior, which would be the origin of edge cracking during loading, should be minimized during the contact events.
V. CONCLUSION
In this study, in situ observations of indentation deformation and cracking in silicate glasses were successfully performed using a self-made indentation microscope. The direct observation is quite important not only to determine the precise hardness of glass but also to evaluate the compositional variation of deformation and cracking in glass under an indenter. Using the indentation microscope, in situ Meyer hardness of silicate glasses can be determined without any assumptions, like an assumption of the contact depth. From the direct observations of the contact regions, it is found that the contact shape under a Vickers indenter is not a regular square but a concave square with the bowed-in edges, and that there is a remarkable compositional variation of the contact shape. The bowed-in parameter, which is the ratio of the diagonal length to the opposite side length, is suggested to be an inverse measure of shear flow in glass under a Vickers indenter. Silica glass, which prefers densification under a Vickers indenter, shows a larger bowed-in parameter, whereas lead–silicate glass has a lower bowed-in parameter due to its tendency of shear flow under the indenter. All the glasses under load have the bowed-in parameter of more than 1.414. This means that the pile-up of lead glass after unload can be formed during unloading, not during loading. As for cracking behavior, edge cracks can be observed during loading both for silica and for soda–lime glasses. This is due to the larger sink-in, or the larger tensile stress at the contact edge, of these glasses under load. On the other hand, the initial crack of lead–silicate glass was not the edge crack. This is because the sink-in of lead glass is not so remarkable as compared with silica and soda–lime glasses. It is concluded that the contact shape during indentation is closely related to edge cracking in glass.
ACKNOWLEDGMENTS
The authors are very grateful to Dr. M.M. Chaudhri for his informative discussions. The authors also acknowledge financial support by Nippon Electric Glass Co., Ltd., Japan for this work. One of the authors (S.Y.) would like to thank to the JSPS KAKENHI Grant Nos. 25420713 and 15H04124.