


1. Introduction
In this study, we discuss the effect of the new financial assessment framework (in Dutch Financiele toetsingkader, FTK) on mortgage investments by pension funds. This specific topic is relevant in the broader context of funds' asset allocation.
Academic contributions have discussed the effect of regulations on the asset allocation of pension funds (e.g., An et al., Reference An, Huang and Zhang2013). Boon et al. (Reference Boon, Brière and Rigot2018) show that risk-based capital requirements and mark-to-market valuation are more associated with the reduction in the share of risky asset than the characteristics of fund itself (size, share of retired members, inflation indexation, etc.). They show that the funding requirement reduced risky asset exposure especially during the financial crisis. Rules on discount rates also impact the asset allocation of pension funds. Those with higher discount rates have riskier portfolios (Novy-Marx and Rauh, Reference Novy-Marx and Rauh2009; Pennacchi and Rastad, Reference Pennacchi and Rastad2011; Mohan and Zhang, Reference Mohan and Zhang2014). Andonov et al. (Reference Andonov, Bauer and Cremers2017) show the relevance of regulation on liability discount rates comparing US public funds with either US private funds or funds in Canada, the Netherlands, and UK.
Research on the determinants of the allocation of pension funds' investments to private equity, hedge funds, and real estate is also gaining momentum. Defau and De Moor (Reference Defau and De Moor2021) show that these alternative investments are more likely to be driven by low interest rates and portfolio diversification. Andonov et al. (Reference Andonov, Eichholtz and Kok2015) find that the size of the funds and investment management (internal vs. external) matters for the real estate investments. Gerber and Weber (Reference Gerber and Weber2007) also focus on real estate but they show that maturity (age structure) or the share of short-term benefit payouts affects their real estate portfolio. Private equity investments are also more associated with the size of funds (Chemla, Reference Chemla2005; López-Villavicencio and Rigot, Reference López-Villavicencio and Rigot2013; Dyck and Pomorski, Reference Dyck and Pomorski2016). Bouvatier and Rigot (Reference Bouvatier and Rigot2013) show that portfolio diversification and size are important determinants of investments in hedge funds. Recent studies on illiquid assets are also worth mentioning. Broeders et al. (Reference Broeders, Jansen and Werker2021) show that liquidity and capital requirements are important when deciding the share of illiquid assets. Jansen and Tuijp (Reference Jansen and Tuijp2021) show that investment costs, supervisory requirements, and portfolio management are significant factors too.
Also the intersection between regulation and these alternative investments has been researched. For instance, lifting the quantitative limit on investment in real estate increased investment in other assets in Canada including real estate and hedge funds (Willis Towers Watson, 2019) and reduced liquid investments (Bédard-Pagé et al., Reference Bédard-Pagé, Demers, Tuer and Tremblay2016).
These topics are relevant because they relate to the developments in financing residential housing and mortgages. We discuss the case of the Netherlands extensively below, but also UK and Canadian pension funds have invested more in mortgages (Wong, Reference Wong2018) in recent years. The same happened also in Sweden (Fixsen, Reference Fixsen2019) and in Denmark where pension funds started filling the gap left by banks after the house price crisis (Gujun, Reference Gujun2021).
Given this context, we show that, in the Netherlands, the FTK played a significant role in the increase of mortgage underwriting by pension funds, along with other factors such as falling interest rates and increased macroprudential regulations resulting in safer mortgages. The FTK framework can be seen as a macroprudential tool, as it establishes some key parameters in the relationship between an important segment of the financial sector and the supervising authority, the Dutch National Bank (DNB) in this case.
The residential mortgage market has traditionally been the playing field of banks. However, since the end of 2015, only 48% of newly issued mortgages were funded by the three largest banks in the Netherlands. A large market share was therefore left untapped by banks that may have been influenced by the higher capital requirements imposed by the latest Basel agreements. Their market share has been taken on by other institutional investors, including pension funds which, not having their own purchase channel, have mostly used specific vehicles. Almost a quarter of new mortgages were provided by these new non-bank lending platforms that used brokers or websites to sell home loans on behalf of institutional investors (Hale, Reference Hale2016a). The other institutional investors are mostly insurance companies or mortgage funds. This interesting new phenomenon motivates this study, in which we also investigate the characteristics of the loans supplied by pension funds and compare them to those funded by banks. Our empirical evidence is based on a new and unique dataset, the Mercurius data of De Nederlandsche Bank (DNB, the central bank of the Netherlands), which is an appendix to the Loan-Level Data initiative of DNB. This initiative covers almost the entire universe of mortgage owners in the Netherlands (nearly 80% of them) and includes granular information on loans and borrowers. This micro-dataset contains loan-by-loan and borrower information on mortgage debts written by insurance companies and pension funds. We combine the micro data with the balance-sheet information of the pension funds. In this way, it is possible to simultaneously observe the characteristics of the borrower to whom the debt is issued and those of the fund.
We test the hypothesis that the recent increases in mortgage investments by pension funds are due to the combined effect of their past recovery modes and the introduction of the new FTK. The new FTK was published in the Netherlands in June 2014 and became effective in January 2015 in order to make the Dutch occupational pension system more sustainable, stable, generationally fair, and more resilient in times of financial crises. It is in essence not very different from the previous supervisory framework, although it made it possible to increase the risk profile (required funding ratio) once, when the new FTK was introduced. This is why it still requires pension funds to maintain a high performance, but with renewed attention to investment risks in order to avoid sudden drops in benefits or increases in premiums. Funds must also manage risk by conforming to risk assessment requirements, most notably the required funding ratio of funds in recovery mode would be lifted if these were to invest in risky assets. As Dutch mortgages are a relatively safe product with low defaults, these are now more appealing for pension funds that need to rebalance their investment decisions in terms of the risk/return options as required by the FTK. For this reason, we will also consider the asset allocation of the funds before the financial crisis. Dutch mortgages, which were already subject to a full recourse system, have become even safer assets since the full amortization rules and a cap on LTV were introduced in 2013. Within Solvency 2, the financial assessment framework for insurance companies, Dutch mortgages are classified as low-risk products. Moreover, mortgages are long-duration assets that hedge well against the interest rate risk of pension funds (due to their long-term liabilities); they should be especially attractive investments to the funds that suffered most during the 2008–2012 recession and could be penalized more heavily within the new FTK.
We test the effectiveness of the call in the FTK for safer investments (by low-performing pension funds) by looking into mortgage-underwritings after the crisis. We look at the difference in mortgage investments by pension funds that had a poor performance after the crisis in recent years. The link with the new FTK is based on two ideas. The first is that this framework became operative in 2015. The second is that the basic principle of the new framework is that only financially solid funds have autonomy in making their management decisions (e.g., indexing benefits, making risky investments, or lowering premiums). Their financial solidity is linked not only to the level of their funding ratios, but also to their approach to risk in investments, which is also stress-tested. In this regard, lower performing funds might want to make their investments safer and further hedge their interest rate risks by issuing more mortgages. To frame this properly, think of the following example. Stocks give a higher expected return, but funds in recovery would face more stringent funding ratio requirements when buying additional shares. With mortgages this is not really the case, and mostly applies to safer mortgages, so funds in a deficit situation might shift their portfolio to safer mortgages. Funds that are in better shape and not in deficit can also purchase mortgages (even with more credit risk), thus a meaningful contribution of this study is the fact that we account for these risks.
One of the plausible reasons for the poor performance of pension funds during the 2008–2012 crisis is related to lower immunization of the fund before the crisis. Other reasons could be specific policies of the funds (such as granting premium holidays in periods of high stock returns) or a less-diversified portfolio. Immunization is an investment strategy that is designed to minimize interest rate shocks by matching the duration of the assets to that of liabilities. It can be desirable for long-term investors such as pension funds and insurance companies. The more a fund immunizes its liability, the better it is for the funding ratio when there is a negative shock to the interest rate. However, there are several reasons for this partial immunization. First the size of the Dutch pension sector is huge, €1,000 billion as of 2012, so the government bond market cannot absorb such hedging demands (Barnes, Reference Barnes2012). For this reason, large pension funds often rely heavily on derivatives such as swapsFootnote 1 and swap options to better match the interest rate risks, although the market for these products is small relative to their investment capacity. Small pension funds on the other hand have less access to those derivatives. Second, risk diversification, yields, and liquidity risk (Inglis et al., Reference Inglis, Bosse and Zahm2013) are also linked to partial immunization.Footnote 2
The results of partial hedging became evident with the financial crisis, when 75% of Dutch pension funds experienced substantial reductions in their funding ratios (DNB, 2014). As Beetsma et al. (Reference Beetsma, Constandse, Cordewener, Romp and Vos2015) show, in the early stages of the financial crisis the funding ratios dropped mostly due to decreases in asset (equity) values, while in the later stages the ratios tumbled significantly, as ‘flight to safety’ was pervasive and interest rates plunged. This is why the second stage is where we can test how much pension funds were ready to immunize their financial position against interest rate risks.
In fact, after the crisis, almost three-quarters of all pension funds had record-low funding ratios – below the required minimum of 105%Footnote 3 – and have since been in recovery mode (DNB, 2014). In addition, the prolonged low interest rate period and the new discount rates set in the third quarter of 2015 have undermined the financial position of pension funds. Pension funds in 2014 might have been pushed to invest more in safer products; this would be particularly true for those funds that were in recovery mode and had to take several financial actionsFootnote 4 or those that performed poorly during stress-test exercises.
In this study, we show that pension funds with recovery plans had 25% points lower funding ratios relative to funds without such plans at the peak of the financial crisis and that this difference has reduced slowly in the years that followed and further narrowed only after the new FTK was introduced. We also show that the increase in mortgage investments also took place for insurers, but in their case, this was not as sudden as for pension funds. The risk profile of mortgage investments of pension funds is also different from those of banks, the main players on this market. This partly depends on the fact that funds entered the market in a period when house prices were increasing again, interest rates were historically low and once some additional macroprudential policies were implemented, but it is also due to investment choices.
We use these results to elicit the effect of the supervisory framework on mortgage investments. Our results suggest a combined effect of the original supervisory framework, which is exemplified by the imposition of recovery mode, and the new FTK introduced in 2015 on the mortgage investments of lower performing funds. We find that this led to a 39% increase in their mortgage investments, despite the fact that these are still low relative to the overall investments of pension funds. Also, the results show that pension funds tend to invest in relatively safer debt (at lower LTV and amortizing) than traditional mortgage suppliers (banks). Also we provide descriptive evidence that shows the importance of this timing. As pension funds stepped in 2015, later relative to mortgage funds and insurers, their portfolio is characterized by lower risk. After 2013 not only LTV caps were sharpened and interest-only mortgage were penalized, but the lower interest rate induced many borrowers to lock in the lower rates by fixing the interest rate for most of the contract duration. Moreover, the funds which performed badly during the financial crisis not only preferred to supply more mortgages but also to have safer debts compared with those that needed no recovery process.
The rest of this study is organized as follows. Section 2 presents a literature review and Section 3 explains some institutional details. Section 4 presents the dataset and methodology along with descriptive statistics. Section 5 reports on empirical results and robustness checks. Finally, Section 6 discusses policy implications and provides conclusions.
2. Literature review
Our proxy for low-performing funds is based on observing the performance of pension funds during the 2008–2012 recession. The low performance of pension funds was largely due to the fact that, because of the asset-price crisis, pension funds booked large losses on their investment portfolios (first stage, third quarter of 2008) and sudden increases in the value of their liabilities (second stage, fourth quarter of 2008). Only more immunized funds were able to protect their funding ratios in the second stage.
Leibowitz (Reference Leibowitz1986) describes immunization as a strategy of portfolio construction for an investor to immunize a schedule of liabilities against a certain range of interest rate movements. Previously Grove (Reference Grove1974) presented his immunization rule and stated that decision makers always choose equal values of the weighted durations of asset and liability streams, i.e., they always act to hedge their net worth against interest rate movements. Besides duration matching, immunization can also be achieved by cash-flow matching. According to Inglis et al. (Reference Inglis, Bosse and Zahm2013), the aim is to match the cash inflows of the portfolios to the cash outflows of liabilities. This strategy is especially attractive to insurers and pension funds since their long-term liabilities are susceptible to interest rate changes. In our study, we investigate one such case.
Several choices in the years preceding the crisis (indexation to prices or even stopping collecting premiums at times) had also caused the financial position of several funds to deteriorate. According to Bauer et al. (Reference Bauer, Hoevenaars, Steenkamp, Clark, Munnell and Orszag2006), the financial position of pension funds depends on exogenous economic variables (interest rates and inflation) and policy variables (contribution, indexation, and investment policy). In relation to the asset liability management of pension funds, Bauer et al. (Reference Bauer, Hoevenaars, Steenkamp, Clark, Munnell and Orszag2006) also distinguished various factors that affect changes in liabilities from those that affect changes in assets. On the one hand, the values of their liabilities fluctuate due to interest rates, inflation, policy (retirement age), or demographic factors (life expectancy). On the other hand, the changes in their assets are caused by pension payments, contributions, and investment returns. Among those factors, interest rates affect both sides of the balance sheet through the discount rate (Mulvey et al., Reference Mulvey, Gould and Morgan2000; Bauer et al., Reference Bauer, Hoevenaars, Steenkamp, Clark, Munnell and Orszag2006). This is why an immunization strategy can be used to hedge the interest rate risk of pension funds in addition to the strategy of being armed with derivatives (e.g., interest rate swaps). The simplest liability-driven investment (LDI) is the one that exploits an immunization strategy through duration matching to eliminate the effect of interest rate changes (Inglis et al., Reference Inglis, Bosse and Zahm2013).
The liabilities of pension funds are very vulnerable to interest rate movements; as the pension benefit itself has an extremely long payment schedule, downward (or upward) changes in discount rates significantly and upwardly (or downwardly) affect the present value of their liabilities. As stated in Keintz and Stickney (Reference Keintz and Stickney1980, p. 224), downward interest rate changes have an impact on the market value of existing fund assets – also in the opposite (upward) direction. By properly coordinating the relationships between assets and liabilities, pension funds can be immunized from market (interest rate) movements (Keintz and Stickney, Reference Keintz and Stickney1980).
Policy variables are also important to the financial position of the pension funds. Indexation policy is one of the main variables that determine the financial position of pension funds, along with contribution strategy. In order to guarantee the real value of pension rights, pension funds exploit indexation policy for pension benefits to ‘catch’ the inflation rate, either following wage or price growth rates. According to Bauer et al. (Reference Bauer, Hoevenaars, Steenkamp, Clark, Munnell and Orszag2006), pension funds can guarantee the real or nominal rights of the pensions by implementing a full or no indexation scheme. The indexation degree can be conditional on the financial status of the pension funds or a decision by the Board. In an aging society or in a mature pension system with more pensioners than active participants, an adjustment in indexation can be more powerful than changes in contributions. Contributions are another policy variable that affects fund performance. These are payments by current workers, but this instrument is less effective when the population is aging, and the number of active participants is shrinking.
3. Institutional details
3.1 Pension sector
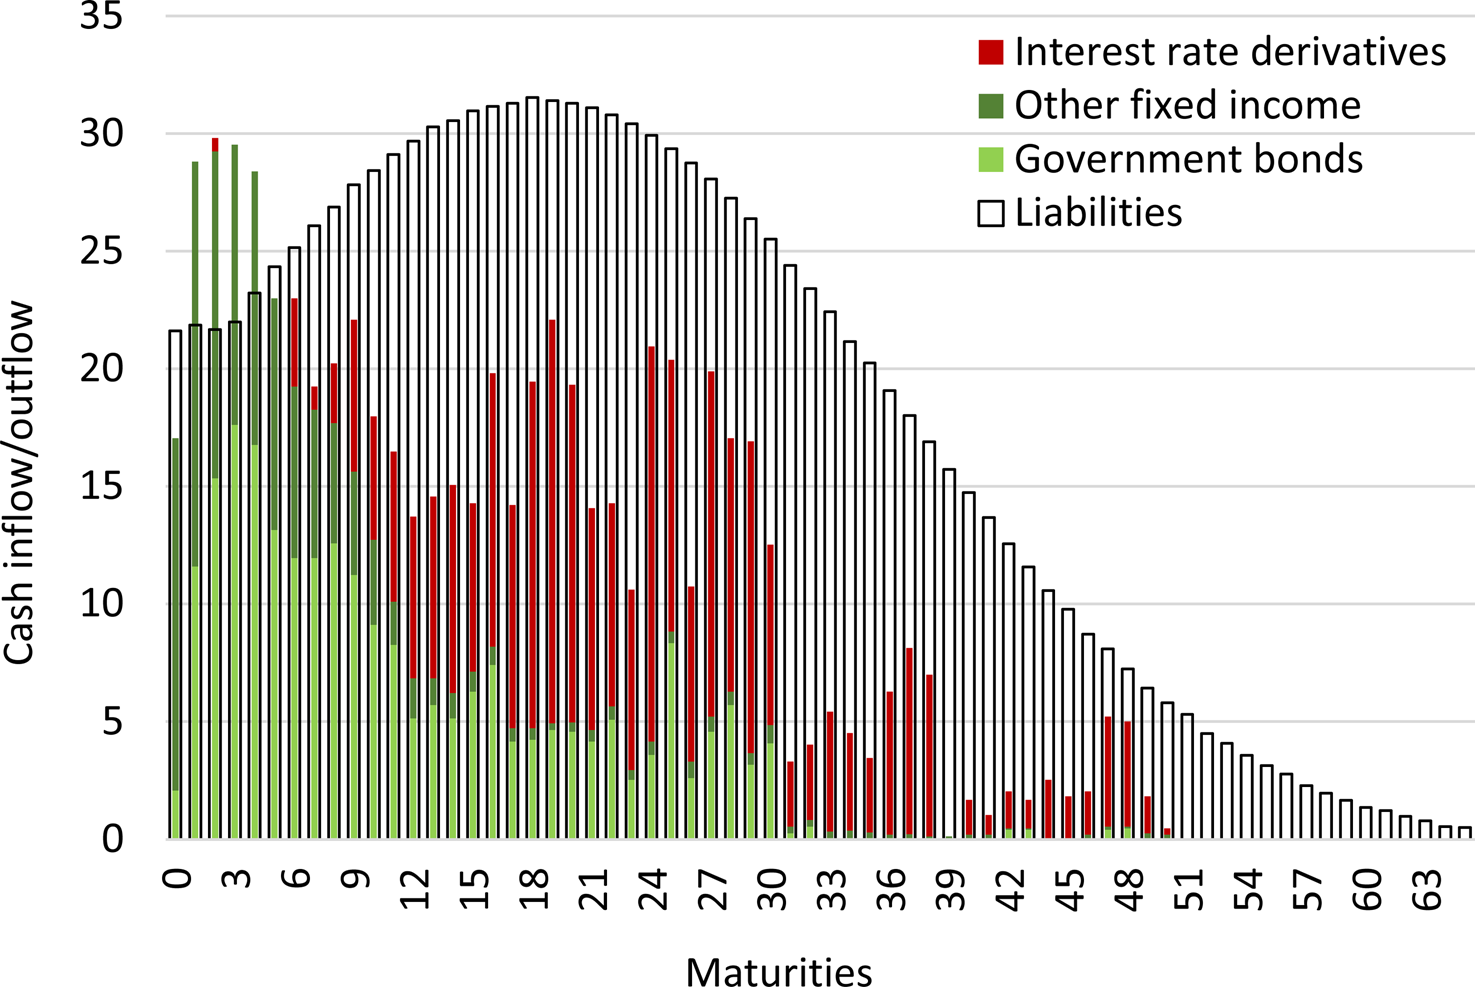
As of 2012, pension funds in the Netherlands hedged approximately half of their interest rate risks on average (DNB, 2013), while 93%Footnote 5 of them conditionally indexed their benefits to prices. As the reductions in funding ratio were largely due to lower interest rates, we focus here on interest rate risk and hedging against it. Short-term (less than five years of maturities) liabilities were fully hedged with fixed-income or interest-rate derivatives, while the longer-term liabilities were only hedged by 50%. As noted in DNB (2011), the degree of hedging reduces as the maturities of future liabilities increase from five to 30 years and, with regard to those beyond 30 years, pension funds scarcely hedge against them. Their degree and the structure of interest rate hedging are clearly shown in Figure 1 (DNB, 2013) below.
Average cash outflows and inflows of Dutch pension funds predicted in 2012.
Explanatory Note: Cash outflows of pension benefits (liabilities) and expected cash inflows (redemptions and coupon payments) of investments in fixed-income securities (interest-rate derivatives, sovereign bonds, and other fixed-income securities) in € billion per year for the next 80 years, at year-end 2012.
Source: DNB 2013.
Pension funds whose funding ratios dropped below 105% in 2008 had to set up a recovery plan, choosing from among the following options: increasing premiums, reducing or stopping indexation, or cutting benefits. In Figure 2a, we divide all pension funds into two types: those with recovery plans, and those without recovery plans. The average funding ratios of both types of pension funds had similar patterns, and sometimes similar levels, before 2008. However, in 2008, the average funding ratio of the funds with recovery plans tumbled and almost hit 0.8, while that of better performing funds (the one without recovery plans) fell less (to 1.2).
(a) Average funding ratios of two types of pension funds. (b) The difference in funding ratios between two types of pension funds. (c) Growth rate of the funding ratios of two types of pension funds.
Explanatory note: Source: pension funds' balance-sheet data from DNB, own computations.
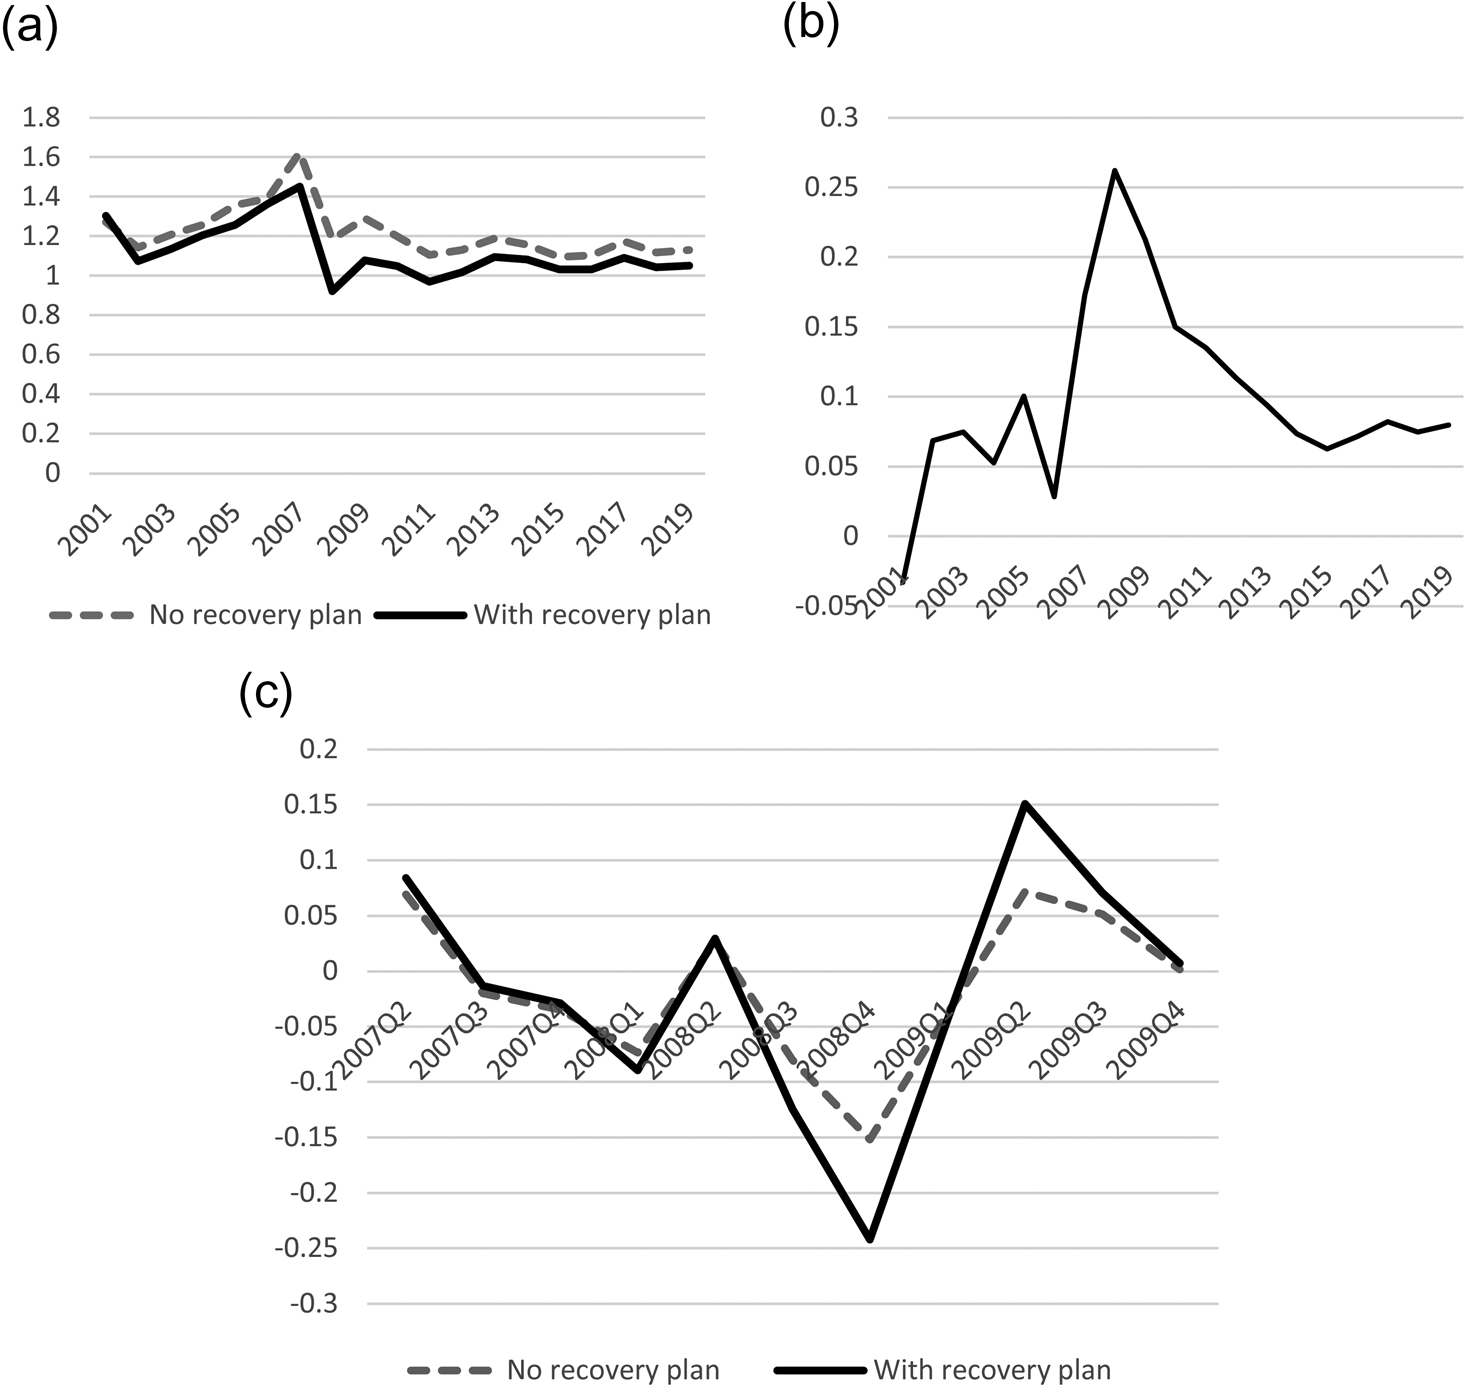
The differences in average funding ratios between two groups are depicted in Figure 2b and this gap was especially large in 2008. Zooming into the quarterly funding ratio and its growth rates in Figure 2c, we see better what happened during 2008. Beetsma et al. (Reference Beetsma, Constandse, Cordewener, Romp and Vos2015) note that risky asset collapse happened first in the third quarter of 2008 – soon after the Lehman Brothers bankruptcy – and the plunge in interest rates followed because of ‘flight to safety’ in the last quarter of 2008. Figure 2c apparently shows that the latter effect was stronger for the funds with a recovery plan, explaining why this group had to take several actions to improve their financial status.
Referring to Figures 2a and 2b, after 2009–2010 – also as a result of recovery plans – the gap between two types of funds gradually narrowed. This happened after the new FTK was introduced, when the average funding ratios of low immunized funds climbed back up to the threshold level (1.05). A previous FTK had already been in place since 2007, but consultations about its reform started in 2010 with the aim of fixing some of the inadequacies exposed by the financial crisis. Two committees, which were established to investigate the sustainability of pension funds, concluded that a new assessment framework was needed (Spaan, Reference Spaan2012) in order to mitigate the risk of sudden changes in pension premiums or benefits. In June 2014, the new FTK was published, and it became effective from January 2015 (DNB, 2014). The goals of the new FTK were to make the occupational pension system less vulnerable to exogenous shocks, more balanced among generations, and more stable in terms of cuts/lifts in benefits (and premiums), thus ensuring a more sustainable system.
Several main changes applied from 2015 that are relevant to this study. The new rules had less strict requirements for recovery plans, as pension funds could change their funding ratio requirement once after the introduction of the new FTK. Also the recovery plan period was reorganized; it went from 15 years from the start of the deficit to 10 years from the start of the recovery plan. Indexation was only allowed from a funding ratio of 110% (Shu et al., Reference Shu, Melenberg and Schumacher2016), with each percentage above 110 being allowed to lead to an indexation of 0.1%. A policy funding ratio was introduced (the moving average of the funding ratio over the past 12 months). The new UFR methodology was also implemented, which eventually implied that the discount rate fell to 1.9% for 30 years and 2.5% for 60 years, away from the flexible UFR asymptote of 3.3%.
Furthermore, the required buffers went up. A fund with an indexation ambition would need a funding ratio of 128%. The test for Minimum Required Equity (under Article 132 of the Pensions Act) was maintained. This Required Equity increased by an average of approximately 5%, implying higher future premiums and buffers. Finally, a feasibility test was introduced, whereby a fund must periodically demonstrate that it has feasible ambitions in the long run (Hoekert and Troost, Reference Hoekert and Troost2015; Hoekert et al., Reference Hoekert, Kool, Jonk and Elias2018).
A public stress test performed in 2015 by the European Insurance and Occupational Pensions Authority (EIOPA) challenged these criteria. It showed that Dutch pension funds are especially vulnerable to interest rate changes and shocks in variable-yield securities (e.g., stocks) (see DNB, 2016a). This last element made mortgages a safer and attractive investment vehicle for pension funds. Relative to alternative safe investments, such as government bonds (in the period that we discuss here, the return on Dutch and German government bonds was actually negative), mortgages had higher returns.
Pension funds were also required to use a new discount rate for their liabilities, which was lower than the previous one, and this reduced their funding ratio. The decision to implement this new Ultimate Forward Rate (UFR) was published in July 2015 by DNB. The UFR was used to follow the market term structure (swap rates) for maturities below 20 years and gradually moved from 20 toward 60 years, to the pre-determined convergence level of 4.2%, a sum of 2% (long-term inflation expectation) and 2.2% (long-term expectation of the short-term real interest rates). However, within the new UFR, the convergence level has changed, and it is now calculated every month as a 120-month historical average of the 20-year forward rate (DNB, 2012; Van Stee, Reference Van Stee2019). Afterwards, the new discount rates between 20 and 60 years are therefore estimated as lower than previously.
3.2 Mortgage market
Dutch mortgages are issued under a full recourse system, which means that legal devices are in place which are designed to protect mortgage lenders in case of default, and this has led to relatively low default rates. In the case of inevitable repossession, Dutch mortgage lenders can sell the collateral without legal eviction (see DNB, 2016c). They also have full recourse to borrowers, including other assets and even their future income (Leeuwen and Bokeloh, Reference Leeuwen and Bokeloh2012).
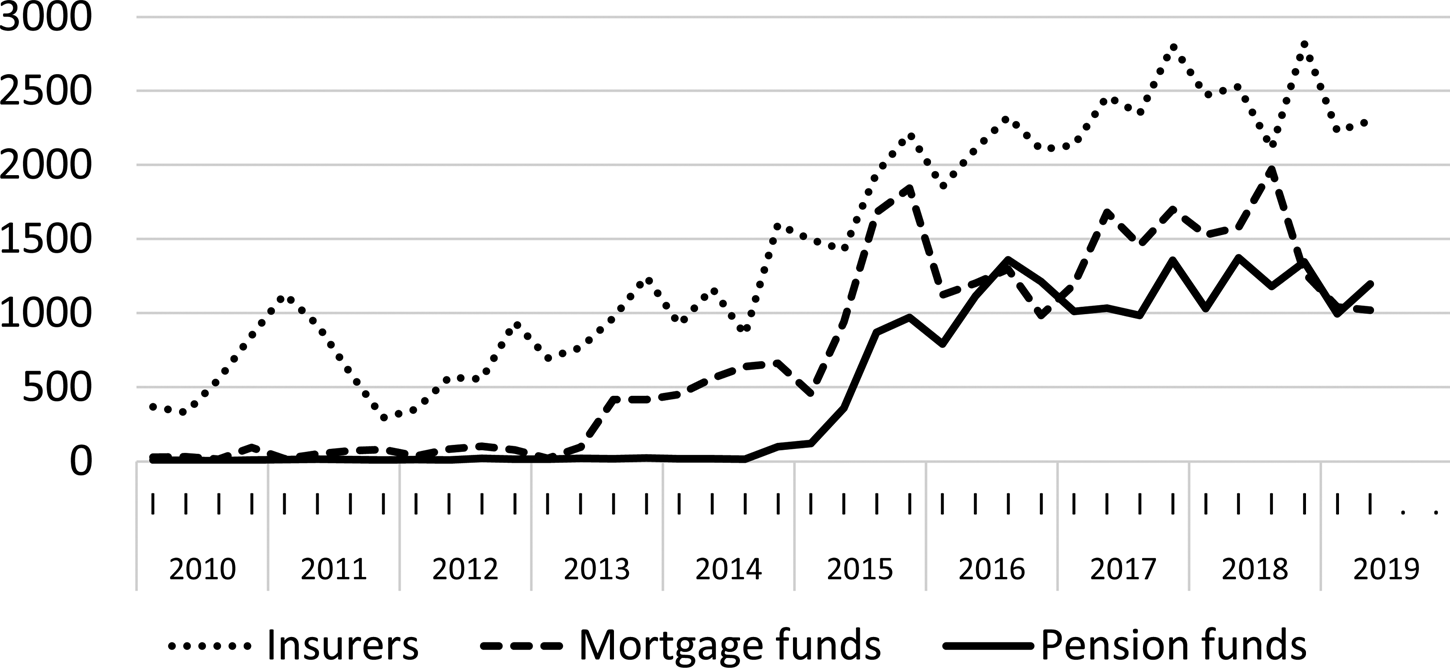
Moreover, one-third of Dutch mortgages are guaranteed by the state using an insurance against residual debt called the Nationale Hypotheek Garantie (NHG), i.e., National Mortgage Guarantee (see Hale, Reference Hale2016b), which substantially reduces expected losses. Mortgages are attractive to pension funds because of the potential for diversification (see Trappenburg, Reference Trappenburg2015) and hedging. Dutch pension funds have historically favored other types of investments (Broeders et al., Reference Broeders, Jansen and Werker2021), but have significantly increased their mortgage investments since 2014 (Figure 3).
Amount of mortgage investments (in € million) by pension funds per quarter.
Explanatory note: Source: LLD (2018q4) and Mercurius data (2019q2) of DNB, own computations.
Before 2013, the Dutch mortgage portfolio, which was mostly held by banks, consisted of 60% of interest-only mortgages (Mastrogiacomo and Van der Molen, Reference Mastrogiacomo and Van der Molen2015). As full amortization was then required for new loans, new mortgages with less risk were originated. At the same time, LTV limits were also reduced, making Dutch mortgages safer. This, too, triggered greater participation of pension funds in mortgage markets. We will therefore consider in our empirical analysis both the share of interest-only loans and the LTV of the mortgages being purchased. As the Dutch economy recovered, house prices have bounced back to their original level, thus drastically reducing the share of underwater mortgages as well (DNB, 2016b).
Figure 3 also shows a surge in mortgage investments for insurers and mortgage funds. Interestingly enough, also for insurers the surge seems to accelerate after the implementation of the relevant financial assessment frameworks. We mean both those of banks – as some insurers participate in financial conglomerates – (thus Basel 3 in 2010–2013) and their own (Solvency II in 2016). This indirectly supports the results for pension funds that we show in the next section.
In this study we only look at direct mortgage investments. When banks securitize mortgages, in our data these loans are attributed to banks, and cannot be separately identified. However pension funds invest in these securitized pools too, thus creating an indirect exposure to mortgages too. According to DNB statistics, prior to the introduction of the FTK for instance, of the 30.6 billion euros in mortgage investments by pension funds, 17.8 billion euros was invested in RMBS, 1.4 billion of this was held in Dutch RMBS. Only a smaller part (9.1 billion euros) of the total mortgage portfolio was invested directly in Dutch residential mortgages.
4. Data and descriptive evidence
4.1 Loan-level data on institutional investors
For the empirical analysis, we combine two data sources: The Mercurius Loan-Level Data and the balance-sheet data of pension funds. The Mercurius Loan-Level Data of DNB are a dataset on the individual mortgage loan profiles held by non-banking financial institutions, including institutional investors, such as pension funds, and insurers. Since these details have never been obtained before from these types of institutions, the data are unprecedented. As the market shares of the non-bank sector in the mortgage market started to increase, DNB launched a new monitoring action, and the data were collected for the first time in the second quarter of 2016. Mortgage information here is retrospective. This means that we observe all mortgages present in the pension funds' portfolios at a given point in time, and here this is 2019q2. For all loans that are still performing in 2019q2, we observe information both as it was at origination (either at purchase or renegotiation) and current (2019q2). This has several implications. Dynamic selection could appear at renegotiation, for instance because a loan originated in 2000 and renegotiated in 2010 could seem in 2019 more recent than it actually is. We show in the online Appendix (see Figure A1) that this does not happen rapidly. The vast majority of renegotiations in the Netherlands only involve resetting the interest rate, which fortunately does not overwrite the origination date in our data. Should the renegotiation also involve a shift to a different provider, then the original information is lost. As in all retrospective datasets, also those who redeemed mortgages in the past are no longer considered as performing at reporting date.
According to the reporting instructions published by DNB (2017), 24 characteristics must be delivered. These consist of borrower (age, employment status, etc.), collateral (valuation amount, property postcode, etc.), and loan characteristics (loan-origination date, original balance, original LTV, type of guarantee provider, loan payment type, maturity, debt to income, etc.).
Pension fund characteristics (funding ratios, total assets, total number of participants, etc.) are provided by the balance-sheet data of pension funds. Using these data, we create two proxies of immunization for the investment policy of each fund. First a dummy, indicating the assignment of a recovery plan. No pension fund had a funding ratio below 105% in the third quarter of 2008 in our sample. This is why the relevant funding ratios for the assignment of the recovery modes are the ones at the end of the fourth quarter of 2008; thus, having a recovery plan means that funding ratios were below 105% in that quarter. Second, the degree of immunization is proxied by the reduction in funding ratios in the fourth quarter of 2008, relative to the third quarter of 2008. We consider pension funds whose funding ratios dropped by more than 15% to be low immunized.
The Mercurius Loan-Level Data, combined with the balance-sheet data of pension funds, enables us to conduct this investigation in the form of a quasi-natural experiment.
4.2 Descriptive statistics
Thanks to the individual loan-level data on the whole range of financial institutions, we present a retrospective path of mortgage exposure by institutions and their market shares in Figure 4. The market grew significantly since the 2013s and was dominated by banks, while the share of banks has been declining.
Mortgage debt by origination year and by mortgage originators (in € million).
Explanatory note: Source: LLD (2018q4) and Mercurius data (2019q2) of DNB, own computations.
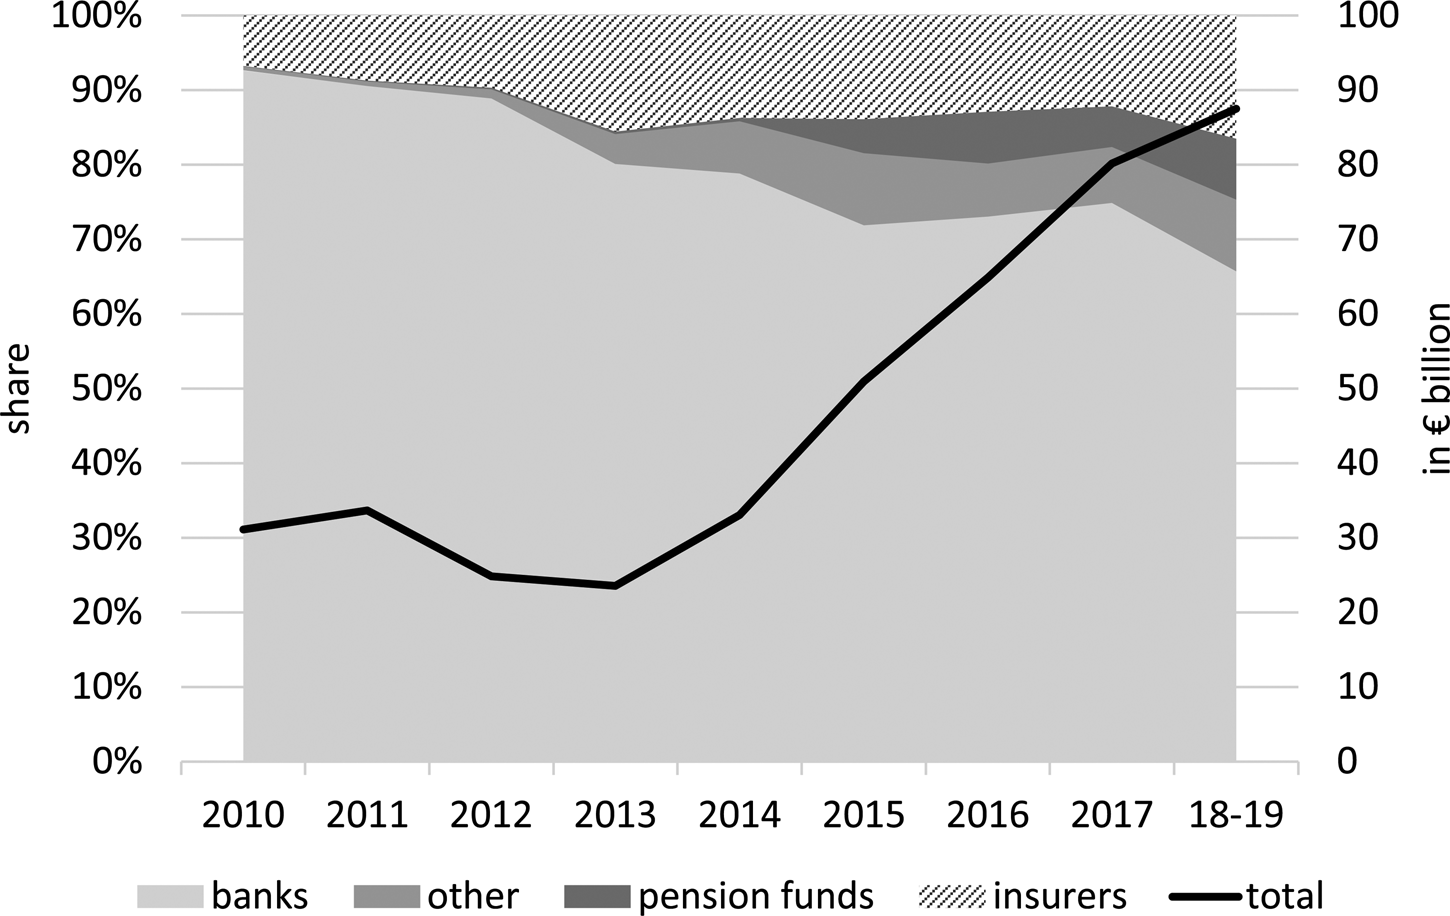
Pension funds started increasing their mortgage investments in 2014. With the Basel ${\rm {\rm I}{\rm I}{\rm I}\;}$ agreements, the quantitative and qualitative capital requirement of banks were tightened (DNB, 2015) and banks reduced their supply of mortgages. Institutional investors, mostly insurers and pension funds, have filled this gap. Pension funds mortgage underwriting increased, again possibly also due to the new FTK. As of 2015, pension funds supplied about 5% of the total mortgage debts in the market. According to Dodds (Reference Dodds2015), the institutional investments in mortgages were expected to grow and take market shares of 15–25% over the next several years.
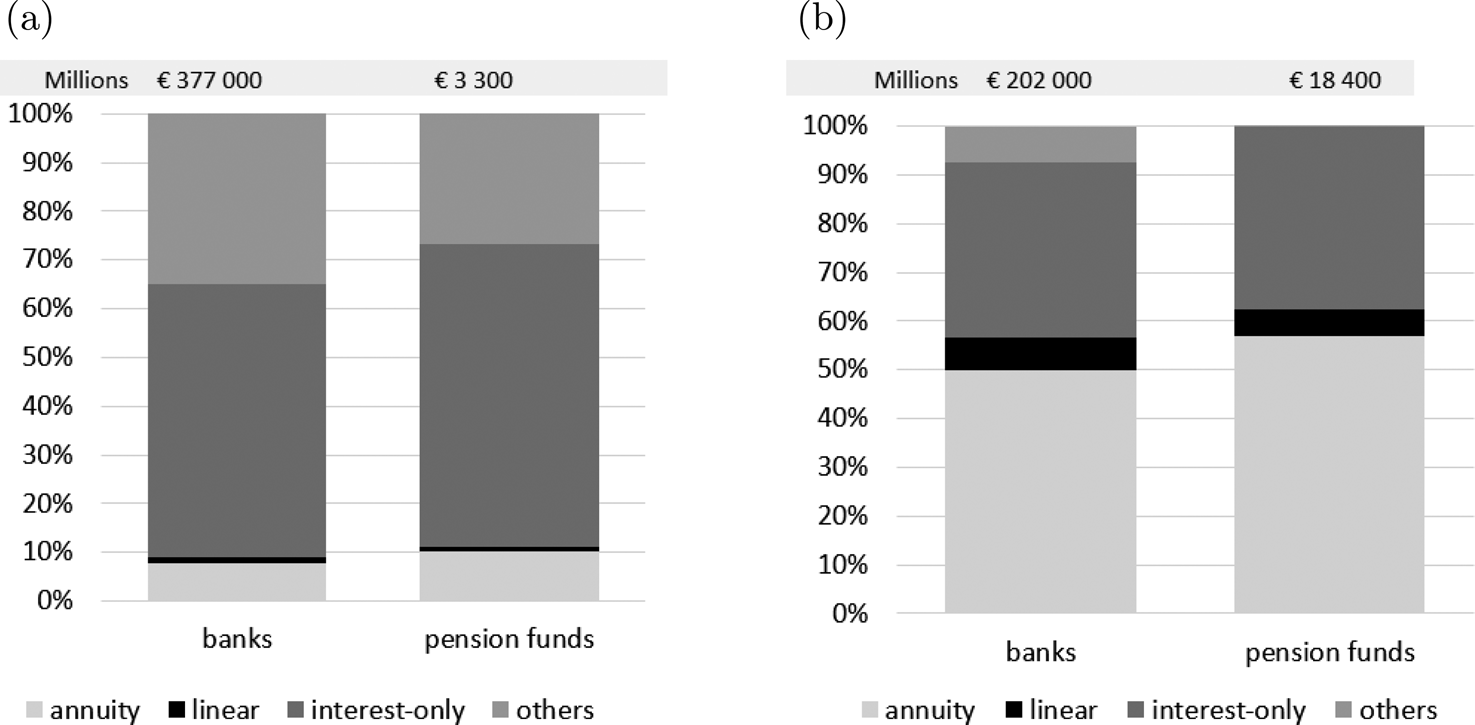
In our data, we can look at funds' underwriting by household or loan characteristics; as an illustration we do so looking at loan types, NHG, and LTV. Figure 5a shows mortgage debt by loan type. Mortgages undertaken by pension funds are somewhat more often amortizing (linear and annuity), thus less risky relative to banks. And since 2013, tax deductibility has become only applicable to fully amortizing mortgages. For this reason, interest-only and deferred-amortization loans nearly disappeared, and pension funds invested in amortizing loans (relatively) even more since 2015 compared to banks (Figure 5b).
Mortgage debt by loan payment type (a) before 2015 (b) since 2015.
Explanatory note: The vertical axis shows the relative composition in investment shares. Volumes are reported above the bars in million euro for banks and pension funds separately.
Source: LLD (2018q4) and Mercurius data (2019q2) of DNB, own computations.
Due to the new regulations introduced in the 2011 code of conduct, the LTV ratios of new mortgages were capped at 110% and decreased by law to 106% in 2012 to then step further down by 1% every year until they reached a cap of 100% in 2018 (DNB, 2016b). Figure 6a clearly shows that pension funds have invested more in low-LTV mortgages relative to banks, especially for the category below 100%, and they had no top-risk mortgages (above 130%). Since 2015, the portfolios of pension funds and banks became more similar in terms of LTV distribution, with the notable exception of pension funds that do not yet invest in the high-risk LTV segment.
Mortgage debt by original LTV (a) before 2015 (b) since 2015.
Explanatory note: The vertical axis shows the relative composition in investment shares. Volumes are reported above the bars in million euro for banks and pension funds separately.
Source: LLD (2018q4) and Mercurius data (2019q2) of DNB, own computations.
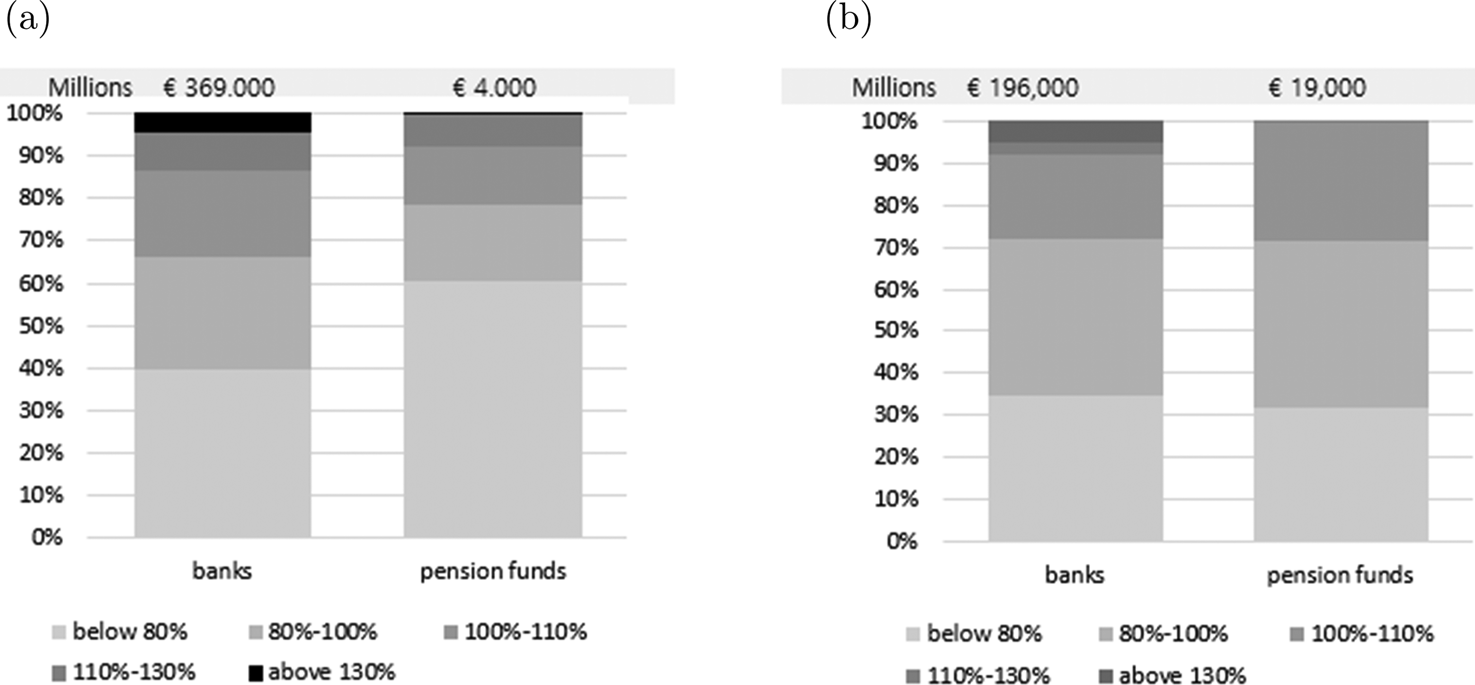
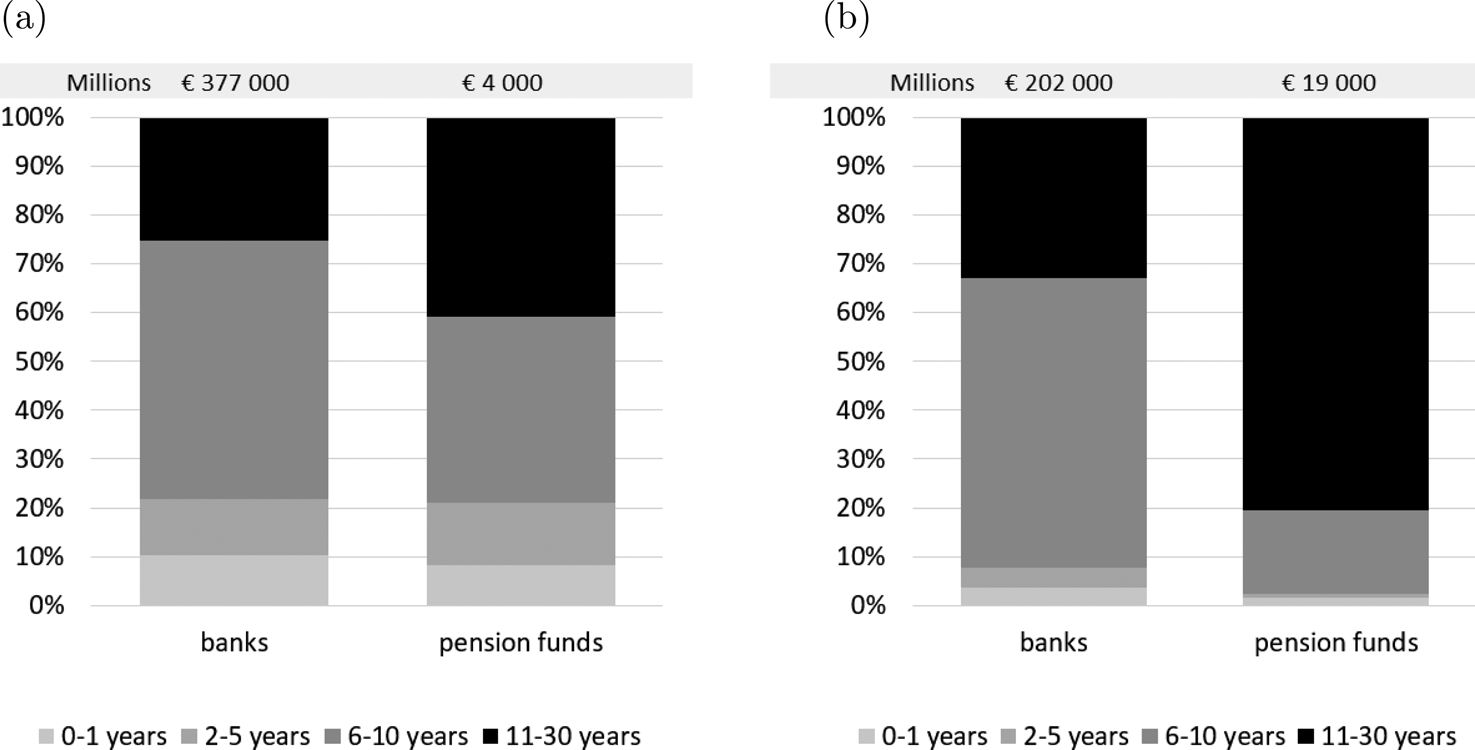
Figure 7 shows how mortgage loans issued more recently by pension funds have more often a longer interest rate reset frequency at origination relative to the portfolio of banks and relative to mortgages issued by pension funds before 2015. A longer reset horizon immunizes borrowers from the risk of interest rate shocks and makes their mortgages safer relative to loans with revolving interest rates. If pension funds use mortgages to hedge their portfolio, it is consistent to invest in loans that are relatively better hedged against such risk.
Mortgage debt by original interest rate reset period (a) before 2015 (b) since 2015.
Explanatory note: The vertical axis shows the relative composition in investment shares. Volumes are reported above the bars in million euro for banks and pension funds separately.
Source: LLD (2018q4) and Mercurius data (2019q2) of DNB, own computations.
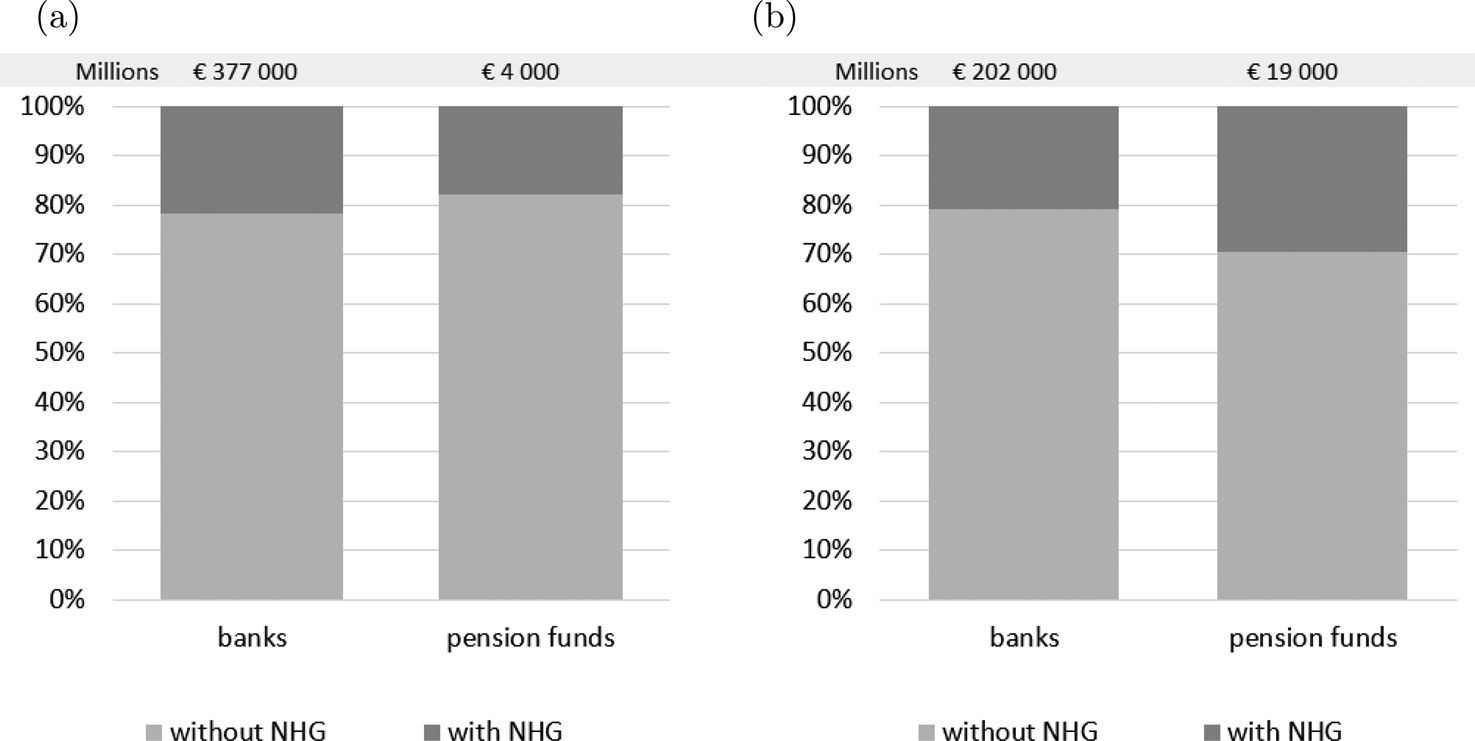
Mortgage loans can be backed up by a state guarantee known as NHG (see Kim et al., Reference Kim, Mastrogiacomo, Hochguertel and Bloemen2019 for details), which is an insurance for borrowers against residual debt after selling a collateral. Only borrowers who purchase houses with a value below €245,000 qualify for the insurance as of July 2015 (NVB, 2016) and this threshold changes nowadays following average house price. As Figure 8a indicates, 22% and 18% of the mortgages were covered by NHG for banks and pension funds, respectively. When looking at recent production (Figure 8b), those issued by pension funds were more likely to be insured by NHG (29% for pension funds, 21% for banks).
Mortgage debt by NHG coverage ratio (a) before 2015 (b) since 2015.
Explanatory note: The vertical axis shows the relative composition in investment shares. Volumes are reported above the bars in million euro for banks and pension funds separately.
Source: LLD (2018q4) and Mercurius data (2019q2) of DNB, own computations.
Lastly, borrower age profiles are also reported in our data. Age distributions are very similar across different institutions especially for the mortgages invested since 2015. While Figures 6a and 6b suggest a lower risk taking of pension funds already before the introduction of the new framework in 2015, the share of NHG seems to suggest lower risk taking since 2015. Evidently, two-dimensional descriptives do not allow to relate the complexity of the developments on the mortgage market. For instance, pension funds stepped in market more recently, thus after the introduction (and progressive sharpening) of LTV caps, and in a period when the qualification criteria of NHG often changed (the qualification threshold has first been increased sharply, then reduced abruptly and frozen; when the data were collected it had stayed behind price developments for some years).
5. Model and estimation results
5.1 Mortgage investment by two types of pension funds
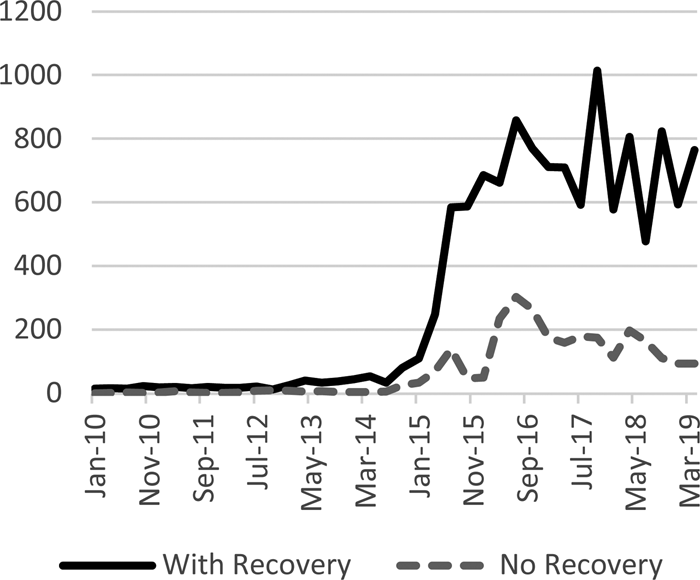
Funds that were subject to recovery plans (our treated group) have invested more in mortgages since 2014 (see Figure 9). Previously, there was a common trend in mortgage investments by all pension funds whereby very little was being underwritten.Footnote 6 As there is no reason to suspect that mortgages by pension funds with/without recovery plans had survived unequally before 2008, the similarity in their level of investments suggests the validity of the common trend shown in Figure 9.Footnote 7 The figure shows that the funds that underwent the first recovery modes from 2009 to 2013 started investing more in mortgages from 2014 after the new FTK had been implemented. On the contrary, funds that were not subjected to recovery plans added more limited exposures. Looking at the averageFootnote 8 mortgage investments for those two types of funds (Figure 10), this evidence still applies, suggesting that larger total investments are not the results of compositional effects whereby a specific type of fund grants higher debt.Footnote 9
Total mortgage investment of two types of pension funds (€ million per quarter).
Average mortgage investment of two types of pension funds (€ million per quarter).
Explanatory note: Our panel is yearly balanced. However, we receive the data in such a way that we can organize them on quarterly basis. As not all funds underwrite mortgages in each quarter, a few cells are empty. Replacing the missing cells with zeros does not significantly change the descriptive evidence, nor the estimation results that will follow.
Source: Mercurius data (2019q2) of DNB, own computations.
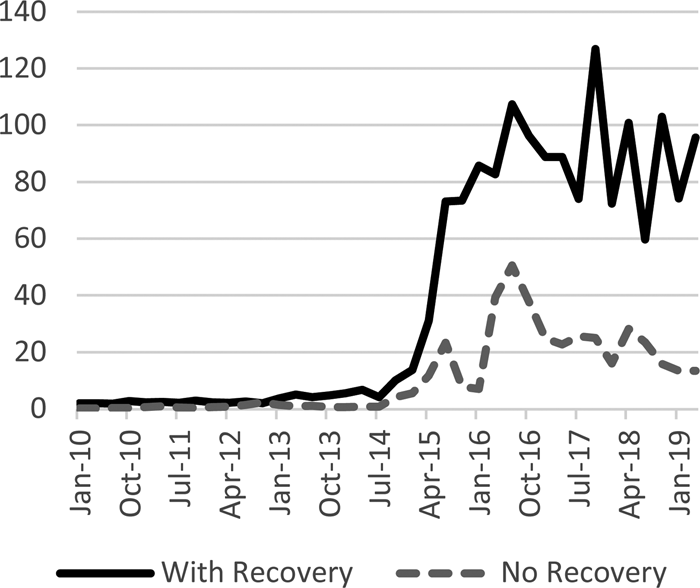
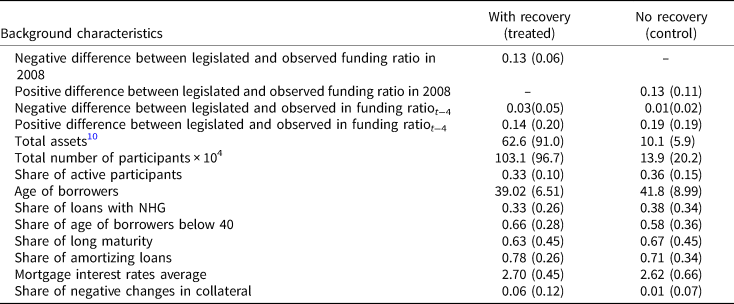
Table 1 shows summary statistics of background characteristics for the treatment (recovery plan) and control groups. Of the 15 pension funds, eight are present in the treatment group and the rest are in the control group. There are two company funds in each of these groups. We also included variables relevant to the computation of the funding ratio of pension funds, such as the distance of each fund from the legislated funding threshold.
Summary statistics of two types of pension funds (one with recovery plans and the other without recovery plans) in the estimation sample: means and standard deviations
Explanatory note: Standard deviations in parentheses.
Source: Mercurius data (2019q2) of DNB, own computations.
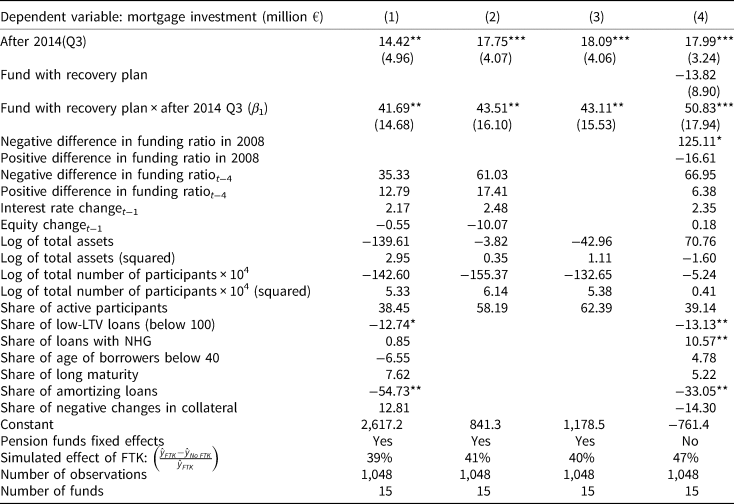
The two groups are quite similar in terms of most of the aspects, including the distance from the legislated threshold (measure in 2008 or relative to the previous year), the share of active participants, the age of borrowers, and the share of loans with NHG, both in means and standard deviations. More pronounced differences arise from total asset and total number of participants, two features that are obviously correlated and that depend on the two main pension funds being included in the treatment group. These two characteristics will therefore be included in all of the specifications in our regression models (Table 2).
Estimation results of mortgage investments by pension funds
Explanatory note : Source: Mercurius data (2019q2) of DNB, sample period from 2000q1 to 2019q2, own computations. Clustered standard errors at pension fund level in parentheses. ***p < 0.01, **p < 0.05, *p < 0.10.
5.2 Empirical model
We construct a panel dataset by considering each pension fund as the unit of analysis (i) and looking at different periods (t) as loan-origination quarters retrospectively. The following models with fixed effects are used to estimate the effect of the recovery plan on the amount of mortgage investments made by pension funds after implementing the new FTK.Footnote 11

where y is the aggregate amount of mortgages loans of pension funds by quarter of origination. We have 15 pension funds which reported their mortgage exposure.
$D_i^{treat}$ is equal to 1 if the funding ratio of the pension fund was below 105% in 2008 and thus a recovery plan was imposed from 2009 onwards, and $D_t^{post}$
 is 1 for the period after July 2014. The interaction dummy between $D_i^{treat}$
 and $D_t^{post}$
 is our main variable for interest, which elicits the effect of the new supervisory rules on mortgage underwriting. Notice that the exogenous effect is granted by using recovery modus in 2008 and the performance relative to the 2015 FTK parameters. It is expected to deliver a positive effect (β 1). Even though the first recovery periods ended in 2013, a number of pension funds had not fully recovered by then. After 2013, recovery actions still needed to be undertaken. By 2013 it was not yet entirely clear which details would be included in the new FTK, though some had already been discussed since 2010. For this reason, pension funds might have been unwilling to plan their new investment strategies until the new FTK was published in June 2014. Hence the $D_t^{post}$
 dummy is 1 after third quarter of 2014. Mortgage investments by pension funds with recovery plans have significantly increased after the third quarter of 2014. One of the possible reasons is that, even after the new FTK was announced, it did not become effective until January 2015, and the new (lower) UFR was actually only applied on July 1, 2015.
The vector of control variables (X it) includes the share of loans guaranteed with NHG, the share of amortizing loans, the share of long-maturity loans (beyond 20 years), the share of negative changes in collateral values, and the share of borrowers younger than 40. It also includes fund characteristics such as log of total assets, log of the number of total participants, the share of active participants, and, later, asset allocation.
Two macro variables are included in the model in order to account for time effects: the lag of the interest rate changes of Dutch government bonds (10 years) and the lag of OECD Share prices changes for European countries (Euro area, 19 countries).
Table 2 shows the estimation results of our Diff-in-Diff model with fixed effects ((1), (2), and (3)) or with random effects ((4) including time-invariant features). Clustered standard errors at the pension fund level are also shown in parentheses. Estimation results are listed by four different specifications. Our preferred specification (1) includes all variables. The second column (2) excludes the mean characteristics of loans and borrowers. The third specification (3) only contains Diff-in-Diff essential variables and the size variables. Our β 1 coefficients (placed in the third row in Table 2) are similar in all models, positive, and generally significant at conventional statistical levels. More mortgages are supplied by pension funds with recovery plans after the new FTK has been published.
A within-sample quantification of the effect of the framework with model (1) predicts a mortgage investment of €16.3 million that would be reduced to €9.9 million if the framework had not been introduced. This means that the new FTK has led to about €6.4 million of additional mortgage investments per quarter (a relative increase of about 39%, see the estimate of $( \hat{y}_{FTK}-\hat{y}_{No\;FTK}/\hat{y}_{FTK})$ . According to models (1) and (4), the higher the share of low-LTV or amortizing loans, the lower the mortgages investment will be. Since such loans (high LTV or interest-only) were popular and available only in the past, the funds with a higher share of those (risky) loan characteristics were likely to be the ones which invested more in mortgages before 2013. This might therefore indicate that the negative sign of the coefficient is a result of the legacy for funds that were active in the past. The negative sign of the share of amortizing loans tells the same story since the tax deduction on mortgage interest rates for non-amortizing loans has been penalized since 2013.
Table 3, in which we describe some main variables by fund, shows that this is likely. For example, the total mortgage volume issued by fund 1 makes it a large one in the sample, but its share of amortizing loans and insured loans with NHG is considerably lower than that of other pension funds. The average borrowers' age for this fund also suggests the presence of legacy issues.
Summary statistics of fifteen pension funds: total mortgage volume and mortgage characteristics
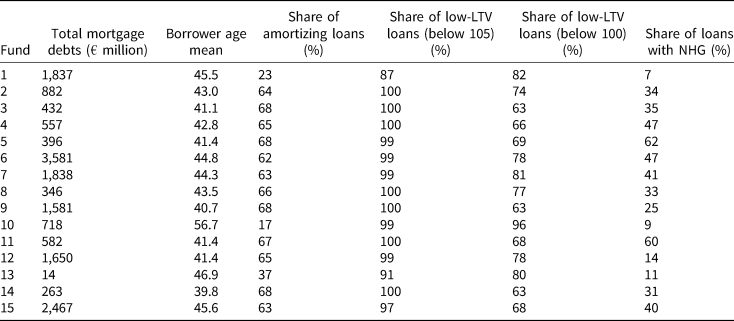
Explanatory note: Mercurius data (2019q2) of DNB, own computations.
The coefficients for the distance from the legislated funding ratio in specification (4) show that unhealthy funds invest more in mortgages in general while healthy funds do not show particular patterns. The further their financial position is from the legislated threshold, the more they invest in mortgages. This is consistent with our findings so far. Also the literature on LDIs with a downside penalty (e.g., Ang et al., Reference Ang, Chen and Sundaresan2013) suggests that when there is a penalty (imposing recovery plans in our case) on the deficit (low funding ratios), the closer the pension fund is to reaching the full position, the less risk they will take. They become more risk-averse when their financial position is close to the threshold and aim to hold liability-hedging portfolios. On the contrary, those pension funds whose funding ratios are far below the threshold will invest in more risky assets, seeking higher returns to avoid penalties (‘swing for the fences’, Ang et al., Reference Ang, Chen and Sundaresan2013). One might expect that among the unhealthy funds, those investing more in mortgages are not the ones with the lowest funding ratio, but those with a funding ratio somewhat closer to the legislated one. Our results do not allow us to specifically support nor oppose this hypothesis.
As for the funding ratio gap in the previous year (four quarters previously), we do not find evidence that this affected current mortgage investments significantly.
We also estimate a model for safe mortgages alone, looking at various risk criteria (LTV ratio, loan type, NHG, and LTI ratio). We estimate separate models for borrowers with (1) LTV below 105, (2) LTV below 100, (3) amortizing loans, (4) with NHG, and (5) LTI below 4. The resulting estimations of β 1 are shown in Table 4 with the baseline estimation (1) in Table 2 for comparison.
Estimation results of investments by pension funds in safe mortgages
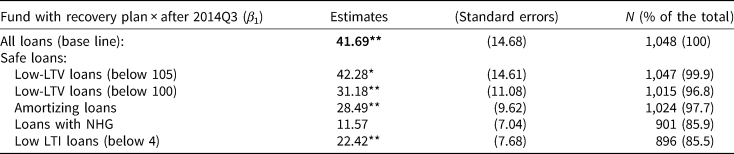
Explanatory Note: Clustered standard errors at the pension fund level (N = 15) in parentheses. *** p < 0.01, ** p < 0.05, * p < 0.10.
Each specification has a different sample size, all representing subsets of mortgage underwriting by the same group of the pension funds, but safer loans than the base case. The estimates are positive and significant for low-LTV (both below 100 and below 105), amortizing loans, and low LTI loans (below 4); finally the specification with loans insured with NHG shows (borderline) non-significant results. The worse-performing funds have thus invested more in somewhat safer loans.
Asset allocation information, which we have ignored so far, can provide information on how the risk appetite of pension funds before the crisis affected mortgage investments after the new FTK. We provide descriptive evidence of this for funds with/without recovery in Table 5. We have this information only for a subperiod of our analysis above, from the last quarter of 2006. Pension funds with recovery modes have on average less fixed income and real estate, and more equity and alterative assets in their portfolios for both periods. However, the difference in fixed income and equity were notably larger before the financial crisis.
Asset allocation of pension funds from 2006 Q4 to 2017
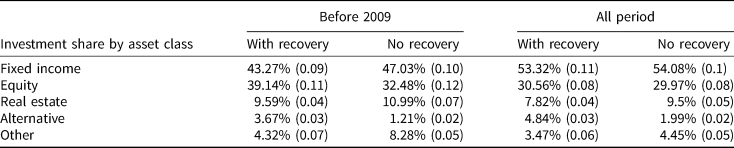
Explanatory note: Standard deviations in parentheses.
Source: DNB, own computations.
More risk-averse funds typically hold larger fixed income (or smaller equity) shares. To identify relatively risk-averse funds, we first calculate the mean share of bonds and mortgages that each fund had before 2009 and compare it to the sector mean by converting this difference to percentages in terms of distance from the sector mean. Specifications (5) and (6) in Table 6 include this additional term and present the results with fixed effects and random effects, respectively. As asset allocation could respond to the previously included macro variables, we include quarter dummies as time effects.
Additional estimation results of mortgage investments by pension funds
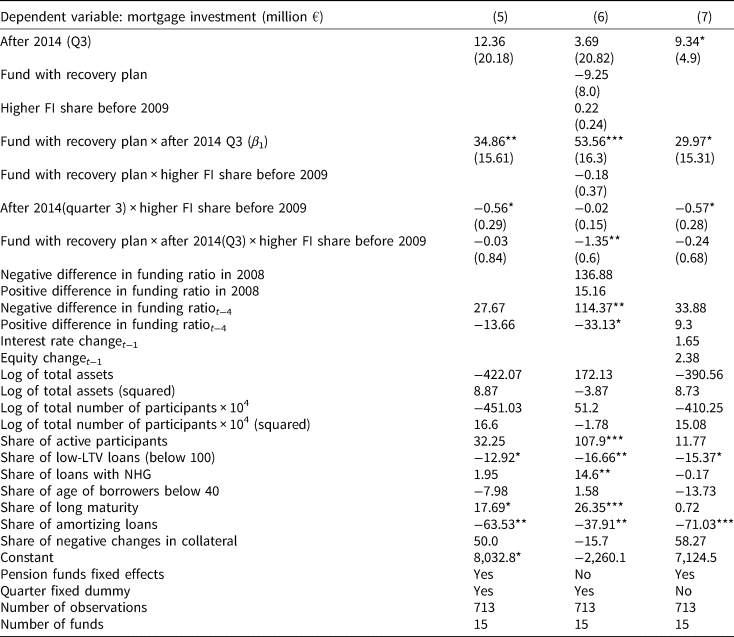
Explanatory note: Source: Mercurius data (2019q2) of DNB, sample period from 2006q4 to 2017q4, due data availability of asset allocation; own computations. Clustered standard errors at pension fund level in parentheses. ***p < 0.01, **p < 0.05, *p < 0.10.
The estimate of β 1 shows similar (but smaller) results to those in the baseline specification shown above. A higher share of bonds before the crisis implies investing less in mortgage after the crisis. This result can be explained in two ways. Funds with a high FI share might do so because they are already better immunized. But funds could also see mortgages and bonds as substitutes rather than as complementary investment strategies.
We have also added a triple difference term for the interaction among high FI share before 2009, recovery mode, and the introduction of the new FTK. This effect is only significant in one specification, and then it is negative and of small magnitude. This means that we find no evidence that more risk-averse pension funds experiencing a recovery mode during the financial crisis are willing to be more immunized relative to less risk-averse funds after the new FTK. They could have done so using more fixed-income assets and less risky investments, but out results do not give an indication in this sense.
When we use the equity share instead of the FI share, our results are the mirror image of those above. Also reducing the time window for baseline specification (1) to overlap with the one in (5) delivers nearly identical results (not shown).
5.3 Robustness checks
We carry out some robustness checks for the effect of the FTK introduction. In panels A and in Table 7, we test placebo effects and anticipation effects to tackle potential biases in the estimation results (Gertler et al., Reference Gertler, Martinez, Premand, Rawlings and Christel2010). This boils down to changing the treated group (placebo) or the treatment period (anticipation). Also we add to the model the level of or changes in the interest rate and the interaction with the recovery mode dummy (see panel C in Table 7). This is in order to test whether the decline in interest rates rather than the introduction of the FTK is responsible for the surge in mortgage investments. We also test the effect of pension funds dummies in panel C that could for instance pick up fund-specific investment beliefs (for instance in terms of future inflation or interest rates levels). Finally, in order to test whether larger funds are more likely to invest in mortgages, we perform three different specifications regarding the fund size (see panel D in Table 7).
Robustness checks for β 1
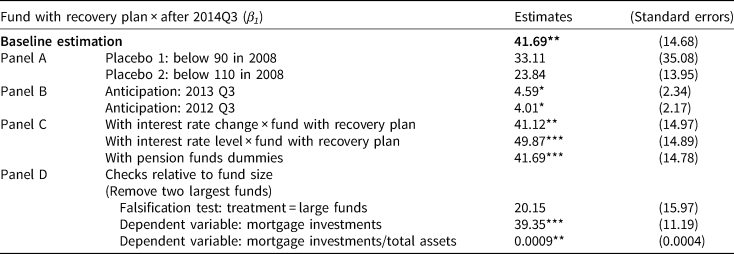
Explanatory note: Placebo effects do not deliver significant results; this is in support of our specification. Anticipation effects are borderline significant, but their magnitude is negligible. Also anticipation effects turn out non-significant if we remove a pension fund that shows one spike in investment in 2014. Adding the 10-year government bond yields (changes) and its interaction with recovery mode dummy delivers comparable results to our baseline specification. Full estimation results for this table are shown in the online Appendix (from Table A1 through A12). Standard errors in parentheses, ***p < 0.01, **p < 0.05, *p < 0.10.
For the placebo effect, we choose a false treatment, selecting pension funds with funding ratios below 90% and 110% in 2008. As for the anticipation effect, pension funds could have been anticipating the changes in assessment criteria before the actual implementation. This is why we set the start of the FTK ahead in time by one or two years. The interest rate enters the robustness checks with two specifications. First we add the change in the 10-year Dutch government bond yields and its interaction with the recovery mode dummy. Second, we use the interest rates level instead of the interest rate change, and again the interaction with the recovery plan dummy. The last three rows in Table 7 test the effect of fund size on mortgage investments by dropping the two largest funds in our data (not necessarily the two largest funds in the Netherlands). Here we not only control the fund size characteristics (with total assets and total number of participants) as we did in our baseline regression but also perform three different tests. We perform a falsification test in a regression in which the treatment is assigned not using our supervisory data, but using fund size (in terms of total assets, largest half of pension funds is defined as treated). We also show an additional check with the same dependent variables (mortgage investments) but without the two largest funds again. Finally we use mortgage investments/total assets as an additional dependent variable, in the last robustness check. Table 7 shows both placebo and anticipation effects results reporting β 1 estimates (and their clustered standard errors) estimated from the baseline model (1), as well as the additional specifications with the interest rates and fund size.
All placebo specifications show no significant results. The results show instead significant coefficients for the anticipation effects, which might seem difficult to reconcile with the statements above. This coefficient is however only borderline significant, and most of all it is extremely small in magnitude relative to the results discussed in our study. Inspection of the data suggests that if we exclude one of the pension funds present in the data that is an outlier in terms of increased mortgage investments in 2014, the significance of this one anticipation effect disappears again. This suggests that the effects we have found crucially depend on correct identification of the treatment group after the effective implementation of the new rules. We also performed a pre-trend test where we run the baseline regression again by adding to it the interaction between the quarterly dummies and the recovery mode dummy. None of the estimated coefficients of this interaction term was statistically significant at the 5% level before 2014q3, which suggests that we find no pre-trend differentials.Footnote 12
Adding changes in the interest rate or interest rate level delivered no statistically significant coefficients (not shown) for the change or level itself, nor for interaction with the recovery mode, while all other results were comparable. Both cases did not change our results. Also the specification for pension funds dummies left the estimate of β 1 unchanged.
The distribution of total assets among pension funds is highly skewed by the presence of two extremely large pension funds. This is potentially an issue driving the results and should be accounted for. The three tests where we take fund size into account confirm our main narrative. The falsification test indicates that the main coefficient (β 1) then turns insignificant. The results in the second check are qualitatively similar (direction of the effect and significance) to our baseline estimation but the magnitude of the effect is somewhat smaller. As a final check, the regression with mortgage investment share (compared to the total assets) still shows a significant coefficient for β 1. These results confirm our baseline estimation results, but this does not mean that skewness of total assets should be downplayed in studies like the present one.Footnote 13
6. Summary and conclusions
This study focuses on the recent trend of increased mortgage investments by pension funds, which we found was the result of the combined effect of recovery experiences after the financial crisis and the new financial assessment framework published in 2014. Pension funds that underwent recovery plans (treatment group) after the crisis have supplied more mortgages since 2014 compared with the funds without those recovery modes (control group). Worse-performing pension funds have tried to improve their financial positions by further hedging their interest rate risk by holding more mortgages. They preferred mortgages as these became more appealing as the new FTK introduced in 2015 puts greater weight on the financial sustainability of pension funds, making them seek a better risk/return trade-off and more risk hedging. We also show that they were more likely to invest in safer mortgages. Mortgages also became more appealing due to falling interest rates, but this does not conflict with our main finding.
The reduction in interest rates is also positively related to the surge in mortgage investments, but it only makes a modest contribution. The direction of the causality between these two variables is not obvious as yield premia on mortgages could increase when interest rates fall. At the same time, funds are more likely to search for yields, thus pushing down premia, when rates fall. For the specific case of pension funds though, the surge in investment started after the interest rates had already significantly fallen, which contributes to disconnect somewhat these two phenomena.
Supplementary material
The supplementary material for this article can be found at https://doi.org/10.1017/S1474747222000221.



