Implications
Despite a shortage of relevant studies, it appears that energy and protein requirements in tropical and warm regions are different from energy and protein requirements in temperate regions. In tropical areas, ME requirements of small ruminants for maintenance are higher, whereas production requirements are identical. Consequently, the total energy requirement for a similar level of production is also higher. With regard to protein, maintenance, production and consequently total requirement would be similar in both environments.
Introduction
Farming systems in southern countries are generally quite different from that in temperate countries (Delgado et al., Reference Delgado, Rosegrant, Steinfeld, Ehui and Courbois1999) because of the following factors: (1) climatic environment; (2) diets with lower nutritional value; and (3) animal genotypes. However, the feeding recommendations for farm animals in tropical and warm regions are still largely based on standards established in temperate regions (Agricultural Research Council (ARC), 1984; Institut Nationale de la Recherche Agronomique (INRA), 1989; National Research Council (NRC), 2007). The adaptation to diet and climatic condition affects nutrients partition, animal growth, body composition and, consequently, energy and protein requirements (Berg and Butterfield, Reference Berg and Butterfield1976). The nutrient requirements of animals in tropical and warm regions could differ from those described in feeding standards for temperate countries. Studies on tropical livestock have focused on sheep (Paul et al., Reference Paul, Mandal, Mandal, Kannan and Pathak2003), goats (Mandal et al., Reference Mandal, Paul, Mandal, Kannan and Pathak2005) and cattle (Paul et al., Reference Paul, Mandal, Mandal, Kannan and Pathak2004) under the same condition with local breeds. However, to our knowledge, there is no recent work that has focused on the requirements of ruminants in tropical regions using a large database in order to take into account the maximum diversity of animal genotypes and dietary systems.
The objective of this study was to determine energy and protein requirements of growing ruminants in tropical and warm countries by running a meta-analysis on a large database built from independent studies.
Material and methods
Data collection
A literature survey was conducted taking data from various international scientific reviews, easily accessible regional reviews, reports and theses. Publications were selected to include several major criteria: (1) chemical composition of the diet; (2) data on animal performances; and (3) if possible, data on in vivo digestibility and nitrogen balance. In total, 589 publications representing 2225 different dietary treatments from feeding trials were used in the present study. In addition, another database containing published results on energy and protein requirements obtained via different methods (the calorimetric method, the slaughter method and meta-analysis of feeding trials) has been analysed in order to compare the results in our study (see Tables 1 and 2). The calorimetric method is conducted in respiration chambers to measure gas exchange, fasting heat production and energy loss via urine and methane with animals fed at maintenance level. The slaughter method is based on feeding trials with animals fed at two or more levels of intake (one of which approximates maintenance). The procedure measures both ME intake and retained energy (RE) as the change in body energy content of animals. The slope of the linear regression of RE on ME intake provides an estimate of efficiency of utilisation of ME for RE and in growing animals equates to ME for growth. In the feeding trials method, the estimations of maintenance and growth requirements are made with potential growing animals fed continuous levels of energy to potentially cover less than one to several times the necessary requirements for a zero growth.
ME requirement for maintenance (kJ/kg LW0.75) and growth (kJ/g ADG) as derived from meta-analysis of results from the literature

ME=metabolisable energy; ADG=average daily gain; MEm=metabolisable energy for maintenance; MEg=metabolisable energy for gain.
DCP requirement for maintenance (g/kg LW0.75) and gain (g/g ADG) as derived from the meta-analysis of results from the literature

DCP=digestible CP; LW=live weight; ADG=average daily gain; DCPm=digestible CP for maintenance; DCPg= digestible CP for gain.
Animals and diets used in the feeding experiments
Overall, the data compiled covered more than 154 different breeds: 81 of sheep, 48 of goats and 25 of cattle. There were 10 700 sheep, 3454 goats and 1855 cattle (including Zebu: 10%). For each species, three groups of genotypes were distinguished: genotypes from tropical and warm countries (75%), genotypes from temperate countries (16%) and crossbreds (9%). This splitting was performed according to the FAO classification (http://www.fao.org/docrep/t1300t/t1300t00.htm#Contents; http://www.fao.org/docrep/004/X6532E/X6532E00.htm#TOC,http://eng.agraria.org/,http://www.ansi.okstate.edu/breeds/). The regression of digestible CP intake (DCPI) and metabolisable energy intake (MEI) against average daily gain (ADG) to compare genotypes indicated that there was no significant difference (in slope or intercept) between tropical breeds and crossbreeds. Therefore, their data were pooled. Moreover, the regression of DCPI and MEI against ADG to compare sexes, potential for growth (high, medium and low) and different stages of age (from weaning to 8 months, from 8 to 12 months and over 12 months for small ruminants, and from weaning to 12 months, from 12 to 18 months and over 18 months for cattle) indicated that these three parameters have no significant effect on energy and protein requirements. Therefore, the data were pooled.
Diets were diverse, the majority being mixed diets (80%) and the rest being exclusively forage-based diets. Forages were also diverse: green or hay grass (54%), straw (30%), tree foliage (7%) and hulls (4%). Concentrates were generally composed of conventional ingredients, although unconventional resources were also used.
Estimations, calculations and encoding
The most important parameters considered were growth, physiological stage, duration of observations, intake, digestibility and nitrogen balance. In addition, equations were applied to provide consistency and conventional expressions for certain variables. Thus, MEI per kg of LW (MEI/LW, kcal/kg LW) was predicted from digestible organic matter intake per LW (DOMI/LW, g/kg LW) by the regression equation obtained on the ‘RUMENER’ database containing only calorimetric measurements on sheep, goats and cattle (Sauvant et al., Reference Sauvant, Giger-Riverdin, Serment and Broudiscon2011). The slope of 4.03 (MEI/DOMI) is similar to the value of 4.45 kcal ME/g total digestible nutrients (TDN) suggested by the NRC (2001).
MEI/LW=−2.03+4.03 DOMI/LW (n=975, R 2=0.99, r.s.d.=11.3)
For the assessment of requirements in terms of metabolisable protein (MP), the French protein digestible in the intestine (PDI) system was applied using global and robust equations for prediction based on dietary CP and digestible organic matter (OMD) taken from the INRA feed tables. The PDI content used for the calculation was the lower of the two estimates of calculated digestible protein in intestine estimated on basis of rumen-degraded protein (PDIN) and digestible protein in intestine estimated on basis on rumen-fermented organic matter (PDIE) supplied (INRA, 1978).
Publications were systematically coded to distinguish (1) animal species, (2) genotypes within-species, (3) sexes, (4) potential for growth and (5) classes of age in order to compare their respective requirements. Two methods were used to estimate energy (ER) and protein requirements (PR). The first consisted of calculating ER and PR without taking into account the interaction between energy and protein. The second consisted of testing whether the interaction between protein and energy levels affects ER and PR. For this reason, we defined three classes of CP% DM based on CP requirement for maintenance and maximum growth and/or diet quality as follows: low protein (LP: 0% to 7% CP), medium protein (MP: 7% to 14% CP) and high protein (HP:>15% CP). Moreover, we defined four classes of energy based on energy requirement for maintenance (23 g DOM/kg LW0.75) and maximum growth estimated from the INRA table as follows: very low energy (0 to 1×maintenance), low energy (1 to 1.2×maintenance), medium energy (1.2 to 1.4×maintenance) and high energy (>1.4×maintenance).
Statistical analyses
Inter-publication regressions of nutrient intake on ADG were calculated. Moreover, to test simultaneously the influences of species and genotypes on the intercept (maintenance requirements) and the slope (growth performance), analyses of variance and covariance were applied to the parameters. These meta-analyses were performed following the recommendations of Sauvant et al. (Reference Sauvant, Schmidely, Daudin and St-Pierre2008) using Minitab software (Minitab® 15.1.30.0., 2007). Outliers were removed when their normalised residues were >3.
Results
Description of the data set
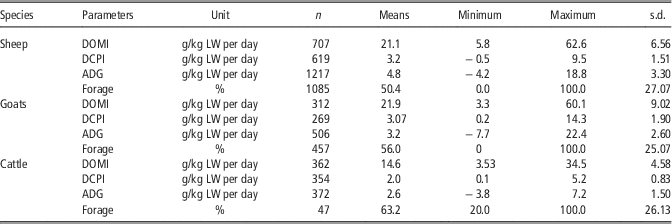
Table 3 reports the statistical parameters of the major variables. As the level of intake and the requirements are generally expressed on various powers of LW, mainly 0.75 and 1, we performed a preliminary study to assess the best value to compare species. The inter-experiment relationship between the data on dry matter intake and LW after a log10 transformation indicated that intakes of sheep, goats and cattle are similar if they are expressed on the basis of LW0.862 (Table 4, equation (1)). Nevertheless, we have chosen to express the data on the basis of their LW0.75 and LW1 in order to compare our results with those given in the literature.
Description of animal intake and ADG

DMOI=digestible organic matter intake; LW=live weight; DCPI=digestible CP intake, ADG=average daily gain.
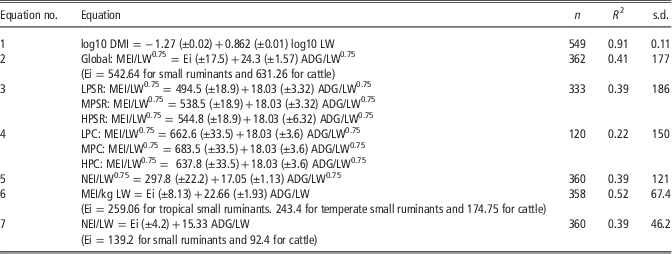
Equations for prediction of energy requirements (MJ/kg LW0.75)
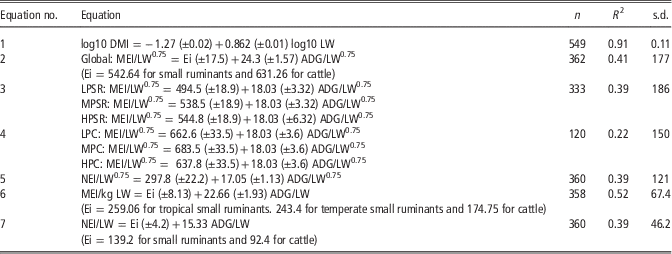
DMI=dry matter intake; MEI=metabolisable energy intake; LW=live weight; ADG=average daily gain; LPSR=low protein for small ruminants; MPSR=medium protein for small ruminants; HPSR=high protein for small ruminants; LPC=low protein for cattle; MPC=medium protein for cattle; HPC=high protein for cattle; NEI=net energy intake.
MEI and NEI are expressed in MJ/kg LW0.75/day or MJ/kg LW/day.
Energy requirements for maintenance and growth
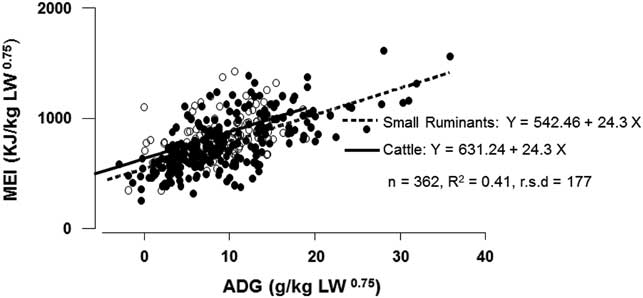
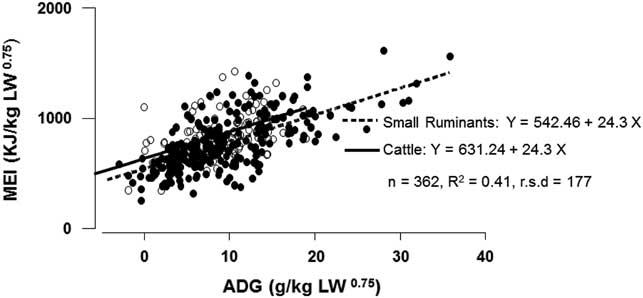
A first analysis showed that the difference between sheep and goats was not significant, and therefore their data were pooled. The results showed that the intercept for cattle was statistically different from the intercept of small ruminants, whereas the slopes were not different between the two groups. Ultimately, there was no influence of the genotype within species (Table 4, equation (2) and Figure 1). Moreover, the effect of protein level on energy requirement indicated that there was no significant difference between the three classes of protein, neither for the intercept (P>0.4) nor for the slope (P>0.22), for the three animal species, with significant difference between small ruminants and cattle only for the intercept (groups of equations (3) and (4), Table 4).
Relationship between metabolisable energy intake (MEI) and average daily gain (ADG) for small ruminants and cattle. The solid lines and closed circles are for small ruminants, and the dotted lines and open circles are for cattle.
The metabolisable energy concentration (MEC) of offered diets decreases with the measured ADG:
MEC (Mcal/kg DM)=2.04 (±0.03)+0.027 (±0.003) ADG/LW0.75 (n=359, R 2=0.30, r.s.d.=0.28)
ADG g/kg LW0.75=−6.91 (±1.82)+7.01 (±0.8) MEC kcal/kg DM (n=367, R 2=0.3, r.s.d.=5.35)
Logically, the NDF content of the diets is higher when ADG is lower:
NDF (%DM)=66.3 (±0.84) −1.44 (±0.072) ADG/LW0.75 (n=396, R 2=0.570, r.s.d.=9.3)
Thus, it appears that diets were not iso-energetic according to the corresponding ADG, showing that ADG variations were essentially linked to the dietary energy concentration of diets offered ad libitum. Consistently, when animal diets have lower energy density and/or high fibre content, they are likely to produce more heat during digestion because of increased chewing and physical gut work. Consequently, energy requirements should be better calculated in terms of net energy (NE) to be more independent of extra heat. Working from ME (kcal/kg DM), it is possible to calculate the metabolisability of the diets, Q=ME/GE, assuming a mean value of GE=4.4 Mcal/kg DM and NE for maintenance+fattening (NEmf) as in the INRA systems (INRA, 1989). There was no influence of species when inputs were expressed in NEmf as indicated in equation (5) (Table 4). Thus, we arrive at a common value for NE maintenance requirement of 297.8±22.2 kJ NEmf/kg LW0.75 and a common value for growth requirement of 417.5±1.13 kJ NEmf/g ADG.
To compare our results with similar proposals in the literature, we carried out analyses of variance on the data in Table 1 to assess the effects of species, genotypes and method (feeding trials, slaughter, calorimetry, reviews of meta-analyses obtained by feeding trials, published ME requirements tables). This produced 125 and 42 estimates of maintenance and gain requirements, respectively. For maintenance, there was a significant difference between cattle (529.2±12.6 kJME/kgLW0.75) and small ruminants (439.3±10.08 kJ ME/kg LW0.75) with no difference between sheep and goats and between genotypes. The comparison of our results (equation (2), Table 4) with data in Table 1 indicated that our maintenance requirement values were significantly higher for cattle (631.26±17.5 v. 529.2±12.6 kJ ME/kgLW0.75) as for sheep and goats (542.64±17.5 v. 439.3±10.08 kJ ME/kg LW0.75). Moreover, there was a trend (P<0.09) for an effect of method of requirements estimation (Table 1). Thus, for all species pooled, the lowest values were recorded for feed tables (432±34 kJ ME/kg LW0.75), whereas the highest values were recorded in the recent meta-analytic approaches (536±21 kJ ME/kg LW0.75). For requirement per unit ADG, there was no influence of any of the tested factors. The mean value was 23.1±7.26 kJ ME/kg ADG, which is close to our estimate of 24.3±1.57 kJ ME/kg ADG (equation (2)). A similar study performed on the basis of LW1 also found no difference between sheep and goats. The difference between cattle and small ruminants was significant, and the intra-species regression was given in equation (6) (Table 4). Thus, on a LW1 basis, maintenance requirements for energy appeared higher for tropical small ruminants (n=201) than for temperate small ruminants (n=51) and for small ruminants than for cattle (P<0.01). For cattle, there was no difference between genotypes (n=106). According to the power of the LW, ME requirement/kg ADG is slightly different (nonsignificant): 24.3±1.57 expressed on a LW0.75 basis and 22.66±1.93 on a LW1 basis. On the basis of NE intake, there was still a difference between small and large ruminants (Table 4, equation (7)).
Protein requirements for maintenance and growth
Requirements based on N retention
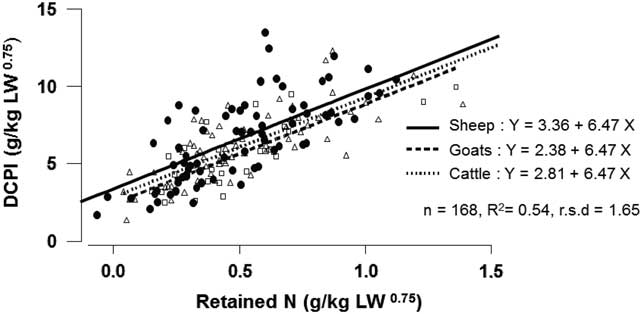
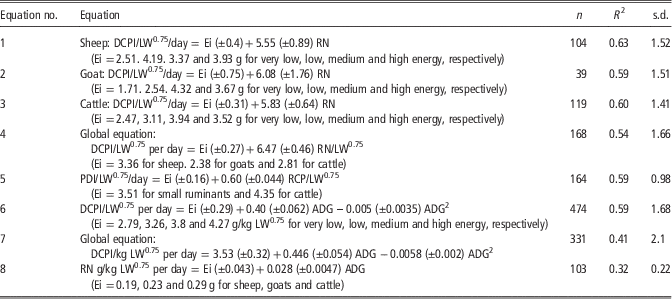
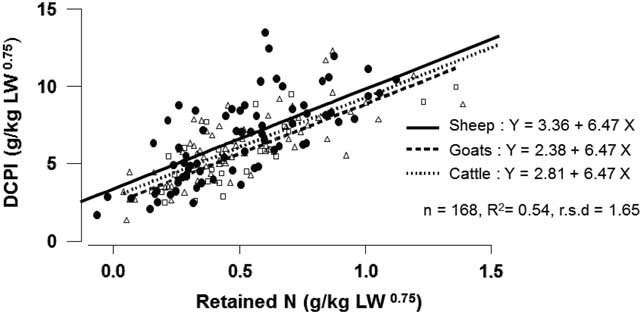
In the regression between DCPI (g/kg LW0.75) and retained nitrogen (RN), there was an effect of species as indicated in equation (4) (Table 5) with a high value for sheep (3.36±0.27), followed by cattle (2.81±0.27) and goats (2.38±0.27). Moreover, there was no influence of species on the slope of this equation, which represents a growth requirement equal to 40.43 g DCPI/g fixed CP (Figure 2). Pooling estimations of DCP requirements published in the literature (n=32 publications, Table 2) reveal, as for energy, large differences across studies and no influence of species on the intercept (2.93±0.57 g DCP/kg LW0.75). Overall, the method had no influence, but when results from meta-analysis were integrated (n=4) values became significantly higher (3.59±0.10 v. 2.81±0.28 for small ruminants and cattle, respectively).
Relationship between digestible CP intake (DCPI) and retained nitrogen (RN). Solid black lines and closed circles are for sheep; squares and dashed lines are for goats; triangles and dotted lines are for cattle.
Equations for prediction of protein requirements (g/kg LW0.75)
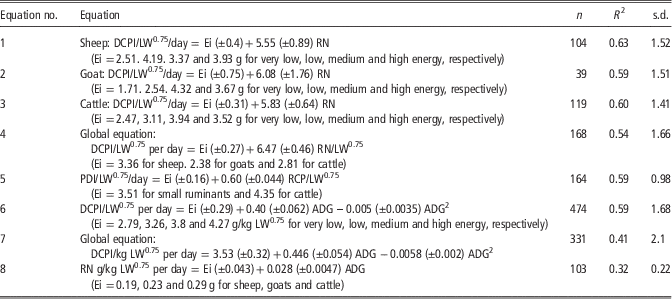
LW=live weight; DCPI=digestible CP intake; RN=retained nitrogen; PDI=protein in the intestine; RCP=retained CP; ADG=average daily gain.
The corresponding regression when the French digestible protein system (PDI) was used and when RN was expressed as retained CP (RCP) is given in equation (5) (Table 5) and the maintenance requirement in PDI (g/kg LW0.75) equalled 3.51±0.16 for both sheep and goats and 4.35±0.16 for cattle. Moreover, statistical analysis using the effect of energy level on DCP requirements indicated that there was no significant difference between energy level defined previously, neither on the intercept (P>0.2) nor on the slope (P>0.4), for the three animal species (equations (1), (2) and (3), Table 5).
Requirements based on ADG
There was no difference between species and genotypes for DCP requirement for maintenance (DCPm) (3.53±0.32 g DCPI/kg LW0.75). As the regression was not linear, the marginal DCP requirement/kg ADG (DCPg) decreased from 0.446 g DCP/kg ADG when ADG was close to 0.0 to 0.326 g DCP/kg ADG when ADG was 10 g/kg LW0.75 and to 0.206 g DCP/kg ADG when ADG was 20 g/kg LW0.75 (Table 5, equation (6)). Considering the published growth requirement values, the 15 data in Table 2 do not yield significant differences between species, genotypes and methods, and the common value is an intermediate 0.30±0.10 g DCPI/kg ADG. In addition, there was no significant difference between energy level on DCPm and DCPg, neither for the intercept (P=0.2) nor for the slope (P=0.23), for the three animal species (equation (7), Table 5).
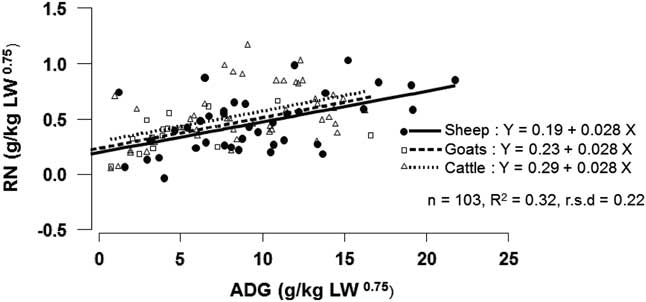
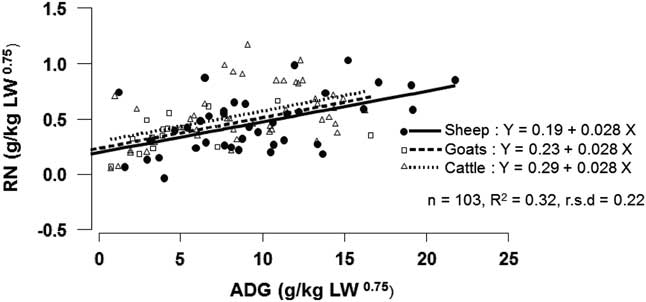
To explain certain differences between the two approaches, we studied the regression of RN on ADG. There was an influence of species on the constant of the relationship given in equation (8) (Table 5, Figure 3). Thus, at maintenance (ADG=0), a positive RN was obtained for the three animal species with a high value for cattle, goats and sheep. The value of the slope suggests that there was a gain of 17.5 g CP/100 g.
Relationship between retained nitrogen (RN) and average daily gain (ADG). Solid black lines and closed circles are for sheep; squares and dashed lines are for goats; triangles and dotted lines are for cattle.
Relationship between energy and protein requirement
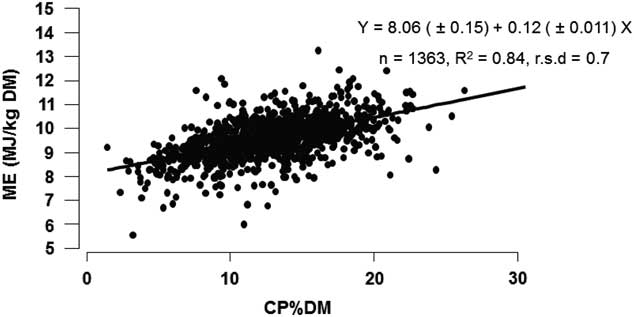
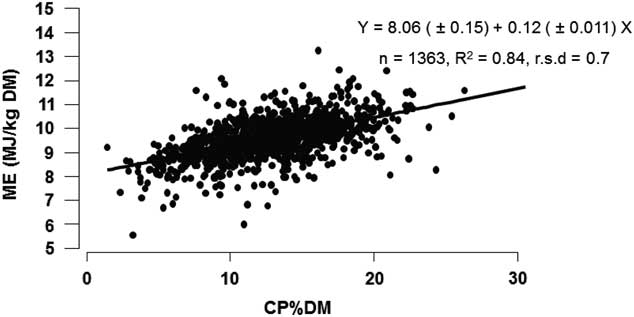
As illustrated in Figure 4, there was a fairly high positive correlation between CP levels and ME supplied. This correlation, which is the outcome of the calculations of all the diets that were made to cover a given level of requirements in each publication, shows that a meta-design does not separate energy and protein aspects, knowing that ADG and NR were more correlated with energy than with protein supplies. Therefore, energy appears globally more limiting than protein.
Relationship between metabolisable energy (ME) and CP content of the rations.
Discussion
Our work does carry some limitations because of the data available. Thus, as no publications have compared temperate and warm genotypes together, the genotype comparison had to be studied across publications, which is not a very effective procedure. Moreover, the number of data with body composition was too low to take this aspect into consideration precisely. Indeed, it is known that, for the same gain, protein and energy cost may be different depending on the body composition (Galvani et al., Reference Galvani, Pires, Kozloski and Wommer2008). We tried to take into account this aspect indirectly by comparing animal sexes, growth potential and ages without any effect on requirements for the three animal species. However, some previous studies such as NRC (2000) and that by Luo et al. (Reference Luo, Goestch, Sahlu, Nsahlai, Johnson, Moore, Galyean, Owens and Ferrell2004a) suggested greater requirements for intact males compared with females and male castrates. Moreover, the effect of age is not well studied, but some findings with ruminants indicated decreasing requirements with age (Luo et al., Reference Luo, Goestch, Sahlu, Nsahlai, Johnson, Moore, Galyean, Owens and Ferrell2004a).
Energy requirement for maintenance and growth
A limit of this work is that ME, in all probability, is not the energy type best suited to assessing the actual energy value of feeds and fibre-rich diets. Most European energy systems are effectively built on the proposals of Van Es (Reference Van Es1972) showing that the efficiency of conversion (k) of ME to NE was closely and positively linked to the ratio Q=ME/GE, or dietary ME/kg DM, which is closely linked to OMD. Consequently, for cell wall-rich low-ME/kg DM diets, which are more frequent when observations are closer to low performance levels in our database, the difference between ME and NE is more important. Consequently, higher losses of energy as extra heat can be expected when diets are given to low-performing animals. This effect was confirmed by equations linking ADG to ME/DM or NDF% DM. However, net energy systems, which a priori would appear better suited, are far from standardised worldwide and are often based on equations with unknown accuracy. Nevertheless, we ran calculations on NE combining maintenance and growth, in line with French practice, and the species differences disappeared on the LW0.75 basis.
Influence of measurement method
In general, maintenance requirements depend on production type, such as lactating or dry female, and requirements estimated from productive animals during feeding trials are higher than those recorded for animals fed at or below maintenance as in the calorimetric method (Paul et al., Reference Paul, Mandal, Mandal, Kannan and Pathak2004). During feeding trials, the animal passes through several physiological stages, each of which consumes more or less dry matter and energy, thus affecting the maintenance needs (Mandal et al., Reference Mandal, Paul, Mandal, Kannan and Pathak2005). Our analysis of published data (Table 1) to compare methods confirms these tendencies. As a general rule, low energy supplies were more frequently obtained by experimentally limiting supply than by giving cell wall-rich feed. This difference can partly explain the fairly high values obtained here, although we believe our approach provides maintenance requirement values that are more relevant to operational practice for ruminants receiving poor diets.
Influence of species and intra-species genotypes
The ranking between cattle and small ruminants is directly linked to the value of the power of LW. When ME was expressed on a LW0.75 basis, cattle had significantly higher MEm compared with small ruminants. In contrast, when ME was expressed on a LW1 basis, small ruminants had higher MEm than did cattle. The choice of exponent 0.75 and 1 is relevant to compare species. Otherwise, on using 0.86 as the exponent, the difference between species disappears.
Our estimates of the ME requirements of tropical ruminant livestock are higher than the published values for either tropical or temperate genotypes. Hence, Paul et al. (Reference Paul, Mandal, Mandal, Kannan and Pathak2003) estimated ME requirement for Indian sheep and cattle at 533 and 596 kJ/kg LW0.75, respectively. However, Mandal et al. (Reference Mandal, Paul, Mandal, Kannan and Pathak2005) and Luo et al. (Reference Luo, Goestch, Sahlu, Nsahlai, Johnson, Moore, Galyean, Owens and Ferrell2004a) estimated the ME requirement for goats at 453 and 487 kJ/kg LW0.75, respectively. When ME was expressed on a LW1 basis, tropical small ruminant genotypes had higher ME compared with temperate small ruminant genotypes. The NRC (2007) indicated that there was no general comparison available for small ruminants between intensive-farmed genotypes and genotypes in developing countries. More precisely, for goats, Luo et al. (Reference Luo, Goestch, Sahlu, Nsahlai, Johnson, Moore, Galyean, Owens and Ferrell2004a) were unable to detect genotype (indigenous mature and dairy goats) influence on MEm. For cattle, the lack of significant difference in MEm and MEg between genotypes may be due to the small number of data on temperate genotypes used in this data set. Tropical genotypes, which are not generally selected for muscle deposition, tend to be fatter than temperate genotypes, and consequently the energy cost of LW gain (MEg) is higher (Early et al., Reference Early, Mahgoub and Lu2001).
Influence of environmental conditions and feeding levels
Under high temperature conditions, the energy required to dissipate body heat increases, which can raise the energy requirement of the animal (Commonwealth Scientific and Industrial Research Organisation (CSIRO), 2007). Fibrous diets generally increased heat production, visceral energy consumption, energy costs of intake and chewing, energy expenditure and consequently ME requirements (Goetsh et al., Reference Goetsh, Patil and Galloway1997). The high values of energy requirements obtained can be attributed to the high rates of metabolism in visceral organs and tissues during growth, which increases their maintenance costs compared with full-grown animals (CSIRO, 1990).
LW gain requirements
The energy requirement for 1 g ADG was estimated to be 24.3 kJ ME (Table 4). This estimate is inside the range of values published in the literature (13.73 to 27.9) for Indian sheep, goat and cattle (Paul et al., Reference Paul, Mandal, Mandal, Kannan and Pathak2003 and Reference Paul, Mandal, Mandal, Kannan and Pathak2004; Mandal et al., Reference Mandal, Paul, Mandal, Kannan and Pathak2005). It is also inside of the range of published values attributed to temperate animals. The NRC (1989), NRC (1981 and 2001) and INRA (1989) have published values of 20.62, 30.28 and 31.5 for sheep, goat and cattle, respectively. Methods used, livestock genotypes, animal age and consequently body composition could explain these variations (Rohr and Daenicke, Reference Rohr and Daenicke1984).
Protein requirements for maintenance and growth
Two approaches were applied to estimate protein requirements. The method that emerged here as being the most accurate is based on N retention data. Unfortunately, the number of data obtained with this method is fairly limited compared with growth-based predictions. Moreover, N balance studies can also lead to biases of overestimation of N retention (Spanghero and Kowalski, Reference Spanghero and Kowalski1997).
Protein requirements based on N retention
DCP requirement estimates for maintenance are 3.36, 2.38 and 2.81 g/kg LW0.75 for sheep, goat and cattle, respectively. These values fall within the range of published values (1.96 to 4.43 g/kg LW0.75) on tropical-genotype livestock under warm climates but are higher than those published on temperate-genotype livestock under temperate climates. In fact, the range of variation of published data for tropical goats is 0.74 to 3.83 g DCP/kg LW0.75 (Sengar, Reference Sengar1980; Akinsoyinu, Reference Akinsoyinu1985). For temperate goat genotypes, DCP maintenance requirements have been estimated at 2.82 g and 2.13 g/kg LW0.75 by the NRC (1981) and the INRA (1989), respectively. However, the estimated value for cattle (2.81 g/kg LW0.75) is 12% less than the INRA value of 3 g/kg LW0.75 for large and dairy cattle and the Standing Committee on Agriculture (1990) value of 3.2 g/kg LW0.75, but is closest to the 2.84 g/kg LW0.75 proposed by Van Es (Reference Van Es1972). Differences between temperate and tropical genotypes can be attributed to the lower growth potential of tropical genotypes. Gihad (Reference Gihad1976) obtained a value of 1.95 g/kg LW0.75 for tropical sheep. The differences can be attributed to the different body composition between adult and growing animals.
Protein requirements were also expressed according to the MP system (INRA, 1978; NRC, 1981) using equation (5). The regression of MP to RN resulted in values of 3.51 for small ruminants and 4.35 for cattle. The MP requirements for small ruminants (2.65 and 2.2 g/kg LW0.75 for both sheep and goats) proposed by the INRA (1980), and the value of 2.19 given by Agricultural and Food Research Council (AFRC, 1998) for goats, are much lower than our estimate. Medeiros (Reference Medeiros2001) and Ferreira (Reference Ferreira2003) reported lower values for Saanen kids (1.31 and 2.16 g/kg 0.75 BW, respectively), whereas Luo et al. (Reference Luo, Goestch, Nsahlai, Sahlu, Ferrell, Owens, Galyean, Moore and Johnson2004b) reported higher values for Angora (3.35 g/kg LW0.75), meat, dairy and indigenous (3.07 g/kg LW0.75) goats. The recommendations of 2.87 and 2.39 g MP/kg LW0.75 attributed, respectively, by AFRC (1993) and CSIRO (1990) are lower than our estimates for sheep. The value obtained for cattle (4.35 g MP/kg LW0.75) is higher than some previous results. Veras et al. (Reference Veras, Valadares Filho and Azevedo2008) obtained a value of 4.03 g/kg LW0.75 for MPm. Our result was higher than the values of 3.8 and 3.25 g/kg LW0.75 adopted by NRC (2000) and INRA (1980), respectively. The high values for MP requirements found here are likely the outcome of two factors. The first factor is that we opted for PDIE feed values (assuming energy is limiting in the rumen), which are higher than PDIN values (assuming protein is limiting in the rumen) and thus assumes that N recycling is sufficient to entirely restore the N deficit. The second factor was the simultaneous effects of energy levels and protein levels and the fact that energy appeared more limiting as it better explains variations in ADG or RN.
The high protein requirement for maintenance obtained can be attributed to the high rates of metabolism in visceral organs and tissues during growth, which increases their maintenance costs compared with fully grown animals (CSIRO, 1990). It is known that there is a direct relationship between the rate of protein synthesis and the metabolic rate of animals of different species (Waterlow, Reference Waterlow1968) and that rates of protein synthesis are higher in young growing animals than in adults (Connors et al., Reference Connors, Poppi and Cant2008). Many estimates of MP requirements for gain have been derived by separate prediction of protein concentration in BW gain, resulting in a wide range of MP requirements for gain. Differences in MP requirements are effectively attributable to diet quality. Animals given diets composed of poor-quality roughage are likely to have low N retention and high protein requirement.
Requirement based on ADG
The estimated DCP maintenance requirement of 3.53 g/kg LW0.75 is inside the range of values (1.96 to 4.43 for sheep; 2.12 to 3.90 for goat; 2.73 to 3.51 for cattle) for tropical breeds. Published values for temperate livestock range from 2.16 to 3.2 for sheep, from 2.13 to 3.19 for goat and from 2.78 to 3.00 for cattle (Table 2).
The slightly higher published estimates for tropical v. temperate animals could be partly explained by environmental factors (temperature, diets). Fibre content, positively correlated to protein requirement for maintenance and protein requirement, is also reported to increase with increasing ratio of roughage to concentrate (Goetsh et al., Reference Goetsh, Patil and Galloway1997). High temperature has been associated with increased requirement of absorbed amino acids for growth in ruminants (Bunting et al., Reference Bunting, Sticker and Wosniak1992). Comparing the two approaches (N retention v. ADG), we hypothesise that the higher requirements reported for the ADG method can be explained by the fact that positive nitrogen retention can be observed at ADG=0, which may be due to the recycling of nitrogen necessary for tissue regeneration. The protein requirement for gain is estimated at 0.30 g DCP/g gain, but is curvilinear depending on animal growth (from 0.44 when ADG is close to 0 to 0.206 when ADG is 20 g/kg LW0.75). The curvilinear response of protein requirements with ADG probably reflects the biological phenomena tied to the body composition of growing animals (water, fat, etc.). Overall, protein requirements decrease to an average growth level of ~20 g/kg LW0.75, which corresponds to the peak growth potential recorded with tropical ruminant livestock. Beyond this potential, growth is enriched with lipids, which decreases protein retention per unit of growth (Byers, Reference Byers1982).
Globally, our estimates tend to be slightly higher than previous published estimates for temperate ruminants. These results could be explained by leaner body growth in temperate genotypes. Our estimates fall within the published range for tropical ruminant livestock – that is, 0.26 to 0.31, 0.17 to 0.34 and 0.19 to 0.45 for sheep, goat and cattle, respectively.
Animals reared under normal experimental conditions in a feeding trial that coincides more with real feeding practices (animals in batches, feed distributed ad libitum or restricted) show more intensive or less metabolism and protein turnover due to animal activity (McDonald et al., Reference McDonald, Edward and Greenhalgh1995). Hence, estimates of energy and protein requirements reported from analysis of intake v. growth performance are likely to be slightly higher than the values reported for balance trials and respiration calorimetry used in other international systems for feeding standards.
Conclusion
This study based on feeding and digestive trials including a large diversity of diets and animal genotypes representative of tropical and warm areas provides updated values for maintenance and growth requirements. Species ranking is dependent on the power coefficient of LW. The main conclusion of this study is the higher energy and protein requirements of tropical and warm-area ruminants compared with those proposed in the international feed system standards such as the NRC, ARC, INRA and AFRC tables. Moreover, we found little or no differences between species.
Acknowledgements
This work was partly funded by SYSTALI project of the National Institute of French Agricultural Research (INRA).