Implications
The identification of individuals’ breed/population of origin offers unbiased tools in livestock and is useful in different biological contexts, such as management of livestock genetic resources for breed confirmation and estimation of hybridization level, and authentication of typical products. The identified single nucleotide polymorphisms (SNPs) may constitute a starting point for the development of a SNP based identification test as a tool for breed assignment and traceability of animal products.
Introduction
Assignment tests using genetic information to establish population membership of individuals provide the most direct methods to determine population of origin of unknown individuals (Negrini et al., Reference Negrini, Nicoloso, Crepaldi, Milanesi, Colli, Chegdani, Pariset, Dunner, Leveziel, Williams and Ajmone Marsan2009). The identification of individuals’ breed/population of origin offers has several practical applications in livestock and is useful in different biological contexts, such as management of livestock genetic resources for breed confirmation, estimation of hybridization level and authentication of brand products that are produced using only a few particular breeds or populations (Wilkinson et al., Reference Wilkinson, Wiener, Archibald, Law, Schnabel, McKay, Taylor and Ogden2011; Bertolini et al., Reference Bertolini, Galimberti, Calò, Schiavo, Matassino and Fontanesi2015). Moreover, assignment of individuals to a specific breed is very important both for biodiversity purposes and products traceability, especially when the phenotypic differentiation among breeds is difficult (Tolone et al., Reference Tolone, Mastrangelo, Rosa and Portolano2012).
Recently developed genomic technologies, such as medium and high-density SNP arrays, are important tools that can be used for these purposes. Dense genome-wide data is valuable but is relatively costly and time-consuming or computationally expensive to analyse. However, some methods are tractable and capable to efficiently predict breed composition using breed frequencies of thousands of markers (Kuehn et al., Reference Kuehn, Keele, Bennett, McDaneld, Smith, Snelling, Sonstegard and Thallman2011). Therefore, it is often desirable to reduce the number of markers according to their information content, in order to create reduced panels for population genetic analysis (Paschou et al., Reference Paschou, Ziv, Burchard, Choudhry, Rodriguez-Cintron, Mahoney and Drineas2007). Many clustering algorithms have been developed employing population genetic data to assign individuals to clusters (Jakobsson and Rosenberg, Reference Jakobsson and Rosenberg2007). Several statistical methods were used to determine which genetic markers contain the most information to discriminate among populations (Rosenberg, Reference Rosenberg2005; Wilkinson et al., Reference Wilkinson, Wiener, Archibald, Law, Schnabel, McKay, Taylor and Ogden2011), such as the combined approach of principal component analysis (PCA) and random forest (RF) (Bertolini et al., Reference Bertolini, Galimberti, Calò, Schiavo, Matassino and Fontanesi2015), multivariate canonical discriminant analysis (Dimauro et al., Reference Dimauro, Cellesi, Steri, Gaspa, Sorbolini, Stella and Macciotta2013), the statistic delta (Shriver et al., Reference Shriver, Smith, Jin, Akey, Deka and Ferrell1997), and Wright’s F st (Bowcock et al., Reference Bowcock, Ruiz-Linares, Tomfohrde, Minch, Kidd and Cavalli-Sforza1994). While all these methodologies yielded reduced marker panels useful for breed identification, the power of assignment varied among analysis methods.
In the present study, starting from available high-throughput SNP data, penalized multinomial regression (PMR) and stability selection (SS) were applied to identify the optimal set of informative SNPs useful to discriminate among five Sicilian dairy sheep breeds.
Material and methods
Data
A total of 236 animals, randomly collected from several farms in different areas of Sicily, were used for the analysis. Samples consisted of 30 Barbaresca (Bar), 51 Comisana (Com), 77 Pinzirita (Pin), 30 Sarda (Sar) and 48 Valle del Belice (VdB) individuals. The procedures involving animal samples collection followed the recommendation of Directive 2010/63/EU. All animals were genotyped for 54 241 SNPs using the Illumina OvineSNP50K Genotyping BeadChip. Genotyping was performed by Dipartimento Scienze Agrarie e Forestali, University of Palermo. Input data were genotyping data of 54 241 SNPs, that is GType data in Illumina AB format exported from GenomeStudio v1.0 (Illumina Inc., San Diego, CA). We excluded all SNPs not assigned to chromosome (OAR) or assigned to X and Y chromosomes. Markers were filtered according to the following quality criteria: (i) call frequency (⩾95%), (ii) minor allele frequency (MAF⩾0.01). SNPs that did not satisfy these quality criteria were excluded. A total of 48 068 SNPs were retained for subsequent analyses.
We transformed the genotyping data to numeric values, without any loss of information, in order to apply PMR. The initial data table X consisted of N rows, one per animal, and p columns, one per SNP. Each entry of X , AA, AB and BB, was scored as −1, 0, 1, or empty. SNPs with missing genotypes were randomly imputed within each breed according to the corresponding genotype frequency.
Statistical analysis of single nucleotide polymorphisms and variable reduction
Each sheep breed was divided into a test population and a validation population. The validation population, generated by randomly sampling 15% of animals within each breed, was used for the final validation procedure of breed assignment. The test population consisted of the remaining animals.
Suppose to have a set of N individuals and p SNPs, with p»N, divided in K groups, the main goal in a high-dimensional setting was the selection of a limited number of SNPs with a high discrimination power among groups. To achieve this aim some authors proposed the LASSO method (Tibshirani, Reference Tibshirani1996) or L
1-penalty, a shrinkage and selection method for linear regression. In statistics, least absolute shrinkage and selection operator (LASSO) is a regression analysis method that performs both variable selection and regularization in order to enhance the prediction accuracy and interpretability of the statistical model it produces. LASSO is able to achieve these goals by forcing the sum of the absolute value of the regression coefficients to be less than a fixed value, which forces certain coefficients to be set to zero. LASSO was originally introduced in the context of least squares. Consider a sample consisting of N observations, each of which consists of p covariates and a single outcome. Let y
i
be the outcome and
 ${\mib{x}} _{i} {\equals}\left( {x_{1} ,x_{2} ,\,\ldots\,,x_{p} } \right)^{T} $
be the covariate vector for the ith observation. Than the objective of the LASSO is to solve
 $$\mathop{{\min }}\limits_{{\beta _{0} ,{\mib{\bibeta }} }} \left\{ {{1 \over N}\mathop \sum\limits_{i{\equals}1}^N \left( {y_{i} {\minus}\beta _{0} {\minus}{\mib{x}} _{i}^{T} {\mib{\bibeta }} } \right)^{2} } \right\}{\rm subject}\,{\rm to}\mathop \sum\limits_{j{\equals}1}^p \left| {\beta _{j} } \right|\leq t,$$
where t is a prespecified free parameter that determines the amount of regularization, β
0 is the intercept of the model and
β
is the p-variate vector of regression coefficients. Letting
X
be the covariate matrix, so that
 ${\mib{X}} _{{ij}} {\equals}\left( {{\mib{x}} _{i} } \right)_{j} $
and
 ${\mib{x}} _{i}^{T} $
is the ith row of
X
we can write this in the so-called Lagrangian form
 $$\mathop{{\min }}\limits_{{{\mib{\beta }} \in{\Bbb R}^{{p{\plus}1}} }} \left\{ {{1 \over N}||y{\minus}{\mib{X\bibeta }} ||_{2}^{2} {\plus}\lambda ||{\mib{\bibeta|| }} _{1} } \right\}$$
where the relationship between t and λ is t≈λ −1, that is t is approximately the multiplicative inverse of λ. The L 1 norm of β is a constraint on the regression coefficients that strictly depends on the tuning parameter λ.
LASSO regression originally defined for least squares, is easily extended to a wide variety of statistical models including generalized linear models. In our framework, given the nature of the outcome y, that is a categorical variable with K>2 levels, we used a penalized multinomial regression. Here, we model the probability to belong to breed k given the SNPs’ matrix X of dimension N×p
 $${\rm Pr}\left( {y{\equals}k\,\mid\,{\mib{X}} } \right){\equals}{{e^{{{\mib{X\bibeta }} _{{\mib{k}} } }} } \over {\sum_{l{\equals}1}^K e^{{{\mib{X\bibeta }} _{l} }} }},\,k{\equals}1,\,\ldots\,,{\rm }K.$$
Let the outcome
y
be the N×K indicator response matrix, with elements
 $y_{{il}} {\equals}I\left( {y_{i} {\equals}l} \right), \:l{\equals}1,\,\ldots\,, \:K {\rm and} i{\equals}1,\,\ldots\,, N$
. Then the regression coefficients are obtained as the solution of the following optimization problem
 $$\eqalignno{& \mathop{{\max }}\limits_{{{\mib{\bibeta }} \in{\rm }{\Bbb R}^{{k\left( {p{\plus}1} \right)}} }} \left\{ {{\minus}{1 \over N}\mathop \sum\limits_{i{\equals}1}^N \left( {\mathop \sum\limits_{l{\equals}1}^K y_{{il}} {\mib{X\bibeta }} _{l} {\minus}\log \left( {\mathop \sum\limits_{l{\equals}1}^K e^{{{\mib{X\bibeta }} _{l} }} } \right)} \right)\mathop \mathop } \right\cr &\qquad \quad \left{\plus}\lambda \mathop \sum\limits_{j{\equals}1}^p \mathop \sum\limits_{l{\equals}1}^K \left| {\beta _{{jl}} } \right|} \right\}$$
where
β
is a
 $p{\times}K$
matrix coefficients,
β
k
refers to the k-th column (for outcome breed k), and
β
j
the j-th row (vector of K coefficients for variable j).
In this step, as usual for the supervised classification approach y, that is the true vector of labels of breeds, is set as response variable.
All the following analysis was computed using glmnet package (Friedman et al., Reference Friedman, Hastie and Tibshirani2010) of the R software 3.3.0 (R Core Team, 2016).
The stability selection method (Meinshausen and Bühlmann, Reference Meinshausen and Bühlmann2010) was used to discover the best subset of variables S stable that will have nonzero weight in the model. Let’s assume that we have a generic structure estimation algorithm (i.e. the LASSO) that takes a data set X and a regularization parameter λ, it returns a selection set S λ . The j-th covariate belongs to S λ if the regression coefficient β j ≠0.
The SS algorithm then runs as follows:
1. Define a candidate set of dimension m of regularization parameters
 ${\rm \Lambda }{\equals}\left\{ {\lambda _{1} ,\,\ldots\,, \lambda _{m} } \right\}$
and a number n of subsample.
2. For each value of λ∈Λ, do:

a. Start with the full data set X
b. For each i=1, … ,n do:
i. Subsample from X without replacement to generate a smaller data set of size N/2, namely Z i .
ii. Run the selection algorithm on dataset Z i with parameter λ to obtain a selection set
$ S_{i}^{\lambda } $
.

c. Given the n selection sets from each subsample, calculate the empirical selection probability for each covariate:
 $${\rm \Pi }_{{\rm j}}^{\lambda } \, {\equals}\, P\left\{ {j\!\in\!S_{i}^{\lambda } } \right\}\, {\equals}\, {1 \over n}\mathop \sum\limits_{i\, {\equals}\, 1}^n I\left\{ {j\!\in\!S_{i}^{\lambda } } \right\},{\rm }j\, {\equals}\, 1,{\rm }\,\ldots\,,{\rm }p{\rm }$$
The selection probability for covariate j is its probability of being selected by the algorithm.
3. Given the selection probabilities for each covariate and for each value of λ∈Λ, construct the stable set according to the following definition:
 $$\hat{S}^{{{\rm stable}}} \, {\equals}\, \left\{ {j \,\colon\, \mathop{{\max }}\limits_{{\lambda \in{\rm \Lambda }}} {\rm \Pi }_{{\rm j}}^{\lambda } \geq \pi _{{thr}} } \right\}$$
where π thr is a predefined threshold.
In our study, fixing a sequence of 100 values of λ, step 2.(b) was repeated B times by randomly splitting, within each breed, the test population. After calculating the empirical selection probability for each SNP and fixing the threshold value, a final set S stable of p 1 SNPs was selected. For this reduced panel, a new multinomial regression model was then fitted. To assess the classification performance of this set of p 1 SNPs we tested the discrimination rule using the validation population which is considered to be an independent subset of samples.
Other statistical and genetic methods
To better understand the potential of our strategy and the strength of a reduced panel of SNPs we decided to use the k-means approach, which is an unsupervised technique. In particular, we used all the principal components up to 70% of explained variance of the model matrix X . We applied this technique once to the whole set of SNPs and once to the reduced set p 1.
The efficiency of the selected markers to cluster individuals was also tested using model-based clustering algorithm implemented in the admixture software 1.3.0 (Alexander and Lange, Reference Alexander and Lange2011) which used unsupervised classification approaches and Genepop software 4.1.4 (Rousset, Reference Rousset2008) to calculate F st. The most probable number of populations in the data set (K) was estimated using the default (fivefold) admixture’s cross-validation procedure, by which estimated prediction errors are obtained, for each K value, by adopting a kind of ‘leave-one-out’ approach through which an estimation of prediction errors can be assumed to be the most suitable one. Genepop was also used to estimate population relatedness using pairwise estimates of F st among breeds. The reduced panel was analysed using SNPchiMp (Nicolazzi et al., Reference Nicolazzi, Caprera, Nazzicari, Cozzi, Strozzi, Lawley, Pirani, Soans, Brew, Jorjani, Evans, Simpson, Tosse-Klopp, Brauning, Williams and Stella2015) to obtain information on the genomic distribution of SNPs.
In order to compare our approach to those previously reported, another mixed strategy was considered (Bertolini et al., Reference Bertolini, Galimberti, Calò, Schiavo, Matassino and Fontanesi2015). In particular, PCA and RF was used to discover a new SNP panel able to discriminate among the breeds For each autosome, the top 20 SNPs were selected and merged together, leading to a final panel of 520 markers. Random forest based on the selected 520 SNPs were built on the test population. The mean decrease in the Gini index (MDGI) or the mean accuracy decrease (MAD) were used in order to select the most discriminant SNPs. Four different SNP panels were created selecting the first 48 and 96 SNPs from the MDGI and the first 48 and 96 from the MAD, respectively. This SNP panels’ size was chosen considering the practical possibilities to develop multiplex SNP panels containing a reduced number of SNPs for field applications (Bertolini et al., Reference Bertolini, Galimberti, Calò, Schiavo, Matassino and Fontanesi2015). For each of the four reduced panels, a new RF was fitted and the corresponding out-of-bag (OOB) error rate was calculated. Classification performance of these four RFs was assessed also using the validation population.
A simulation study has been done to compare the performance of our proposed strategy and the PCA-RF strategy. A group of genetic variants has been randomly generated by using the real data set. In general, we sampled with replacement n observations of the real data set, so to maintain the same structure and association between SNPs. Moreover, we built
 $\tilde{\mib{{X}}} _{{{\rm test}}} $
which is the simulated test population and
 $\tilde{\mib{{X}}} _{{{\rm val}}} $
which is the simulated validation population (15% of the sample size). The response variable
 $\tilde{y}$
was the label vector of length n, indicating the membership of each animal to their own breed in the simulated data.
 $\tilde{\mib{{X}}} _{{{\rm test}}} $
and
 $\tilde{\mib{{X}}} _{{{\rm val}}} $
were used to evaluate the out-of-bag error and misclassification error rate for both strategies.
Results
Penalized multinomial regression and stability selection
Out of a total of 54 241 genotyped SNPs, 378 unmapped and 1450 were located on sex chromosomes. Thus, 52 413 SNPs mapped onto 26 sheep autosomes were used, and after filtering (see Material and Methods), the final number of common SNPs was 48 068. On these SNPs, PMR and SS procedure, with B=500, have been performed to select the most informative markers obtaining a final small set of 48 SNPs.
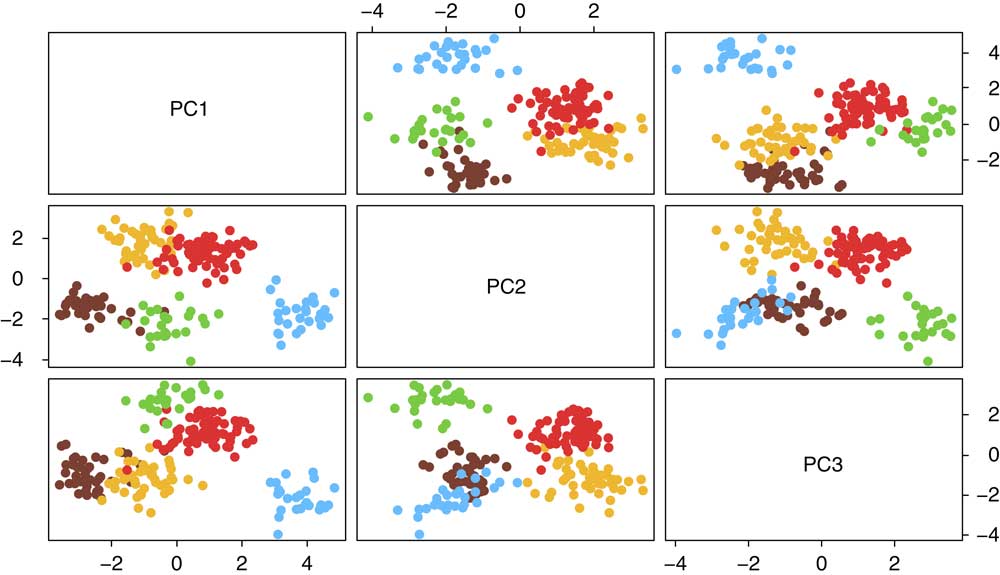
Figure 1 shows the 201 animals of the test population in the subspace defined by the first three principal components calculated on these 48 SNPs. A plot of the 201 animals of the test population in the subspace defined by the first three principal components calculated on 48 068 SNPs is shown in Supplementary Material Figure S1. This allowed an assessment of whether the reduced SNP panel leads to loss of important genetic information which is relevant to explain the differences among breeds. Figure 1 shows partial overlaps of historically and phylogenetically related breeds (Mastrangelo et al., Reference Mastrangelo, Sardina, Riggio and Portolano2012 and Reference Mastrangelo, Di Gerlando, Tolone, Tortorici, Sardina and Portolano2014; Tolone et al., Reference Tolone, Mastrangelo, Rosa and Portolano2012) and the difficulty in separating them. To analyse the structure of each cluster, we used the standard deviations as a measure of spread within each breed in the first three principal components. We observed a standard deviation average of about 0.65 for each principal component. Using this SNP panel, the corresponding misclassification error rate both for test and validation population was equal to 0%.
Plot of the first three principal components obtained using the panel of 48 single nucleotide polymorphisms (coded as genotype), selected after the first step with the penalized multinomial regression and stability selection procedure.  =Valle del Belice (VdB),
 =Comisana (Com),
 =Pinzirita (Pin),
 =Barbaresca (Bar),
 =Sarda (Sar).

The unsupervised strategy which consists of the combination of PCA and k-means also provide excellent results. Using the first 15 principal components, which are highly correlated (>0.50) with 31 SNPs, and explaining 70% of total variability, we miss only one individual to perfectly discriminate the five breeds involved in the study. A cluster plot is shown in Supplementary Material Figure S2.
Moreover, using the whole set of SNPs and applying the same unsupervised strategy we again missed only one individual. In this case, 112 principal components, which are highly correlated (>0.50) with 608 SNPs, are used in the k-means step.
Random sampling of single nucleotide polymorphisms
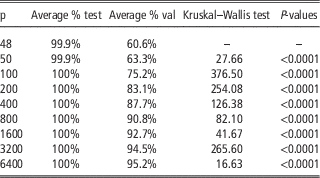
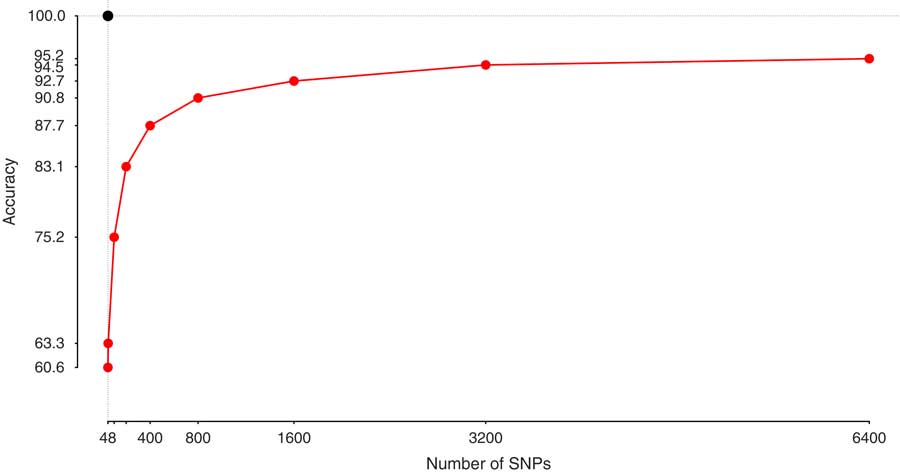
In order to assess the ability of these 48 selected SNPs to efficiently discriminate among the sheep breeds, a simulation was performed. Another sets of 48 SNPs were randomly sampled 500 times from the whole set of SNPs and the average of accuracy for classification in the validation population was about 60%. Repeating this procedure, sampling different numbers of SNPs (i.e. 50, 100, 200, 400, 800, 1600, 3200, 6400), the accuracy for classification was tested using a Kruskal–Wallis rank sum test (Kruskal and Wallis, Reference Kruskal and Wallis1952), to evaluate if any increment in accuracy was significant. These results are shown in Table 1.
Simulation results of accuracy for classification both in test and validation population (based on 500 runs) after randomly sampled different number of single nucleotide polymorphisms from the whole set

The last two columns are Kruskal–Wallis test and P values.
Figure 2 shows the strength of the selected panel of 48 SNPs to discriminate across all the breeds, and the difficulty to perfectly discriminate among them using a large set of SNPs. Moreover, the Kruskal–Wallis test results were significant for each increment after sampling even more SNPs (Table 1).
Plot of the mean accuracy to classify among the five breeds after repeating, for different number of single nucleotide polymorphisms (SNPs), a random sampling procedure from the whole set of available SNPs. Black dot is the accuracy level of the selected 48 SNP panel.

Penalized multinomial regression and stability selection v. principal component analysis and random forest
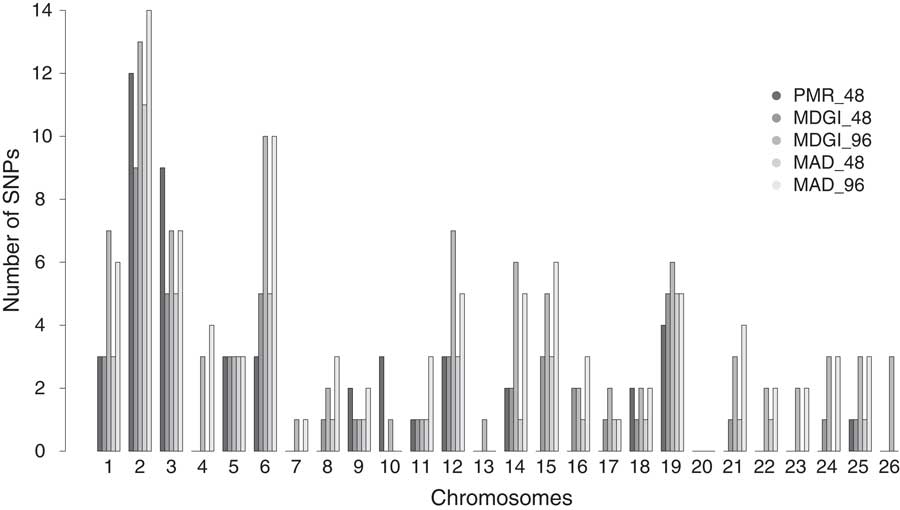
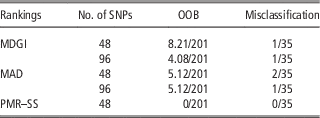
Penalized multinomial regression and stability selection procedure is a new strategy used for assigning animals to a breed. In order to compare our approach with other previously reported strategies and to test its efficiency in assigning individuals, PCA and RF strategy (Bertolini et al., Reference Bertolini, Galimberti, Calò, Schiavo, Matassino and Fontanesi2015) were also used with the real data. With respect to the two first ranking SNP panels (MDGI and MAD for 48 and 96 SNPs), the OOB errors in the test population were 4.09% and 2.03%, respectively, while the misclassification error rates for the validation population were both 2.86%. In the second ranking, the OOB errors for the test population were 2.55% for the 48 SNP panel and 2.55% for the 96 SNP panel, whilst the misclassification error rates are 5.71% and 2.86%, respectively. These results were summarized in Table 2. Figure 3 shows the distribution of the 48 selected SNPs along the 26 chromosomes, and the four SNPs panels obtained through PCA and RF procedure; 15 and 13 SNPs out of 48 are the same as in two 48 rankings MDGI and MAD, respectively.
Chromosome distribution of the single nucleotide polymorphisms (SNPs) selected according to the proposed strategy, penalized multinomial regression and stability selection (PMR–SS), and whom according the two panels of mean decrease in the Gini index (MDGI) and the two panels of mean accuracy decrease (MAD).

Out-of-bag (OOB) errors on the test population and misclassification error rates on the validation population for the two single nucleotide polymorphism panels and the two rankings, mean decrease in the Gini index (MDGI) and mean accuracy decrease (MAD) and for the mixed strategy penalized multinomial regression and stability selection (PMR–SS)

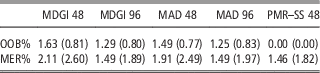
To compare PMR–SS and PCA-RF strategies in more depth, we performed a simulation study. We artificially built, 300 times, test (
 $\tilde{\mib{{X}}} _{{{\rm test}}} $
) and validation (
 $\tilde{\mib{{X}}} _{{{\rm val}}} $
) population sampling with replacement the observation of the real data set (
X
). For each replicate, OOB and misclassification error rates were calculated according to a new reselected SNP panel. The results are summarized in Table 3.
Out-of-bag (OOB%) error and misclassification error rate (MER%) on the test and validation population for both strategies, penalized multinomial regression and stability selection and principal component analysis-random forest

MDGI=mean decrease in the Gini index; MAD=mean accuracy decrease; PMR–SS=penalized multinomial regression and stability selection.
Between brackets standard deviations. Results based on 300 simulation runs.
Breed assignment
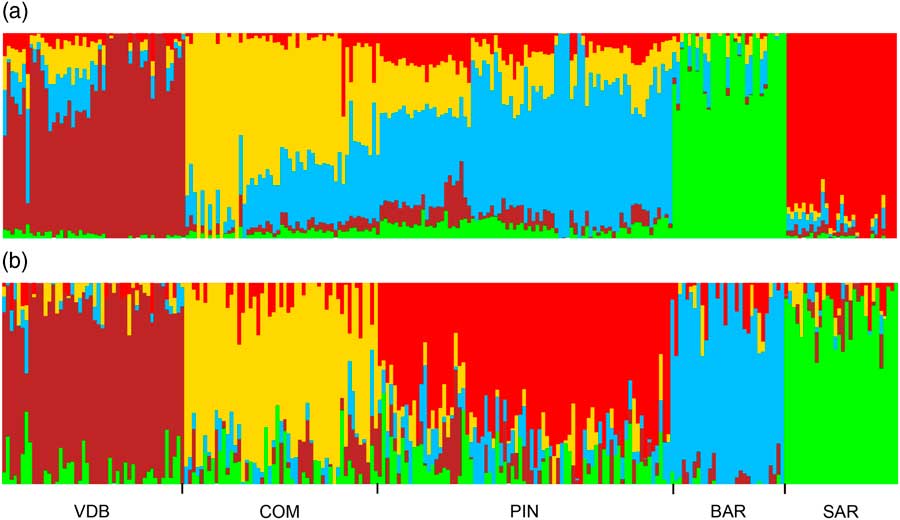
The performance of the selected informative SNP markers in individual assignment test was evaluated using traditional genetic statistics such as model-based clustering algorithm and Wright’s fixation index. These analyses were conducted using the whole set of SNPs (48 068) and the final number of selected SNPs (48). Results from within population substructure, using admixture analysis and considering a range of 2 through 10 potential clusters (K), indicated that the most probable number of inferred populations was K=5. A graphic representation of the estimated membership coefficients, using the whole set of SNPs and the final number of selected SNPs is shown in Figure 4, where model-based clustering partitioned the genome of each sample into a predefined number of components. Some breeds tend to have their own distinct cluster (Bar, Sar and VdB), whereas other breeds, such as Pin and Com, showed a complex admixture-like pattern. These results support the findings on the basis of PCA.
Model-based clustering of the five sheep breeds analysed for the most likely clusters (K=5), using (a) the whole set of single nucleotide polymorphisms (SNPs; 48 068) and (b) the final number of selected SNPs (48).

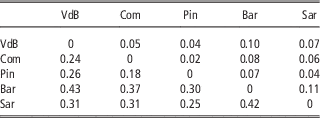
The degree of genetic differentiation between pairs of breeds is reported in Table 4. The highest F st value, for both SNPs panels, is seen between Bar and Sar and the lowest value was for Com v. Pin. Based upon the reference population, the average pairwise breeds F st showed a higher value using the 48 SNPs, confirming the ability of this method to select discriminating markers.
Population genetic differentiation (Fst statistic) among the five sheep breeds using the whole set of single nucleotide polymorphisms (SNPs; 48 068) (above diagonal) and the final number of selected SNPs (48) (below diagonal)

VdB=Valle del Belice; Com=Comisana; Pin=Pinzirita; Bar=Barbaresca; Sar=Sarda.
Discussion
The aim of this study was to apply a new strategy to identify the minimum number of informative SNPs from high-throughput genotyping data in sheep breeds reared in Sicily and to investigate their usefulness for breed assignment purposes. Generally, the selection of genetic markers useful for these purposes is based on two approaches: a deterministic one, in which markers with different allelic variants fixed in the compared breeds are used, and the probabilistic one, in which selected markers present typical allelic frequencies in different breeds (Negrini et al., Reference Negrini, Nicoloso, Crepaldi, Milanesi, Colli, Chegdani, Pariset, Dunner, Leveziel, Williams and Ajmone Marsan2009).
Several strategies have been already proposed to identify breed-informative SNPs derived from high-throughput genotyping platforms. These systems usually include a first step in which SNPs are preselected and a second step in which different assignment methods are applied (Bertolini et al., Reference Bertolini, Galimberti, Calò, Schiavo, Matassino and Fontanesi2015). For example, Allen et al. (Reference Allen, Taylor, McKeown, Curry, Lavery, Mitchell, Hartshorne, Fries and Skuce2010) in a study on Irish cattle, reported a set of 43 SNPs for breed identification on the basis of allele frequency. Heaton et al. (Reference Heaton, Leymaster, Kalbfeisch, Kijas, Clarke, McEwan, Maddox, Basnayake, Petrik, Simpson, Smith and Chitko-McKown2014) identified 163 SNPs for use in parentage testing and traceability in sheep, using the minor allele frequency (>0.3). In Mastrangelo et al. (Reference Mastrangelo, Di Gerlando, Tolone, Tortorici, Sardina and Portolano2014), a subset of 119 SNPs was tested to evaluate their ability to assign individuals to the same groups that have been used in the present study. These SNPs were selected according to their informativeness in breed pair comparisons meaning SNPs with the largest allele frequency differences between pairs of breeds were chosen (fixed alleles in one breed and MAF>0.25 in the other ones). Principal component analysis and k-means using this subset of SNPs showed a lack of ability to discriminate among the breeds and the presence of overlapped areas. Recently, Dimauro et al. (Reference Dimauro, Nicoloso, Cellesi, Macciotta, Ciani, Moioli, Pilla and Crepaldi2015) using three complementary multivariate statistical techniques (discriminant analysis) and using two reduced pools of 110 and 108 SNPs, respectively, obtained a separation among divergent sheep breeds.
In this paper, supervised approaches, penalized multinomial regression and stability selection procedures were applied to identify the minimum number of informative SNPs from high-throughput genotyping data and these were used as a classification method for unknown samples. The method proposed in the present work differs from other studies due to the statistical technique used to reduce the number of SNPs. The main result was the selection of 48 SNPs from a whole set of 48 068 and these contained sufficient genetic information to produce sufficient power for individuals’ breed assignment, using a relatively low number of individuals for breed and closely related breeds. The majority of the SNPs are in non-coding/intergenic regions of the sheep genome (Supplementary Material Table S1) which is ideal for identification and assignment purpose since these regions/SNPs should be less influenced by natural or artificial selection (Allen et al., Reference Allen, Taylor, McKeown, Curry, Lavery, Mitchell, Hartshorne, Fries and Skuce2010).
The study proved that the combination of these methods allowed efficient discrimination between individuals of the studied breeds. Of course, the 48 identified SNPs were useful to discriminate among all the sheep breeds under study and these markers are probably not useful to discriminate among other sheep breeds. However, this strategy could be easily reproduced to discriminate among other breeds. Wilkinson et al. (Reference Wilkinson, Wiener, Archibald, Law, Schnabel, McKay, Taylor and Ogden2011) reported poor assignment power for breeds with low sample size and closely related individuals, showing that closely related breeds require about 200 markers to achieve>95% assignment success. Bertolini et al. (Reference Bertolini, Galimberti, Schiavo, Mastrangelo, Di Gerlando, Strillacci, Bagnato, Portolano and Fontanesi2017) in a study on cosmopolitan and autochthonous cattle breeds showed that a 96 SNP panel was generally more able to discriminate all breeds, whereas for the 48 SNP panel, the error rate increased mainly for autochthonous breeds, probably as a consequence of their admixed origin, lower selection pressure and by ascertaining bias in the construction of the SNP chip. In fact, where there is sufficient genetic heterogeneity among populations, a few genetic markers can be easily used to identify and verify the origin of individuals, whereas it becomes more complicated for population with low genetic differentiation, such as the sheep breeds involved in this study (Mastrangelo et al., Reference Mastrangelo, Sardina, Riggio and Portolano2012; Tolone et al., Reference Tolone, Mastrangelo, Rosa and Portolano2012). It is well known that a high number of genotyped animals can capture the whole within population variability reducing the possibility that some individuals would not be assigned correctly due to atypical genotypes (Hulsegge et al., Reference Hulsegge, Calus, Windig, Hoving-Bolink, Maurice-van Eijndhoven and Hiemstra2013). Considering the high level of admixture among these sheep breeds (Mastrangelo et al., Reference Mastrangelo, Portolano, Di Gerlando, Ciampolini, Tolone and Sardina2017), and the relative low number of analysed individuals, our study reported relevant results. A good separation among breeds was still obtained with high percentages of correct assignment. The applicability of reduced SNP panels with low classification error rate is therefore still possible also for local breeds in which the total or partial lack of selection programs have not shaped the genome as it might be the case for cosmopolite breeds.
The combined use of PCA and RF proposed by Bertolini et al. (Reference Bertolini, Galimberti, Calò, Schiavo, Matassino and Fontanesi2015), and applied to our sheep breeds, highlights difficulties to discriminate among them, even when using two different panels of 48 and 96 SNPs. The simulation results have also highlighted that the proposed strategy performed slightly better than PCA–RF strategy, as did the results in the real application. Therefore, the proposed strategy could provide a new tool to get over problems in which breeds are phylogenetically close.
The results reported using independent analyses, such as the model-based clustering algorithm implemented in admixture software (Alexander and Lange, Reference Alexander and Lange2011) and F st confirmed the ability of this method in selecting discriminating markers. The reduced SNP panel captured a large proportion of genetic variation between the dairy sheep breeds with estimates of F st exceeding those previously reported using microsatellites (Tolone et al., Reference Tolone, Mastrangelo, Rosa and Portolano2012) and SNPs (Mastrangelo et al., Reference Mastrangelo, Di Gerlando, Tolone, Tortorici, Sardina and Portolano2014). Moreover, a previous study on Sicilian sheep breeds (Tolone et al., Reference Tolone, Mastrangelo, Rosa and Portolano2012) using a set of 20 microsatellites, reported that the Bayesian assignment test showed a low assignment value for these breeds, and the low robustness of the assignment test made it infeasible for traceability purposes.
Validation analyses will be conducted on the identified SNPs using a wider sample of individuals and other laboratory assay, for example Sanger sequencing. Finally, a multiplexed genotyping-by-sequence assay will be developed highlighting the economic advantage on the use of reduced SNP panels, compared with dense genome-wide assay, for routine use in the management of local populations.
Conclusions
Results for assignment test using the mixed strategy were interesting, because 100% of the individuals were correctly assigned to their breeds of origin. Using genotypic data, a small set of SNPs was identified. The results laid the basis to improve the proposed strategy for the potential use of it to generate panels that may be used for breed assignment or within an industrial setting for tracing the origin of animal products derived from the five breeds involved in the study.
Acknowledgements
This research was financed by PON02_00451_3133441, CUP: B61C1200076005 funded by MIUR.
Supplementary material
To view supplementary material for this article, please visit https://doi.org/10.1017/10.1017/S175173111700266X