Implications
In this study, Next Generation Sequencing (NGS) and gas chromatography (GC) techniques assessed the effects of diets with fat supplementation on rumen microbial community and ruminal fatty acids (FA), respectively, in 18 Alpine goats. A treatment period of 100 days with supplemented feed showed a change in the composition of rumen microbial community with a significant effect on biodiversity of the ruminal bacterial community in goat and a relevant repercussion on lipid metabolism of rumen, especially on biohydrogenation (BH) and plasmalogens synthesis.
Introduction
In the last 20 years, the use of different polyunsaturated lipid source in the diet of dairy ruminant has been extensively adopted in order to modify the milk fatty acid composition toward a more desirable profile for human health (Mele, Reference Mele2009). The efficiency of the FA transfer from diet to milk depends on several factors, including the nature of the fat supplementation and the interaction between fat source and rumen microbes. Dietary polyunsaturated FA, in fact, are massively converted by lipolysis and BH processes into stearic acid (C18 : 0), after a previously lipolysis of triglycerides and phospholipids. Moreover, lipid supplements may interact with cellulolytic bacteria, interfering with fiber degradation (Chilliard et al., Reference Chilliard, Ferlay, Rouel and Lamberet2003). Several in vitro and in vivo studies, aiming at evaluating the interaction between fat supplements and rumen microbes, demonstrated that FA composition of rumen liquor may be informative (Buccioni et al., Reference Buccioni, Decandia, Minieri, Molle and Cabiddu2012). For instance, differences in C18 : 3, C18 : 2 and C18 : 1 isomers content of rumen liquor may be associated to alternative BH pathways (Shingfield et al., Reference Shingfield, Bernard, Leroux and Chilliard2010). At the same time, the content of specific FA originated by different metabolisms of rumen microbes (i.e. odd and branched chain FA) or the presence of plasmalogenic lipids that are components of cell membranes of microbes have been associated to specific dietary regimens (Vlaeminck et al., Reference Vlaeminck, Fievez, Cabrita, Fonseca and Dewhurst2006; Alves et al., Reference Alves, Santos-Silva, Cabrita, Fonseca and Bessa2013). Fievez et al. (Reference Fievez, Colman, Castro-Montoya, Stefanov and Vlaeminck2012) proposed a predictive model to estimate ruminal activity, considering milk odd and branched chain FA. More recently, the introduction of high-throughput sequencing techniques, utilizing the 16S gene as universal target (Frey et al., Reference Frey, Pell, Berthiaume, Lapierre, Lee, Ha, Mendell and Angert2010), has led to many advances in rumen microbial communities characterization, as culture-dependent methods only detect around 11% of species present in this ecosystem (Fernando et al., Reference Fernando, Purvis, Najar, Sukharnikov, Krehbiel, Nagaraja, Roe and DeSilva2010). With these technologies, studies on: rumen metagenome composition (Cunha et al., Reference Cunha, Barreto, Costa, Bomfim, Castro, Kruger and Quirino2011) and microflora changes due to different diet and supplementation (Toral et al., Reference Toral, Bernard, Belenguer, Rouel, Hervás, Chilliard and Frutos2016) have been published for different species, mainly for cattle and sheep, whereas little information is available for goat.
The present study was designed to assess the responses and the associations between the microbiome structure and rumen FA production due to linoleic acid (hemp seeds) or α-linolenic acid (linseed) supplemented diets in 18 Alpine goats, using NGS and GC techniques, respectively.
Material and methods
Animal selection and experimental design
The experiment was conducted at the Research Centre ‘Cascina Baciocca’ of the Department of Agricultural and Environmental Sciences, University of Milan in Cornaredo (Milan, Italy). Trial animals were handled as outlined by the guidelines of the Italian law on animal welfare for experimental animals (Legislative Decree 116/92) and of the University of Milan Ethics Committee for animal use and care.
In all, 18 Alpine goats were selected among 150 secondiparous goats reared at ‘G.P. Guidobono Cavalchini’ experimental farm of the University of Milan in Borgo Adorno (Cantalupo Ligure, Alessandria, Italy). All goats were unaffected by caprine arthritis-encephalitis virus and mastitis and were daughters of 12 bucks. The 18 goats were selected considering in sequence: production at their first lactation (only goats producing similar milk yield were considered); body condition evaluation (only goats with good to high evaluation were considered); pedigree (among the remaining animals, goats were selected to be daughter of the highest number of bucks as possible, resulting in seven bucks) in order to minimize their total phenotypic diversity and maximize genetic diversity among the goats. Moreover, a genomic analysis was conducted using the Goat 50K SNP chip (Illumina, San Diego, CA, USA) for the assessment of genetic diversity (identity by state) to assign the goats to the three diet groups avoiding including too similar animals in the same group. Then, the three groups were assigned randomly to the three different dietary treatments.
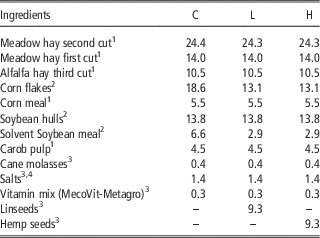
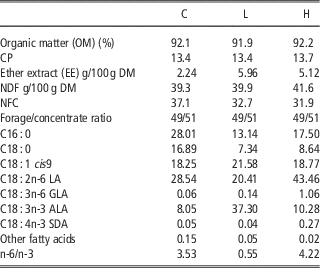
The diets (Tables 1 and 2) were formulated to meet the protein and energy requirements of lactating goats weighing 65 kg and producing 2.8 kg of milk/day.
Composition of the experimental control (C), linseed (L) or hemp (H) diets (% on dry matter)

1 Ingredients of the basal ration.
2 Ingredients of both basal ration and supplement concentrates.
3 Ingredients of the concentrate supplements.
4 Salts: 35% calcium carbonate, 32% sodium bicarbonate, 15% dicalcium phosphate, 13% sodium chloride, 5% magnesium oxide.
Chemical composition of the administered control (C), linseed (L) or hemp (H) diets

DM=dry matter; NFC=Non-Fiber Carbohydrates, calculated as follows: (NFC=OM−(CP+EE+NDF)); LA=linoleic acid; GLA=γ-linoleic acid; ALA=α-linolenic acid; SDA=stearidonic acid.
The treatments were arranged to evaluate the main effects of two dietary lipid supplementations (linseed or hemp), on rumen population and its lipid metabolism as follows: (1) control diet (C), (2) diet supplemented with linseed (L), (3) diet supplemented with hemp seed (H). In order to balance for the fat supplementation in the two experimental diets, corn flakes and soybean meal were included in the C diet.
After calving, the 18 animals were divided into three different boxes and fed for the 40±7 (SD) days postpartum with a transition diet (after-calving diet; time point=T0), very similar to the control diet fed in T1, but with a slightly higher forage to concentrate ratio (51/49 v. 49/51, for T0 and T1, respectively), allowing management of the administration of independent rations. Thereafter, until 140±7 days of lactation (time point=T1), goats were fed a common basal ration plus three different concentrate supplements corresponding to different dietary treatments. The basal ration, containing the forages and some concentrate raw materials (Table 1), was prepared with a mixer wagon to allow a reduction of forage particle size. On dry matter (DM) basis, it accounted for 85.6% of total diet. The concentrate supplements (14.4% on total dietary DM) were administered individually twice daily (08.30 and 17.30 h) about half an hour before the basal ration. The goats were fed ad libitum and the orts were recorded once daily. The feeding rate was adjusted to yield orts on the basis of at least 5% of the amount supplied (on an as-fed basis). Basal ration was administered in the collective manger of each box. During the entire experiment, the goats had free access to water.
Individual rumen fluid was collected at the two time points (T0 and T1), using an aesophageal polyethylene probe (internal and external diameters of 8 and 12 mm, respectively; length: 1.8 m). Three diverse aesophageal probes connected with a glass vacuum pump were used for the each specific diet. The samples (0.2 l of rumen fluid) were collected 5 h after the morning feeding (13 : 30 h), stored at −20°C and used for metagenomic analyses and FA composition characterization.
Diet and milk chemical analysis
The basal ration and the supplements were stored at −20°C and analyzed in the next 48 h for the concentrations of ash (method 942.05; AOAC International, 1995), CP (method 984.13; AOAC International, 1995), ether extract (EE; method 920.29; AOAC International, 1995), and NDF corrected for insoluble ash and with the addition of α-amylase (aNDFom; Mertens, Reference Mertens2002), using the Ankom 200 fiber apparatus (Ankom Technology Corp., Fairport, NY, USA).
Diet FA were analyzed according to Demirel et al. (Reference Demirel, Wachira, Sinclair, Wilkinson, Wood and Enser2004). In brief, FA in the feed were obtained by hydrolysis with 5 M KOH in 1 : 1 (vol/vol) methanol:water at 60°C for 3 h. The samples were acidified to pH 1.0 and heated for an additional 1 h before extraction of the FA into light petroleum (boiling point: 40°C to 60°C). The fatty acid methyl esters (FAMEs) in hexane were injected into a GC Agilent 6890 GC system (Agilent Technologies, Santa Clara, CA, USA) equipped with autosampler, on-column injector, and a FID detector. The separation was performed on a 100% dimethylpolysiloxane column (CP-Sil88 for FAME, 100 m×0.25 mm×25 μm, Agilent Technologies, Santa Clara, CA, USA) adopting the conditions of Revello Chion et al. (Reference Revello Chion, Tabacco, Giaccone, Peiretti, Battelli and Borreani2010), with some modification: the carrier gas was hydrogen at a constant pressure of 28 psi. Column temperature was set at 60°C for 6 minutes, and, then, increased to 165°C at a rate of 15°C/min and held for 1 min, then increased to 225°C at a rate of 2°C/min and held for 17 min. Fatty acid methyl esters were identified by comparison of their retention times with known standards (37-component FAME mix, Supelco 47885-U) and expressed as g/100 FA.
Milk samples were analyzed for fat using Gerber method (method 2446; International Organization for Standardization, 1976); CP and Lactose concentration were determined using a Fourier transform IR analyzer (MilkoScan FT6000; Foss Analytical A/S, Hillerød, Denmark). Milk urea concentration was determined by using a differential pH technique (method 14637; International Organization for Standardization, 2006).
Deoxyribonucleic acid extraction, library preparation and sequencing
Deoxyribonucleic acid extraction was performed from 0.25 g of lyophilized rumen fluid samples following the protocol described in literature (Yu and Morrison, Reference Yu and Morrison2004), and stored at −20°C until use. DNA concentration and purity were measured using a NanoDrop ND-1000 spectrophotometer (Nano Drop Technologies, Inc., Wilmington, DE, USA).
For metagenomic analysis, bacterial and archaeal DNAs were amplified using the primers described in literature (Caporaso et al., Reference Caporaso, Lauber, Walters, Berg-Lyons and Lozupone2011), which target the V3 to V4 hypervariable regions of the 16S rRNA gene. All PCR amplifications were performed in 25-μl volumes/sample; 12.5 µl of Thermo Master Mix 2× (Life Technologies, Italia, Monza, MB, Italy) and 0.2 µl of each primer (100 µM) were added to 2 µl of genomic DNA (5 ng/µl). A first amplification step was performed in an Applied Biosystem 2700 thermal cycler (Applied Biosystems, Foster City, CA, USA), as follows: denaturation at 98°C for 30 s; 25 cycles with a denaturing step at 98°C for 30 s, annealing at 56°C for 1 min and an extension at 72°C for 1 min; final extension at 72°C for 7 min. Amplicons were cleaned-up with Agencourt® AMPure® XP (Beckman, Coulter Brea, CA, USA), following Illumina 16S Metagenomic Sequencing Library Preparation protocol (http://supportres.illumina.com/documents/documentation/chemistry_documentation/16s/16s-metagenomic-library-prep-guide-15044223-b.pdf; Illumina) and checked for amplicon size with 2100 Bioanalyzer Instruments (Agilent Technologies, Santa Clara, CA, USA). Libraries were prepared by a second PCR amplification step using Nextera XT index 1 Primers (N7XX) and Nextera XT Index 2 Primers (S5XX) from the Nextera XT Index Kit (FC-131-1001 or FC-131-1002), following 16S Metagenomic Sequencing Library Preparation protocol. Libraries were quantified by Real Time PCR with KAPA Library Quantification Kits (KapaBiosystems, Inc., Wilmington MA, USA) pooled in equimolar proportion and sequenced in one Miseq (Illumina) run with 300-base paired-end reads.
Metagenomic data analysis
The following procedure was applied for both the bacterial and the archaeal fraction of the rumen content. Raw sequencing reads were processed as follows: read pairs were, firstly, merged together by means of PandaSeq assembler (‘PAired-eND Assembler for DNA sequences,’ Masella et al., Reference Masella, Bartram, Truszkowski, Brown and Neufeld2012) which performs a local assembly between two overlapping pairs, thus creating a single fragment. Non-overlapping sequences, fragments shorter than 250 bases or longer than 900 bases were discarded. Then, sequences were quality-filtered using the ‘split_libraries_fastq.py’ utility of the QIIME suite (Caporaso et al., Reference Caporaso, Kuczynski, Stombaugh, Bittinger, Bushman, Costello, Fierer, Peña, Goodrich, Gordon, Huttley, Kelley, Knights, Koenig, Ley, Lozupone, McDonald, Muegge, Pirrung, Reeder, Sevinsky, Turnbaugh, Walters, Widmann, Yatsunenko, Zaneveld and Knight2010), which discards from further analyses any sequence having more than 25% low-quality nucleotides (i.e.: having a phred score of 3 or less). Quality-filtered reads were, then, analyzed with the standard QIIME pipeline. A random subset of 50 000 reads for each sample was used. Sequences were grouped into operational taxonomic units (OTU) by clustering together reads at 97% identity or higher and taxonomically classified against the Greengenes bacterial 16S rRNA database (release 13_8, http://greengenes.lbl.gov) by using the RDP classifier (Wang et al., Reference Wang, Garrity, Tiedje and Cole2007) at 50% confidence. Singleton sequences were discarded as possible artifacts. Alpha diversities were calculated according to different microbial diversity metrics (i.e.: chao1, Shannon index, observed species and Faith’s phylogenetic distance) and evaluated in order to determine whether the chosen subset was representative of the overall microbial diversity within each sample and if there were any differences in terms of microbial diversity between the groups of animals subjected to different diet supplementation. A non-parametric t test with random permutations was used to determine whether there were statistically significant differences in terms of microbial diversity.
Beta-diversity among samples was calculated using the UniFrac metric (Lozupone and Knight, Reference Lozupone and Knight2005) and principal coordinates analyses (PCoAs) were conducted by evaluating both weighted and unweighted Unifrac distances, in order to highlight eventual clustering among samples depending on the diet supplementation. All other statistical evaluations and analyses were performed in Matlab (Natick, MA, USA).
Rumen fatty acid composition analysis
Methyl esters of FA, dimethylacetal (DMA) and dimethylesters (DME) were prepared by direct extraction and using an acid-catalyzed transmethylation procedure, as follows: 5 g of raw rumen fluid sample were added in a tube with 2 ml of 10% acetyl chloride methanolic solution. Samples were incubated at 50°C overnight, then 2 ml of 6% aqueous potassium carbonate solution were added to neutralize pH. Subsequently, methylated FA were extracted with 5 ml of hexane and transferred in a fresh tube. The extraction step with hexane was repeated twice. Samples were dried under nitrogen flow and, then, resuspended with 0.5 ml of hexane. Samples were collected in a vial for GC analysis.
This methodology directly produces FA methyl esters from the intact sample, reducing time and solvent, and avoiding the isomerization of conjugated FA (Christie, Reference Christie1993). Furthermore, acidic catalyzed transmethylation is necessary to release free FA, which were abundant in rumen liquor. As the high level of water in the samples may reduce the transesterification efficiency, to assure that reaction was complete, samples were examined by thin-layer chromatography (TLC) using hexane-diethyl ether (70 : 30, v/v) and the single spot representing fatty acid esters was visualized with chromo-sulphuric mix (Supplementary Figure S1).
The acidic transesterification method also produced DMA, which are derived from fatty aldehydes, released from plasmalogens.
Dimethylacetal and DME identification was performed on three samples by TLC separation and GC-MS as described by Alves et al. (Reference Alves, Santos-Silva, Cabrita, Fonseca and Bessa2013), starting from an aliquot of esterified fraction. Mass spectrometry spectra of the single DMA were reported in the Supplementary Figures S2 and S3. Comparing total FA, FA methyl esters and DMA chromatograms, it is possible to identify the peaks.
The FA composition was determined by GC analysis using a GC2010 Shimadzu gas chromatograph (Shimadzu, Columbia, MD, USA) equipped with a flame-ionization detector and a high polar fused-silica capillary column (Chrompack CP-Sil88 Varian, 152 Middelburg, the Netherlands; 100 m, 0.25 mm i.d.; film thickness 0.20 μm). Hydrogen was used as the carrier gas at a flow of 1 ml/min. Split/splitless injector was used with a split ratio of 1 : 40. An aliquot of the sample was injected under the following GC conditions: oven temperature started at 40°C and was held at that level for 1 min; then, it was increased to 163°C at a rate of 2°C/min, and held at that level for 10 min, before being, once again, increased to 180°C at 1.5°C/min and held for 7 min, and, finally, to 187°C at a rate of 2°C/min; at last the temperature was increased to 220°C with a rate of 3°C/min and held for 25 min. Injector temperature was set at 270°C and detector temperature was set at 300°C. Individual FA methyl esters were identified by comparison with a standard mixture of 52 Component FAME Mix (Nu-Chek-Prep Inc., Elysian, MN, USA). Nonadecanoic acid was added as internal standard. The identification of isomers of 18 : 1 was based on commercial standard mixtures (Supelco, Bellefonte PA, USA) and published isomeric profiles (Kramer et al., Reference Kramer, Hernandez, Cruz-Hernandez, Kraft and Dugan2008). Total ruminal FA, DMA and DME fraction were expressed as mg/g DM, whereas the profile was expressed as g/100 g of the sum of FA DMA and DME, respectively.
Statistical analysis
All data (i.e. milk yield and composition, FA, DMA and DME level) were processed using the following model, adjusted using the independent variable (i.e. FA composition) of the pre-trial period as covariates:
 $$y_{{ij}} \,{\equals}\,\mu {\plus}D_{i} {\plus}\beta \left( {x_{{ij}} {\minus}x} \right){\plus}e_{{ij}} $$
where y ij is the independent variable; μ the overall mean; D i the fixed effect of diet (i=Control, Hemp, Linseed diets); β the linear regression coefficient between y ij and x ij , x ij the value of covariate corresponding to y ij , x the mean of x ij and e ij the residual error.
Correlations between FA, DMA and family-level microbiota profiles were evaluated calculating Pearson’s coefficient between the raw relative abundance of each family and the ruminal FA composition (as assessed above); only correlations with a p-value of the linear model below 0.005 were considered as significant.
Results
Milk yield and composition
Milk yield resulted unaffected (P=0.985) by the different dietary treatment, with an average production of 2.33 kg/d (SE=0.12). Milk composition also resulted unchanged irrespective of the different supplementation, except for milk fat concentration. Goats fed the C diet showed a lower fat percentage than that fed with the fat supplemented diets (3.39, 3.73, and 3.69%, for C, L, and H, respectively; SE=0.10; P=0.013). Crude protein, lactose and milk urea concentrations were, on average, as follows: 3.27%, 4.54% and 28.1 mg/dl. The daily dry matter intake, determined on a group basis, was on average 1.9 kg.
Metagenomic analyses
Raw sequencing data (bacteria and archaea) have been deposited into Short Reads Archive (http://www.ncbi.nlm.nih.gov/sra/) under Accession Number PRJNA316187.
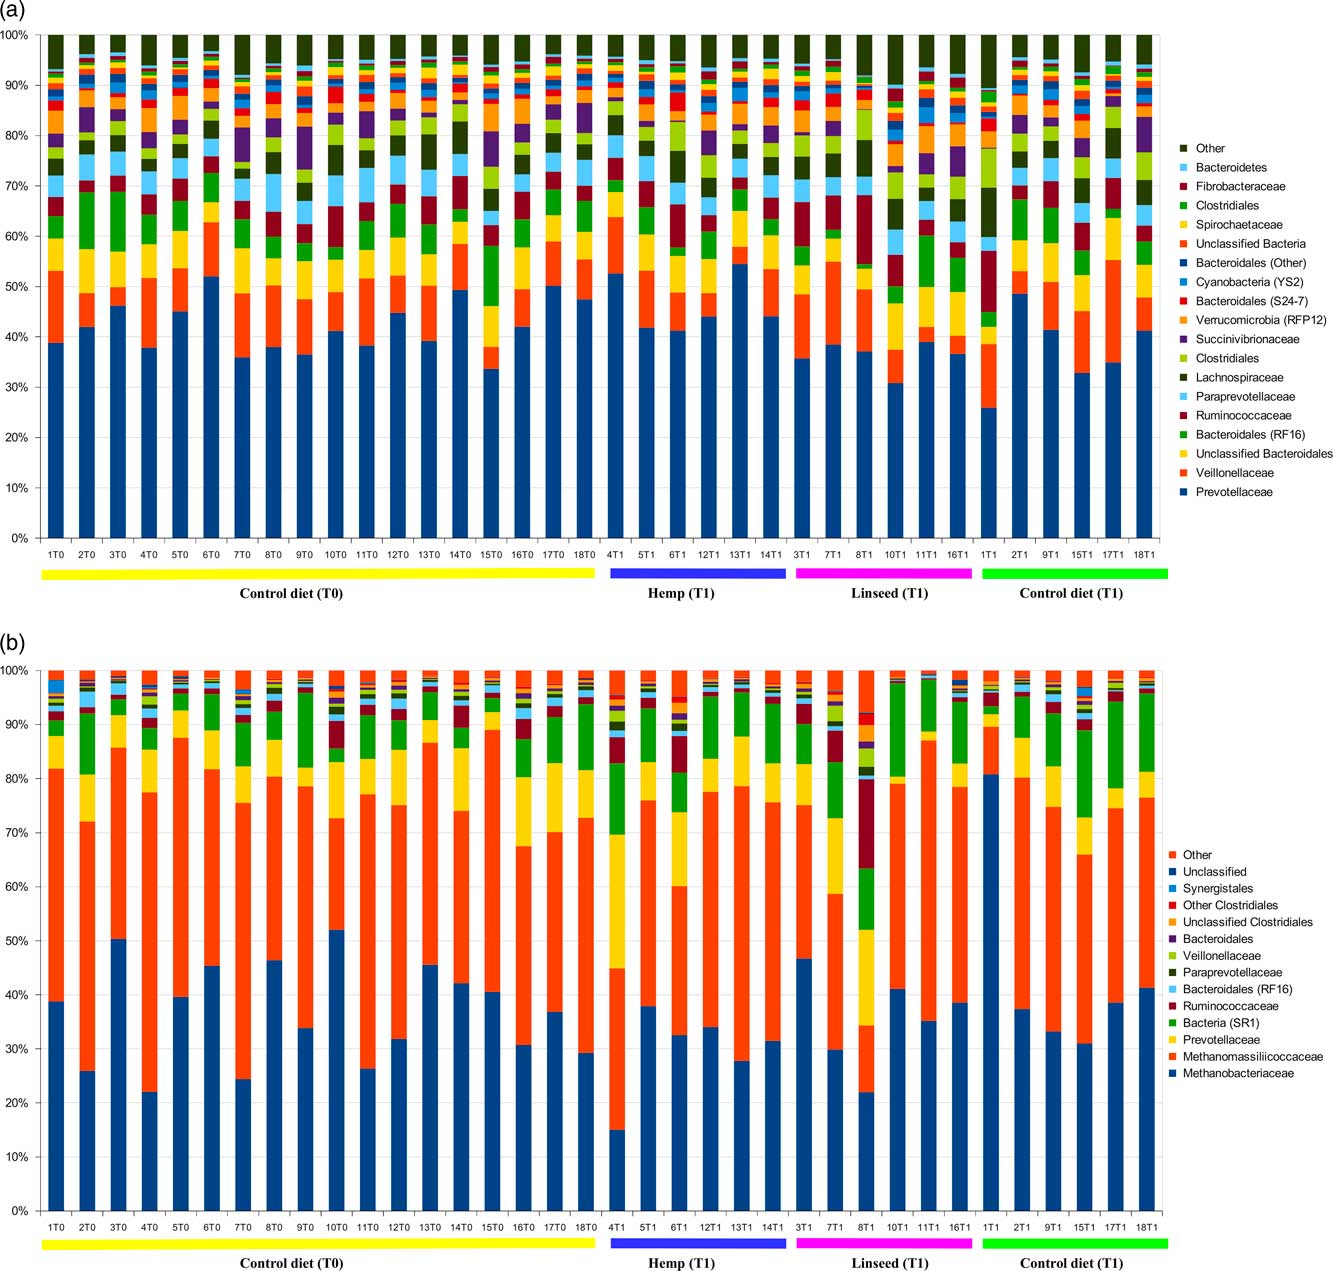
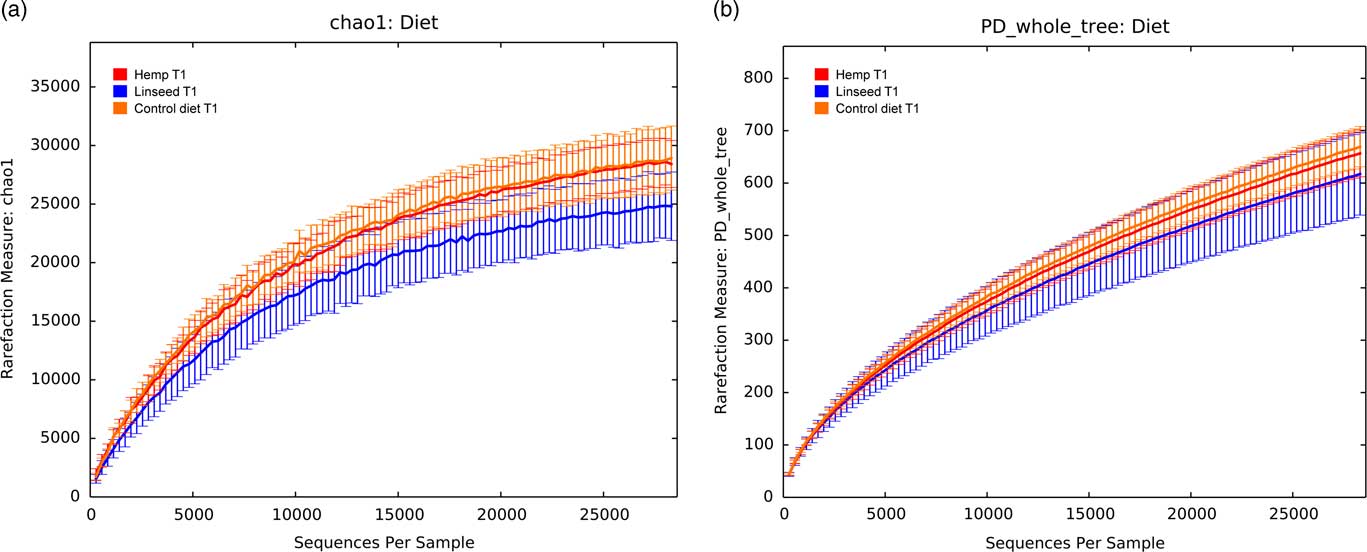
Bacterial groups within the rumen generated an average of 12 461±1231 OTUs per sample, which could be assigned to specific taxonomies down to the genus level. After singletons removal, we obtained 38 259±2684 reads per sample. Independently from sampling time and diet, rumen composition was dominated by bacteria belonging to Bacteroidetes (summing up to about 61.2% on average relative abundance), followed by Firmicutes (24.2%), whereas subdominant phyla were Proteobacteria and Verrucomicrobia (4.1% and 3.3%, respectively). At family level (Figure 1a), Prevotellaceae resulted as the dominant group (average relative abundance, rel ab, 41.0%), followed by Veillonellaceae (9.4%), unclassified Bacteroidales (6.6%) and Bacteroidales RF16 family (5.3%), which corresponds to a group of unidentified rumen bacteria in SILVA 16S rRNA database (release 121, http://www.arb-silva.de/browser/ssu-121/EU794092/). Other components were within the families of Ruminococcaceae, Paraprevotellaceae and Lachnospiraceae (rel ab of 5.0%, 4.4%, 4.3%, respectively). The rarefaction curves analysis, which assesses species richness from sampling, suggested that our sampling was enough to sufficiently describe the main components of the rumen microbiota biodiversity. Moreover, in relation to the three different diets, a trend toward a reduction of the biodiversity was observed in the goats subjected to L diet (Figure 2, Supplementary Figure S4). No difference, on the other hand, was found on the basis of the inter-sample diversity on the basis of the PCoA evaluations (beta-diversity, data not shown).
Relative abundance of Bacterial (a) and Archaeal (b) compositions of different communities with the three experimental diets (C=control; H=hemp; L=linseed) at T0 and T1 sampling times.

Bacterial rarefaction curves calculated according to chao1 (a) and Faith’s phylogenetic metric (b) for all samples and represented for each different diet (C=control; H=hemp; L=linseed) at the two time points (T0 and T1). Curves were drawn using the least sequenced sample (~28 000 reads) as upper limit for the rarefactions.

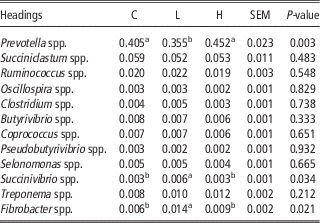
The relative abundance of the most abundant bacterial genera of the three diet groups is reported in Table 3. Linseed supplementation induced a significantly reduction of Prevotella spp. (−12%), and an increase of Succinivibrio spp. (+50%) and Fibrobacter spp. (+75%), compared with the samples of control group. On the contrary, hemp did not show significant differences on the relative abundance of phyla.
Relative abundances of the 10 most abundant bacterial phyla revealed in the rumen with control (C), linseed (L) or hemp (H) diets

SEM=standard error of the mean.
a,b Values within a row with different superscripts differ significantly at P<0.05.
For archaeal diversity, the reads were clustered in an average of 4616±958 OTUs at 97% of identity. Operational Taxonomic Unit rarefaction curves were considered as having reached a plateau (approximating the saturation level), at about 35 000 reads (Supplementary Figure S5).
According to our data (Figure 1b), independently from the diets and the time points of rumen collection (T0 or T1), the goat rumen was dominated by the families of Methanobacteriaceae (average rel. ab 36.8%±11.3%), Methanomassiliicoccaceae (average rel. ab. 37.1%±10.4%), whereas about 26% of reads were found to be bacterial sequences of rumen origin by taxonomic classification by RDP classifier, specifically Prevotellaceae, Bacteriodales and Ruminococcaceae (about 8%, 3% and 1%, respectively). This was probably due to a lower representativeness of Archaea sequences within the Greengenes database which could result in non-specific matches for non-represented taxa or to a partial cross-match between the PCR primers used for Archaea amplification and bacterial 16S sequences.
The majority of the sequences were related to the genus vadin CA11 (within the family of Methanomassiliicoccaceae), representing an average of 33.2%, 33.2% and 39.0% of the sequences in the rumen fluid fraction of C, L and H diets, respectively. The genus Methanobrevibacter was the second most predominant, representing an average of 39.5%, 31.2% and 26.8% of the reads in C, L and H diets, respectively, followed by Methanosphaera. However, these differences in the average relative abundance of archaeal genera was found to be not statistically significant, due to the relatively high variability in the composition between the individual animals constituting each dietary group.
Ruminal fatty acid composition
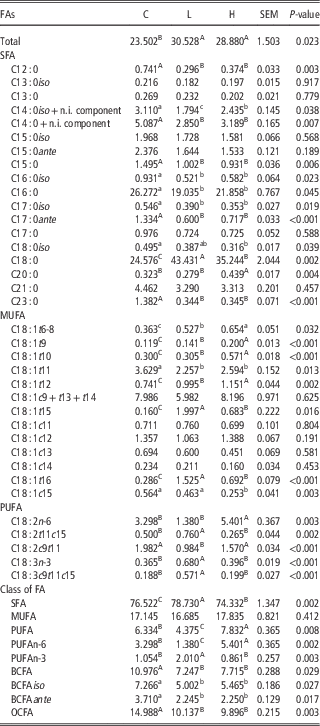
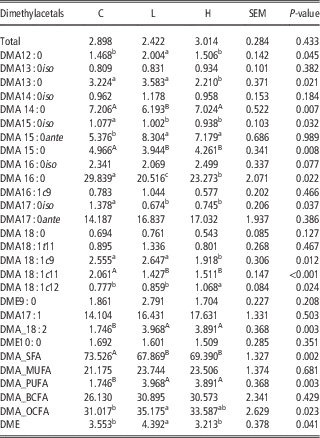
Fatty acid and DMA composition of rumen fluid is reported in Tables 4 and 5. Saturated FA represented the most abundant class (>70%), as a consequence of the high rumen BH rate.
Effect of control (C), linseed (L) and hemp (H) diets in the total fatty acid (FA) (mg/g of dry matter) and FA composition (% of total FA) of goat rumen content

SEM=standard error of the mean; n.i.=not identified; SFA=saturated fatty acids; MUFA=monounsaturated fatty acids; PUFA=polyunsaturated fatty acids; BCFA=branched chain fatty acids; OCFA=odd chain fatty acids.
Different letters in the same row correspond to statistically different values: a,b,c: P<0.05, A,B,C: P<0.001.
Effect of control (C), linseed (L) and hemp (H) diets in the total fatty acid (FA) dimethylacetals (DMA) and dimethylesters (DME) (mg/g of dry matter) and DMA and DME composition (% of total DMA+DME) of goat rumen content

SEM=standard error of the mean; n.i.=not identified; SFA=satured fatty acids; MUFA=monounsaturated fatty acids; PUFA=polyunsaturated fatty acids; BCFA=branched chain fatty acids; OCFA=odd chain fatty acids.
Different letters in the same row correspond to statistically different values: a,b,c: P<0.05, A,B: P<0.001.
Fatty acids amount was significantly higher in L (+30%) and H (+23%) groups than control group as consequence of lipid supplementation in the diet.
Saturated FA significantly increased with fat supplementation, being contained at higher amount in rumen liquor from L (+19%) and H diet (+15%). Diet H induced higher content of PUFA n-6 in rumen liquor, whereas L diet led to a significant increase of PUFA n-3. In particular, linseed supplementation increased α-linolenic acid (+118%) and some FA that origin from the rumen BH of linolenic acid: C18 : 3c9t11c15 (+257%), C18 : 2t11c15 (+79%), C18 : 1t15 (+1369%) and C18 : 1t16 (+526%) (P<0.01). Diet supplemented with hemp seed increased the content of linoleic acid (+88%), C18 : 1t6+t7+t8 (+110%), C18 : 1t9 (+194%) and C18 : 1t10 (121%). Stearic acid (C18 : 0) content significantly increased regardless the type of lipid supplement. However, L diet led to the highest increase of stearic acid (+108%). The content of branched chain fatty acids (BCFA) (−20%) and odd chain fatty acid (OCFA) (−26%) decreased irrespective to the source of fat.
Nineteen DMA and two DME were identified in rumen samples (Table 5). In all, 12 individual DMA significantly changed in DMA profile as a consequence of lipid supplementation: DMA12 : 0, DMA13 : 0, DMA14 : 0, DMA15 : 0iso, DMA15 : 0ante, DMA15 : 0, DMA16 : 0, DMA17 : 0iso, DMA18 : 1c9, DMA18 : 1c11, DMA18 : 1c12 and DMA 18 : 2.
Rumen fatty acid profile and bacterial microbiome association
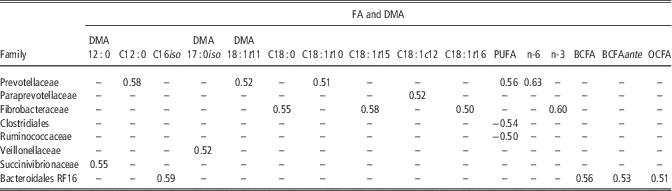
The FA and DMA that showed high and significant (P<0.005) Pearson’s correlations with bacterial microbiome composition at the family level are reported in Table 6.
Rumen fatty acid (FA) and dimethylacetals (DMA) showing a significant (P<0.005) Pearson’s correlation with bacterial microbiome composition at the family level

Prevotellaceae showed a positive correlation with PUFA, PUFA n-6, whereas Clostridiales and Ruminococcaceae were negatively correlated with PUFA. Fibrobacteraceae was the only family that showed a significant correlation with PUFA n-3. Significant correlations were also found for C18 : 0 (Fibrobacteraceae), C18 : 1t10 (Prevotellaceae), C18 : 1t15 (Fibrobacteraceae), C18 : 1t12 (Paraprevotellaceae) and C18 : 1t16 (Fibrobacteraceae).
Dimethylacetal12 : 0, DMA17 : 0iso and DMA18 : 1t11 were the only DMA positively correlated with Prevotellaceae, (DMA12 : 0 and DMA18 : 1t11) and Veillonellaceae (DMA17 : 0iso).
Bacteroidales RF16 is the only family positively correlated with BCFA (mainly with C16 : 0iso) and OCFA.
Discussion
In this study, NGS and GC techniques were used to assess the effects of dietary fat supplementation on rumen microbial community and lipid composition of rumen liquor, respectively, in 18 Alpine goats. For the experimental plan, a period of 100 days was considered to verify a change in the composition of rumen microbial community.
Irrespective to the dietary treatment groups, Bacteroidetes and Firmicutes dominated the composition of phyla, with a high abundance of Prevotellaceae, Veillonellaceae and a low presence of Ruminococcaceae, Paraprevotellaceae and Lachnospiraceae. This result is consistent with a previous research published by Cunha et al. (Reference Cunha, Barreto, Costa, Bomfim, Castro, Kruger and Quirino2011), who characterized bacterial community in Moxotó goats by NGS technique. Moreover, similar results were described also by Min et al. (Reference Min, Wright, Ho, Eun, Gurung and Shange2014) where the percentages of Bacteroidetes and Firmicutes in rumen sheep’s samples were 53% and 36.7% of the total bacterial sequences respectively, and by Zened et al. (Reference Zened, Combes, Cauquil, Mariette, Klopp, Bouchez, Troegeler-Meynadier and Enjalbert2013), for whom, more than 80% of total sequences in rumen samples of cow fed different diets, were represented by Firmicutes (49.6%) and Bacteroidetes (40.2%). In our study, Prevotellaceae was the dominant bacterial family in all the experimental diets at the both sampling times. Therefore, Prevotellaceae and Bacteroidaceae, were, apparently, the principal families involved in the degradation of the diet at the rumen level, though more investigation are needed to support these conclusions. As far as Archaea, which account for about 4% of ruminal microbes (Paul et al., Reference Paul, Deb, Dey, Somvanshi, Singh, Rathore and Stiverson2015), Methanobrevibacter was the main genus, confirming what previously reported in studies on rumen liquor from cattle (Sirohi et al., Reference Sirohi, Chaudhary, Singh, Singh and Puniya2013) and goat (Cunha et al., Reference Cunha, Barreto, Costa, Bomfim, Castro, Kruger and Quirino2011). Methanobrevibacter is a genus of Methanobacteriaceae, obligate anaerobes distinctly differentiated from other organisms, that produces methane as a major catabolic product. The variation in community composition may be due to the rumen environment and the diet (Buccioni et al., Reference Buccioni, Decandia, Minieri, Molle and Cabiddu2012).
Rumen liquor contains several FA and DMA that are not present in the feedstuffs. Some of these compounds are the result of microbial BH, whereas DMA are known to be structural lipids of microbial membranes and cell walls, and are de novo synthesized by rumen microbes, participating in the maintenance of optimal membrane fluidity (Alves et al., Reference Alves, Santos-Silva, Cabrita, Fonseca and Bessa2013). So, FA composition of rumen liquor may provide useful information about the effect of lipid supplementation on rumen bacterial community and its metabolism.
Several studies have investigated the effect of lipid supplementation on the rumen FA in ruminant species, with particular attention for BH pathway (Loor et al., Reference Loor, Ferlay, Ollier, Ueda, Doreau and Chilliard2005; Toral et al., Reference Toral, Belenguer, Shingfield, Hervás, Toivonen and Frutos2012). The present study showed that two different lipid supplementations, hemp (linoleic acid source) or linseed (α-linolenic acid source), promoted changes in rumen BH pathway in goat. The first effect observed was the dramatic increase of C18 : 0 in rumen fluid of animal fed with lipid supplemented diet, as a consequence of the extensive BH occurring in goat rumen, as proposed by Toral et al. (Reference Toral, Bernard, Belenguer, Rouel, Hervás, Chilliard and Frutos2016). During the BH process, unsaturated FA are isomerized and hydrogenated generating a complex system of isomeric unsaturated FA, mostly with trans double bonds. These intermediates of rumen BH may largely vary according to changes in diet composition, as reported by Chilliard et al. (Reference Chilliard, Glasser, Ferlay, Bernard, Rouel and Doreau2007). Linseed favors the accumulation of characteristic intermediate of C18 : 3n-3 BH (C18 : 3c9t11c15, C18 : 2t11c15, C18 : 1c15, C18 : 1t15). On the other hand, hemp promotes an increase of C18 : 2n-6 BH intermediate (C18 : 1t6-8, C18 : 1t9, C18 : 1 t10, C18 : 1 t12).
Significantly, the higher level of C18 : 0 in the lipid supplemented diet is not related to a contemporary increase of vaccenic acid (VA, C18 : 1t11), the principal BH intermediate. Probably, lipid supplementation shifts the BH pathway synthesizing other trans C18 : 1 isomers instead of VA. In fact, a relevant increase of all trans FA (~+50%) in H and L groups, except VA, which showed similar level in comparison to C group, was observed. Moreover, VA represents 67% of total trans FA in C group, whereas this percentage is lower than 50% in H and L ones. The change of α-linolenic and linoleic acid ratio in the diet affect BH pathway, as well described by Chilliard and Ferlay (Reference Chilliard and Ferlay2004). This effect was revealed in cows fed with linseed and sunflower supplemented diet, two sources of α-linolenic and linoleic acid, respectively (Loor et al., Reference Loor, Ferlay, Ollier, Ueda, Doreau and Chilliard2005).
In the present study, Fibrobacteriaceae is the bacterial family showing the highest and significant correlation with FA involved in the BH pathway of C18 : 3n-3. This correlation may be related to the production of C18 : 0, which is one of the most abundant SFA characterizing F. succinogenes, the principal bacterium of Fibrobacteriaceae (Shah and Collins, Reference Shah and Collins1983), that, probably, synthesized C18 : 0 for requirements, starting from α-linolenic acid. Maybe, F. succinogenes play a role in the detoxification of ruminal environment by the production of C18 : 0, necessary for its metabolism, starting from C18 : 3n-3. However, this hypothesis need more investigation.
Apart from the C18 : 1t10 and C18 : 1t11, several others C18 : 1 isomers were produced in the rumen which can be accumulated in milk and meat tissues. In fact, the BH pathways of C18 : 2n-6 and C18 : 3n-3 are characterized by 15 octadecenoic FA isomers, ranging from trans-6 to cis-16 (Chilliard et al., Reference Chilliard, Glasser, Ferlay, Bernard, Rouel and Doreau2007).
As proved up by this study, some intermediate compounds of rumen BH may be considered a marker of the most representative pathway. Particularly, C18 : 3c9,t11,c15 and C18 : 2t11, c15 are well-known BH intermediates of the C18 : 3n-3 (Harfoot and Hazlewood, Reference Harfoot and Hazlewood1997); high level of these FA may be a good marker of a diet rich in C18 : 3n-3, like pasture or linseed supplementation.
Moreover, the significant and positive correlation between the relative abundance of the unidentified rumen bacteria RF16 and BCFA and OCFA, may indicate that this family plays a role in the rumen metabolism. BCFA and OCFA are synthesized in the rumen by cellulosolytic and amilolytic bacteria (Buccioni et al., Reference Buccioni, Decandia, Minieri, Molle and Cabiddu2012). RF16 is an unclassified family of the Bacteroidales (Jewell et al., Reference Jewell, McCormick, Odt, Weimer and Suen2015), so an investigation is needed to understand its role on BCFA and OCFA synthesis.
Another important class of ruminal lipids is represented by plasmalogens, which are strictly related to bacteria metabolism. Plasmalogen lipids are present in large amounts in anaerobic bacteria membranes with different physical properties compared with other phospholipids (Alves et al., Reference Alves, Santos-Silva, Cabrita, Fonseca and Bessa2013). Some of DMA are structural lipids of microbial membranes and cell walls, regulating the optimal fluidity of membrane (Goldfine, Reference Goldfine2010). Consequently, rumen microbes might have modified their plasmalogen content and composition in response to different environmental stimuli and microbial diversity. As reported by our results and confirmed by previous work (Alves et al., Reference Alves, Santos-Silva, Cabrita, Fonseca and Bessa2013), rumen DMA composition was similar to the FA composition, presenting odd- and branched-chains with carbon lengths between C15 and C18.
From this study a significant reduction of BCFAiso, probably due to the relative decrease of cellulolytic bacteria, was revealed. Therefore, it is tempting to speculate that the reduction of DMA can be related with this group of bacteria. As BCFA have been described as a diagnostic tool of rumen fermentation pathway (Vlaeminck et al., Reference Vlaeminck, Fievez, Cabrita, Fonseca and Dewhurst2006), thus the DMA composition derived from plasmalogens may have the same role, as also proposed by Alves et al. (Reference Alves, Santos-Silva, Cabrita, Fonseca and Bessa2013). Previous studies proposed that the vinyl ether origin by conversion of a FA via an alcohol intermediate, following a different way than the aerobic pattern in which the vinyl ether bond is formed at an early stage of the plasmalogen biosynthesis (Goldfine, Reference Goldfine2010).
Ruminants harbor diverse and dense microbial populations in the rumen, which is essential for the bioconversion of feeds that are otherwise indigestible for the host digestive system. Microbial BH process may accumulate a wide range of intermediates (Palmquist et al., Reference Palmquist, Lock, Shingfield and Bauman2005), including rumenic acid, which is reduced to VA and finally to 18 : 0.
The main bacterial species identified involved in the BH process belong to the Butyrivibrio group, which includes the genera Butyrivibrio and Pseudobutyrivibrio (Paillard et al., Reference Paillard, McKain, Chaudhary, Walker, Pizette, Koppova, McEwan, Kopecny, Vercoe, Louis and Wallace2007) and phylogenetically related bacteria (Devillard et al., Reference Devillard, McIntosh, Duncan and Wallace2007). Both these genera were not affected by hemp and linseed supplementation. Despite this result, a different BH pathway between hemp and linseed group was observed. These findings confirm the recent in vivo studies (Belenguer et al., Reference Belenguer, Toral, Frutos and Hervás2010; Huws et al., Reference Huws, Kim, Lee, Scott, Tweed, Pinloche, Wallace and Scollan2011; Shingfield et al., Reference Shingfield, Kairenius Äröla, Paillard, Muetzel, Ahvenjärvi, Vanhatalo, Huhtanen, Toivonen, Griinari and Wallace2012; Castro Carrera et al., Reference Castro-Carrera, Toral, Frutos, Mcewan, Hervás, Abecia, Pinloche, Girdwood and Belenguer2014), which have suggested a lower relevance of Butyrivibrio and Pseudobutyrivibrio species in ruminal BH than initially thought. Plasmalogens are found in many strictly anaerobic bacteria including most species of Clostridium, Lachnospira, and Butyrivibrio (Goldfine, Reference Goldfine2010), but are not present in aerobic or facultative anaerobic bacteria. In the present work, linseed supplementation reduced significantly the level of Prevotella spp. and DMA, so we speculate a possible role of this phylum on plasmalogens synthesis. To our knowledge, this is the first time that the effect of lipid supplementation on DMA synthesis has been reported in goat, so more investigations are needed to understand the role of Prevotella on this pathway of rumen lipid metabolism.
Data of Tables 4 and 5 showed that DMA and DME represent about the 15% of total FA+DMA+DME. This result was considerably higher than data reported by Alves et al. (Reference Alves, Santos-Silva, Cabrita, Fonseca and Bessa2013) (0.86%). Similar result was observed by Saluzzi et al. (Reference Saluzzi, Stewart, Flint and Smith1995), which reported that DMA represent about 15% of total FA+DMA in microbial fraction isolated from the rumen. This large difference may be related to the type of rumen samples. In fact, it is important to consider that in whole rumen content DM, the microbial DMA concentration would be more diluted by the higher amounts of indigested feed than in liquid phase DM. Data reported by Alves et al. (Reference Alves, Santos-Silva, Cabrita, Fonseca and Bessa2013) refer to the whole rumen content, whereas our results were obtained from very aqueous rumen fluid, collected by aesophageal probe. Unfortunately, few works on DMA exist in literature and not even one about goat, so more investigations are needed to understand this variability in rumen.
In conclusion, supplementation of feed with different lipid source had relevant effect on biodiversity of ruminal bacterial community in goat. These changes had relevant repercussion on lipid metabolism of rumen, especially on BH and plasmalogens synthesis. The effect of diet on ruminal population and its metabolism is very important to define milk composition by the modulation of FA with particular interest for milk quality.
Acknowledgments
The authors are thankful to Dr Christian Mallo (IBBA-CNR) for his assistance in animal care. This research was supported by the Agreement Regione Lombardia – National Research Council (CNR), Project FilAgro ‘Strategie Innovative e sostenibili per la filiera agroalimentare.’
Supplementary material
To view supplementary material for this article, please visit https://doi.org/10.1017/S1751731117003433