

INTRODUCTION
South Los Angeles has long been a place of both deep roots and profound change. From the Japanese and European farmers who settled in Watts in the early 1900s, to the Black migrants fleeing the Jim Crow South in the early and mid-twentieth century, to the Latin American immigrants escaping turmoil in their home countries in the 1980s, people have historically come to South LA looking to make a new home and forge a brighter future. At the same time, it is a place constantly in flux: once ranches and farmlands, then suburbs for a burgeoning White working class, and then the beating heart of Black Los Angeles, it is now a blended Black and Latino space in which residents and families live, work, and play together, sometimes warily and sometime warmly.
That most recent transformation in South Los Angeles—from being nearly eighty percent Black in 1970 to two-thirds Latino today—has received some degree of academic and journalistic attention. Unfortunately, however, much of the writing on South LA has seemed trapped in tropes of the past, with a focus on intergroup tensions in schools, neighborhoods, and local politics. Such an emphasis is understandable for two reasons: first, conflict is often more interesting than collaboration and, second, much of the past work has covered earlier periods in which demographic change was most dramatic, economic stress was most severe, and gang activity and over-policing were at their respective heights (Martinez Reference Martinez2016; Vargas Reference Vargas2006). But time has moved on and what has often been overlooked—with some exceptions (Johnson Reference Johnson2013; Rosas Reference Rosas, Pulido and Kun2014; Kun and Pulido, Reference Kun and Pulido2014)—are the quotidian accommodations between Black and Brown residents that have emerged. Often missed as well is the emergence of Latino and African American citywide political cooperation that has had a major impact on the resurgence of progressive politics in Los Angeles (Pastor and Prichard, Reference Pastor and Prichard2012).
What, however, has this recent era of demographic transformation meant for Black residents of Los Angeles? After all, Black-Brown unity may be a new source of political strength but there is no denying that what was once considered to be Black space is becoming something else. Signs in Spanish are one signal of change, but they are just the tip of an iceberg in which landlords may prefer to rent to Latinos, school meetings are more likely conducted in Spanish than in English, and job competition is real. Commentators like Erin Aubrey Kaplan (Reference Aubrey Kaplan2017) have written convincingly about the sense of Black loss and worries about erasure in South Los Angeles, particularly given that the city itself has never been majority Black. Moreover, this was hard-won space; much of South LA was once off-limits to African Americans because of racially restrictive covenants. Furthermore, some of the early writing at the time that the Latino growth was first acknowledged seemed to carry a sort of “triumphalist” tone of ethnic succession (Hayes-Bautista and Rodriguez, Reference Hayes-Bautista and Rodriguez1994).
This article examines the demographic changes of the last several decades and specifically focuses on the reaction of local Black residents to this ethnic transformation. We offer below a brief historical and statistical account of the change, but we also draw on a large multiyear study in which we interviewed 100 Latino residents, twenty-five Black residents, and nearly thirty local civic leaders. In other work (Pastor et al., Reference Pastor, Hondagneu-Sotelo, Alejandro, Stephens, Carter and Thompson-Hernandez2016), we have focused on the Latino experience—particularly the difference between the early arrivals in South LA and the Latino youth who grew up there—but here we focus on the way this change was experienced by Black residents and a select range of local civic leaders.
As we will see, the interviewees suggest that there was resentment and distrust around jobs and other issues, particularly in the early years, but they also report a sense of solidarity that has become stronger over time.Footnote 1 This suggests that simple narratives of Black-Brown conflict as inevitable (for example, Vaca Reference Vaca2004) may be misleading and that more optimistic visions of cross-racial community-building may capture an often underrecognized part of the experience (Jones Reference Jones2018; Molina et al., Reference Molina, HoSang and Gutiérrez2019; Rosas Reference Rosas, Pulido and Kun2014). However, resident mutuality and notions of shared fate are uneven, and where it has occurred, community-based organizations have played a central role in creating a new consciousness. This consciousness has largely tried to complement racial identity with spatial (or place) identity, offering a new understanding—that is, new meaning—to what it means to be a resident of South LA. At the same time, such a place identity runs the risk of another erasure—and effective Black-Brown organizing needs to acknowledge the centrality of the Black experience and struggles against anti-Black racism to the meaning imbued in this neighborhood.
This article begins with a brief history of South LA, grounding the reader in both the long-term trajectory and the last few decades that saw an upsurge in the Latino population. We then provide a statistical profile of those decades and the contemporary situation, weaving together data and comments from our interviews with Black residents of South LA. We discuss the reaction to a rapid demographic change that contributed to a sense of displacement, particularly given the economic precarity of the Black population. We contextualize this in a larger sense of Black loss that is itself the result of centuries of asset-stripping. We discuss how politics has changed in South LA—most of the newer and more dynamic groups embody a brand of Black-Brown politics framed around place identity as an important complement to racial identity—and we suggest how that can also feel disorienting and contribute to a feeling of erasure. We close by discussing what it means to create and ground Black futures in what is now a Black-Brown political and social space.
DECADES OF CHANGE
In 1913, W. E. B. Du Bois visited Los Angeles and declared that its Black population was “without doubt the most beautifully housed group of colored people in the United States” (as cited by Hunt and Ramón, Reference Hunt and Ramón2010, p. 12). It is not surprising that Du Bois was so impressed: while discriminatory real estate practices limited exactly what properties could be purchased, by 1910, forty percent of African Americans in Los Angeles were homeowners—compared to only 2.4 percent of African Americans in New York City and eight percent in Chicago (Sides Reference Sides2006). Unfortunately, the employment side of the equation was not so encouraging. Most Black women worked in domestic service while men frequently worked as railroad porters, barbers, janitors, chauffeurs, and waiters (Robinson Reference Robinson, Hunt and Ramón2010). Nonetheless, some observers have described this era as something of a “golden era” for African Americans (Kun and Pulido, Reference Kun and Pulido2014), although some of the relative position of African Americans in Los Angeles was likely because their small numbers were not enough to not constitute a significant threat to White residents, whose racial attacks were more focused on Mexicans, Chinese Americans, and Japanese Americans.Footnote 2
In the 1920s, African Americans built strong communities and institutions just south of downtown Los Angeles, an area to which they were largely confined because of racist housing policies. Central Avenue emerged as “the primary artery of black life, and the intersection with 12th Street remained the center of things…” (Flamming Reference Flamming2005, p. 261). In fact, the area was racially mixed: Black residents joined Mexicans, Filipinos, Italians, and other groups who packed into Central Avenue in an array of housing that ranged from well-tended bungalows to dilapidated shacks. But it was in this corridor that Black-owned businesses and buildings—which were to become famous as markers of Black cultural life in Los Angeles—sprung up, including the Lincoln Theater in 1926 and the Somerville Hotel. The latter was built in 1928 for the National Association for the Advancement of Colored People (NAACP) convention. Renamed the Dunbar Hotel in 1930, it became the West Coast entertainment mecca and resting place for Black performers and elites who were racially barred from other hotels.
Even as the Central Avenue corridor emerged as a center of Black culture and influence, the pastures and farmlands of the broader South LA area were undergoing a different transformation. As manufacturing came to Southern California, housing for the growing White working class was in demand. In response, Los Angeles developers sought to capitalize on the demand by crafting a new set of industrial suburbs that were close to employment, far from the city center, and that shielded residents from people of color through race-restrictive covenants and racially discriminatory real estate practices. Compton, South Gate, and Huntington Park, among other municipalities that adjoined the city of Los Angeles, were kept nearly all White as well as adjoining parts of the City of Los Angeles (Nicolaides Reference Nicolaides2002).
The ability to house workers and segregate them by race was strained when manufacturing employment skyrocketed during WWII due to government contracting. During the second wave of the Great Migration, thousands of Black migrants from the South, especially from Texas and Louisiana, came to Los Angeles seeking jobs in wartime munitions plants, which later transitioned to automobile, tire, and steel jobs that were primarily in or near South LA. The incorporation of Black workers was a new development; prior to the war, discrimination in manufacturing against Black jobseekers was rampant. But wartime necessities broke down those barriers and had lasting results: “At its high water mark in 1960, twenty-four percent of employed African American men and eighteen percent of employed black women in Los Angeles worked as manufacturing operatives,” a trend which helped to create a form of economic stability for some African Americans in South LA and elsewhere in Los Angeles County (Sides Reference Sides2012, p. 35).
During the period of rapid wartime in-migration, the limited housing stock made available for Black residents became apparent. As historian Josh Sides (Reference Sides2006) notes, “(d)uring WWII, fifty thousand new residents packed into the prewar boundaries of Central Avenue, ten thousand new residents moved to Watts, and seventy thousand crowded into Bronzeville/Little Tokyo” (p. 98). The mayor of Los Angeles at the time, Fletcher Bowron, tried to meet demand during and after the war by promoting public housing; however, at the time public housing was portrayed as largely serving minorities and socialist in nature (Sitton Reference Sitton2005). While some public units were built during that time (including Jordan Downs in Watts) Bowron eventually lost his mayoral seat and housing production once again reverted mostly to the private market.
In 1948, the Supreme Court ended the government enforcement of racially restrictive covenants in the Shelly v. Kramer decision, partially opening up the housing market to African Americans (Robinson Reference Robinson, Hunt and Ramón2010). Of course, real estate agents still practiced steering, often reinforced by professional associations and local governments. But with the Black population on the rise, it became harder and harder to block off large parts of Southern California and in the 1950s, the Black middle class began to move out to other neighborhoods, including Compton—the once White working-class suburb south of downtown Los Angeles—and West Adams, a wealthy area filled with large mansions and other desirable housing stock. And as a result, school populations shifted: “The three large South Central city high schools, Jefferson, Fremont, and Jordan, which had been multiethnic, became almost exclusively black in the two decades after WWII” (Sides Reference Sides2006, p. 114).
Despite some increased residential mobility, the growing Black population continued to face discrimination and exclusion that contained the community in certain neighborhoods. Tensions about long-lasting economic and social inequities boiled over in 1965 in the form of the Watts Rebellion. Prompted by the contentious drunk driving arrest of a Black motorist in Watts, the widespread riots also reflected rampant problems extending beyond police brutality to include employment and housing discrimination. When the dust settled days later, thirty-four people were dead, roughly 1,000 were injured, and there had been nearly $40 million worth of property damage. But this was not the only effect of the Watts Rebellion: it catalyzed a wave of White flight that allowed for the Black population to spread out geographically. By the 1970s, the Black population spanned as far west as Baldwin Hills and the area we now call South LA was roughly eighty percent Black.
Perhaps all of this could have led to a sort of Black renaissance in Los Angeles, with a strong geographic base providing a launching pad for the sustained Black progress that Du Bois had originally envisioned. Signaling how a coherent geographic base could facilitate civic voice, in 1973, voters elected Tom Bradley, a South LA resident and the first-elected Black mayor of a largely White major U.S. city. Bradley’s success was attributable primarily to a combination of strong Black support, ties to a Westside Jewish community that had also been excluded from the governance circles of Los Angeles, as well as alliances with the growing Latino and Asian populations (Sonenshein Reference Sonenshein1993). But just as the politics seemed to be shifting, the economic foundation of South LA was crumbling under the pressures of deindustrialization. While this was a national and regional phenomenon, pressures for African Americans were (as usual) felt even earlier: “After climbing steadily for two decades, the proportion of the black male workforce employed as operatives in manufacturing firms began to fall in the 1960s, and the absolute employment of black men in manufacturing dropped in the early 1970s” (Sides Reference Sides2006, p. 180).
As the 1970s gave way to the 1980s, the area became, in the words of one civic leader we interviewed, not the base for a Black renaissance but the “capital of Black misery.” Fueled by economic despair, the crack cocaine epidemic burst onto the national and local scene (Banks Reference Banks2010). Narratives around drug dependency and increases in crime and gang violence were weaponized to increase law enforcement presence in the neighborhood, creating rising tensions between law enforcement and residents in South LA. In this period, South LA gangs became a “favorite topic of news stories, television programming, and Hollywood movies, both entertaining and frightening people all over the nation and around the world” (Robinson Reference Robinson, Hunt and Ramón2010, p. 50).
Police were often as threatening to residents as the gangs, a fact made clear in 1988 when eighty-eight LAPD officers raided two apartment buildings on 39th St. and Dalton Ave., just west of Memorial Coliseum. Intended as a show of force, the police smashed furniture and sprayed graffiti. According to reporting by the Los Angeles Times:
Dozens of residents from the apartments and surrounding neighborhood were rounded up. Many were humiliated or beaten, but none was charged with a crime. The raid netted fewer than six ounces of marijuana and less than an ounce of cocaine. The property damage was so great that the Red Cross offered assistance to 10 adults and 12 minors who were left homeless (Mitchell Reference Mitchell2001; also see Davis Reference Davis1990 for more on the raid).
Tensions between the police and community came to a head with the videotaped beating of Rodney King in March 1991 and exploded into civil unrest in April 1992, when a jury acquitted the officers accused of beating King.
Together, these various phenomena—the pervasiveness of unemployment, the crack epidemic, and the rise of gang and police violence—led to a new migration: the flight of middle-class and working-class African Americans from South LA. Many of these families had provided an economically stabilizing presence but were now eager to provide a safer environment for their children (Pfeiffer Reference Pfeiffer2012). By the 1990s, African Americans were moving to “the northern reaches of the county in Palmdale and Lancaster, and east into Riverside County” (Sides Reference Sides2012, p. 3). The eastern environs were especially popular: the Black population in Fontana, Rialto, Victorville, and Moreno Valley (all in the Inland Empire, a collection of two counties to the east of Los Angeles) grew sixfold between 1980 and 2000 (Pastor et al., Reference Pastor, Lara and Scoggins2011).
As Paul Robinson (Reference Robinson, Hunt and Ramón2010) notes, this outmigration in the 1980s and 1990s made room for Latino in-migration. While the presence of Latinos in South LA was not an entirely new phenomenon, Mexicans in Los Angeles County had long been concentrated in Boyle Heights, East Los Angeles, and parts of the San Gabriel and San Fernando Valleys (Camarillo Reference Camarillo, Foner and Fredrickson2004, Reference Camarillo2007). In the 1980s, the economic crises in Mexico and civil wars in Central America increased migrant inflows to Los Angeles and traditional entry points became oversaturated; as a result, more immigrants moved directly to South LA (or eventually landed there after a quick stay in more common landing spots). Figure 1 illustrates the respective shifts in the immigrant and U.S.-born population in South LA over this period, particularly the surge in the 1980s.
Population Growth by Nativity, South LA, 1980–2016
Source: U.S. Census Bureau, Geolytics Inc.
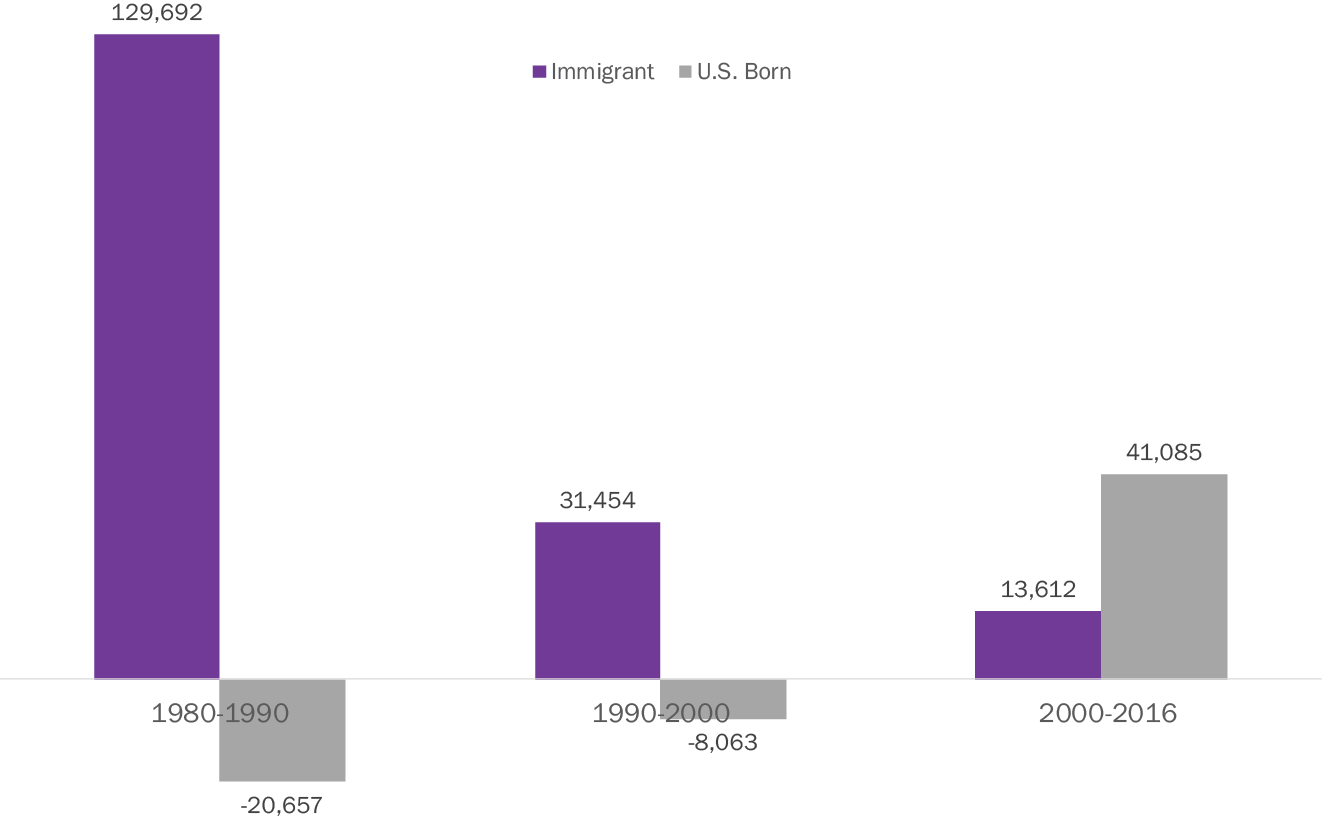
Much of this demographic change seemed to fly under the media radar until the 1992 civil unrest. While the media cast the civil unrest as a primarily Black affair, Latinos actually constituted slightly more than half of those arrested (Pastor Reference Pastor1995). Indeed, in South LA, where most of the damage occurred, Latinos were around forty-five percent of the population, up from around twenty-three percent in 1980.Footnote 3 Yet as Los Angeles’ Latino political leaders (mostly based in the Eastside) scrambled to understand what happened, they came face to face with a striking fact: Despite the dramatic demographic changes, there were virtually no Latino-based civic organizations in South LA that could contribute to a discussion of the rebuilding process.
The general lack of Latino civic infrastructure persists but what has emerged—partly from the devastation of 1992 and the rethinking it provoked—are new forms of interethnic community advocacy and mobilization. Formed before the civil unrest, a group called the Community Coalition (initially led by now-Congresswoman Karen Bass) developed a distinctly Black-Brown model of neighborhood community engagement, with an initial focus on abatement of liquor stores as environmental nuisances (Sloane Reference Sloane and Sides2012). After the unrest came the formation of Action for Grassroots Empowerment and Neighborhood Development Alternatives (AGENDA)—now called Strategic Concepts in Organizing and Policy Education (SCOPE)—which worked to bring together Black and Latino residents, developing and winning campaigns for workforce development (Pastor and Prichard, Reference Pastor and Prichard2012). All of this occurred alongside a more general revival of organizing, particularly among immigrants and workers, in contemporary Los Angeles (Milkman Reference Milkman2006).
Of course, as one astute historian of Black Los Angeles notes, “(s)uccessive waves of Latin American, Asian, and European immigrants ensured that the black freedom struggle would develop in a strikingly multiracial context” (Sides Reference Sides2006, p. 6), implying that the evolution of Black politics to a Black-Brown frame is not altogether surprising. Indeed, some of LA’s earliest Black civic icons, such as Charlotta Bass, publisher of the California Eagle and one-time president of the Los Angeles NAACP, were well-known for their alliances with Mexican communities, including drumming up Black support for the dozens of Mexican youth charged in the racist Sleepy Lagoon trial of 1943 (Freer Reference Freer2004; Gottlieb et al., Reference Gottlieb, Freer, Vallianatos and Dreier2006). Subsequent citywide struggles, such as the joint efforts of Concerned Citizens of South Central and Mothers of East LA to resist an incinerator being placed between South and East LA, speak further to the history of collaboration between Latinos and African Americans.
But the fact that Black political power in South LA now requires Latino as well as African American participation is a cause for consternation among some residents and civic leaders. After all, it was a tough battle to secure Black civic voice in the first place and seeing it diluted by the compromises that broader coalition building suggests can seem challenging. To get a better sense of the civic terrain on which this tension is being navigated by leaders and residents alike, we provide below a deeper picture of the recent demographic transition, drawing on both a statistical analysis of the trends and the voices of local residents.
UNDERSTANDING SOUTH LOS ANGELES
Geography and Methodology
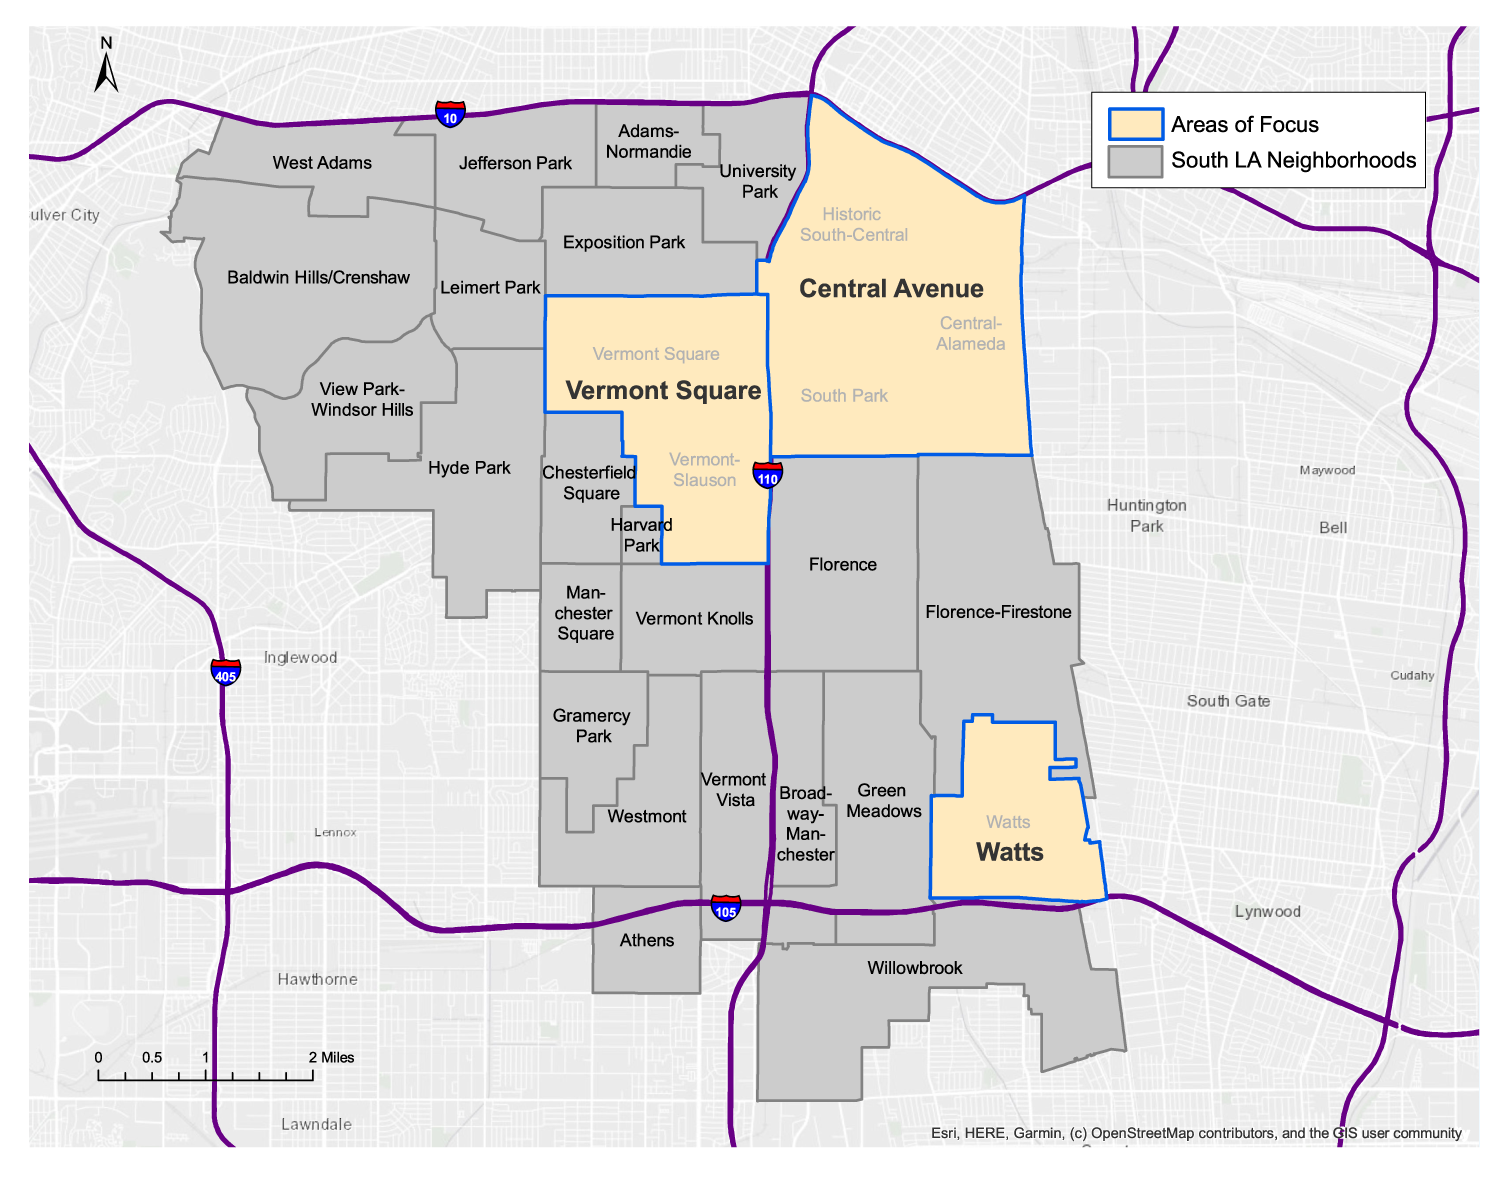
In the historical overview above, we offered no specific definition of South LA, mostly because the definition and boundaries have changed over time. Indeed, even the nomenclature associated with the neighborhood has changed: long referred to as South Central, the area (or at least the part of it in the City of Los Angeles) was renamed as South LA in 2003 through official City designation. While the name has mostly been adopted by the community at large, it is worth noting that many residents wishing to uphold the complex history of the neighborhood still prefer South Central. Here, we sidestep that debate and use the contemporary terminology of South LA, utilizing the geographic boundaries defined in the Los Angeles Times neighborhood mapping project: Mapping LA.Footnote 4 It important to note that in that project and here, South LA is generally meant to include unincorporated areas of LA County (such as Florence and Athens) that are not part of the City of Los Angeles but are encapsulated in the broader community.
Working with this definition, the first thing one realizes is that South LA is actually a large and complex area, comprising more than fifty square miles and including twenty-eight smaller neighborhoods (see Figure 2). Those neighborhoods can be dramatically different. For example, View Park-Windsor Hills on the western edge of South LA is more affluent than, say, Athens; Hyde Park, also on the westside, is far more African American than Florence. In the larger project from which this article is drawn, we actually focused our on-the-ground data collection on three neighborhoods in the City of Los Angeles: the historical South Central neighborhood, a place that is now nearly ninety percent Latino, and the Vermont Square and Watts neighborhoods, both of which have demographics that roughly mirror the broader South LA area (but with different trajectories in terms of the nature of local community organizing). We make less of the neighborhood distinctions in this piece, but it was one way to design a more coherent and efficient data collection process.
Map of South LA Neighborhoods
Source: Los Angeles Times mapping project. http://maps.latimes.com/neighborhoods/
In what follows we draw from that on-the-ground work as well as a variety of more common data sources. For example, we used historical data from the Decennial Census for earlier decades and summary data from the 2012–2016 American Community Survey (ACS) for the current period. We also analyzed ACS microdata, using a pooled 2012–2016 version available from the Integrated Public Use Microdata Series (Ruggles et al., Reference Ruggles, Genadek, Goeken, Grover and Sobek2017). This allowed us to break the data down by more detailed demographic characteristics like nativity.Footnote 5 With a bit of work, we were even able to estimate legal status, helping to provide a sense of the experience of the undocumented population.Footnote 6
Because numbers tells us just part of the story, we supplement the analysis below with the results of an extensive field study in which our team conducted interviews with 100 Latino residents, twenty-five Black residents, and nearly thirty civic leaders from the area; the team also conducted ethnographic observations and roughly fifty interviews in parks and gardens (Hondagneu-Sotelo Reference Hondagneu-Sotelo2017). The Latino interviews were conducted almost entirely by co-ethnic researchers who grew up in or near the neighborhood (including one Afro-Latino interviewer) and were focused on two generations: those who arrived in the 1980s and 1990s wave we noted above and those who had grown up in South LA. In other work, we have noted that the older generation of immigrants arrived in a period of relatively high crime, a fact that also led them to shy away from many of their Black neighbors as they sought to seal themselves and their children from the persistent gang and police violence already impacting the Black community (Pastor et al., Reference Pastor, Hondagneu-Sotelo, Alejandro, Stephens, Carter and Thompson-Hernandez2016). On the other hand, a second generation of Latinos that grew up in South LA often have deep ties to the Black community and are working to build the sort of political unity that can, they hope, change conditions on the ground. For this second generation, the development of a place-based identity has helped facilitate Black-Brown organizing.
Our interviews with twenty-five Black residents were likewise conducted by a co-ethnic (that is, African American) researcher who grew up in the South LA area. As with the Latino respondents, the logic was that this co-ethnic and co-locational matching of interviewer with the interviewees was more likely to elicit honest responses to difficult questions. Because of the snowball sampling method used to collect interviews, the sample was drawn largely from Watts. While this can add a particular bias to the results—Watts has a highly specific history and its residents identify more specifically with Watts than the broader South LA neighborhood—it is also the case that this neighborhood has experienced demographic changes that roughly parallel the shifts in South LA as a whole. Because we did not have the resources to interview African Americans who left South LA—a population whose experiences could reveal more irreconcilable issues or tensions as a result of an influx of Latino residents—we are missing an important part of the picture, one that we hope is taken up by other researchers in the future. Nevertheless, we did ask questions about those friends and family that had left and received some informative responses that we thread in below.
Demographic Change Over Time
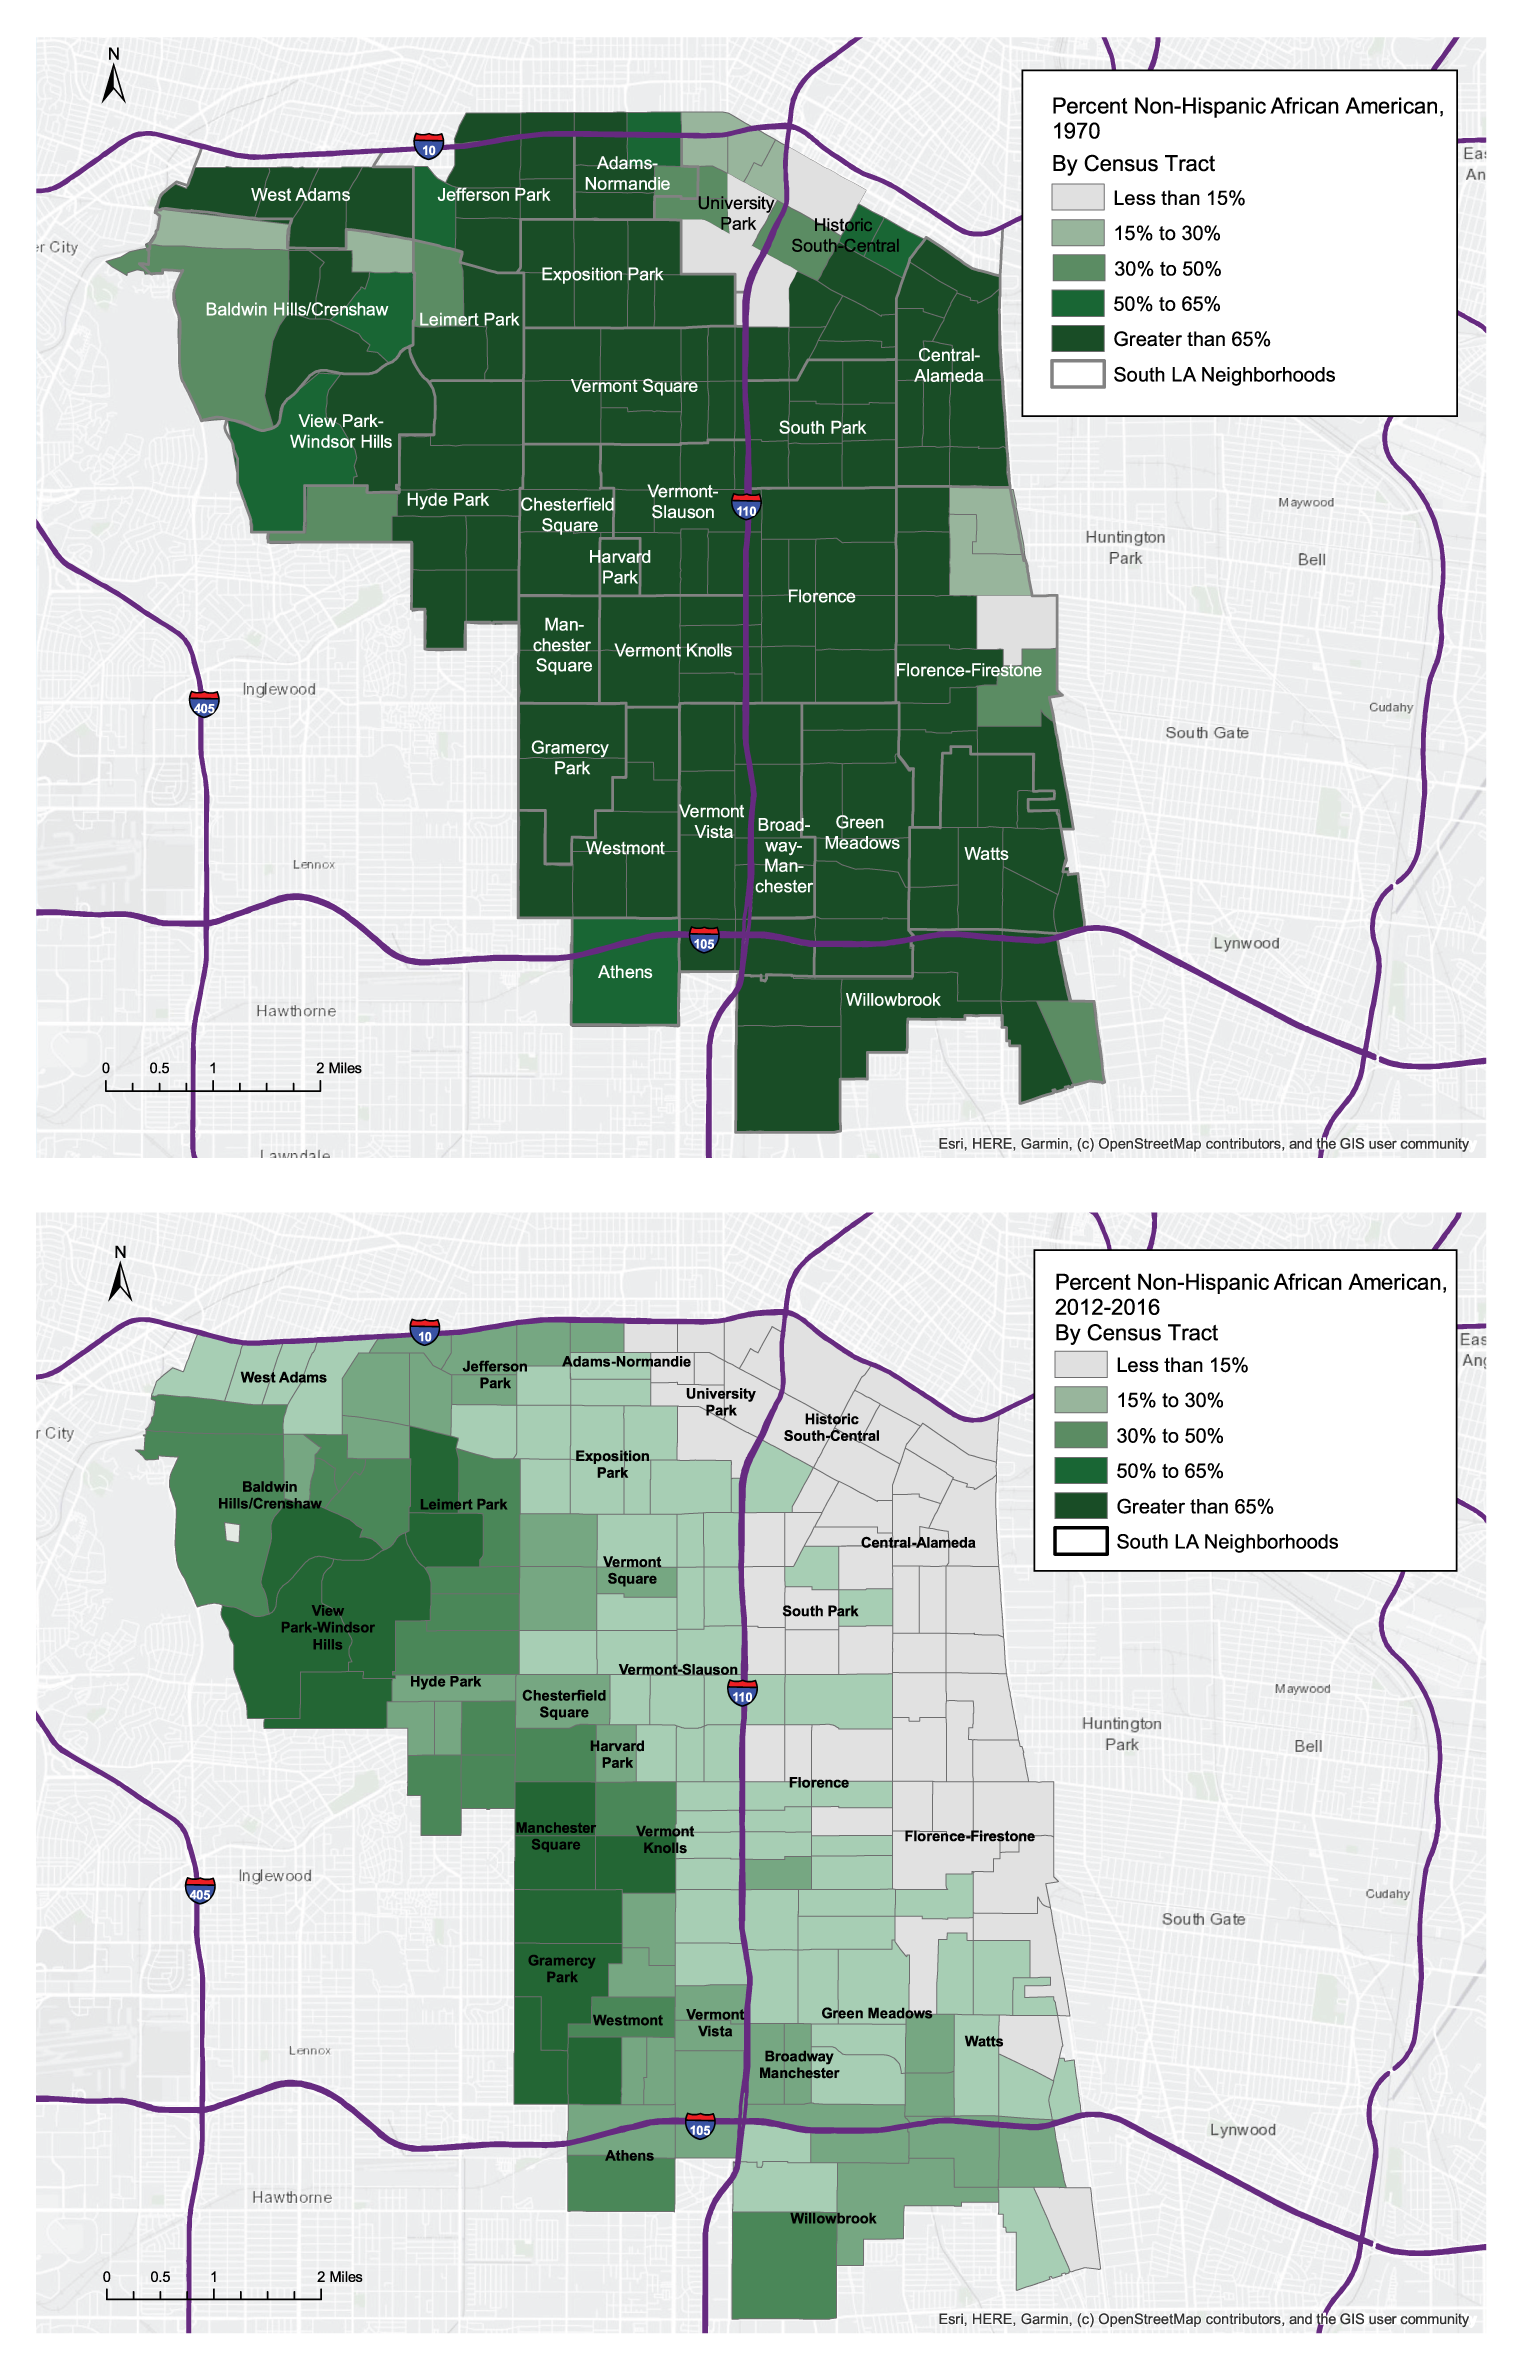
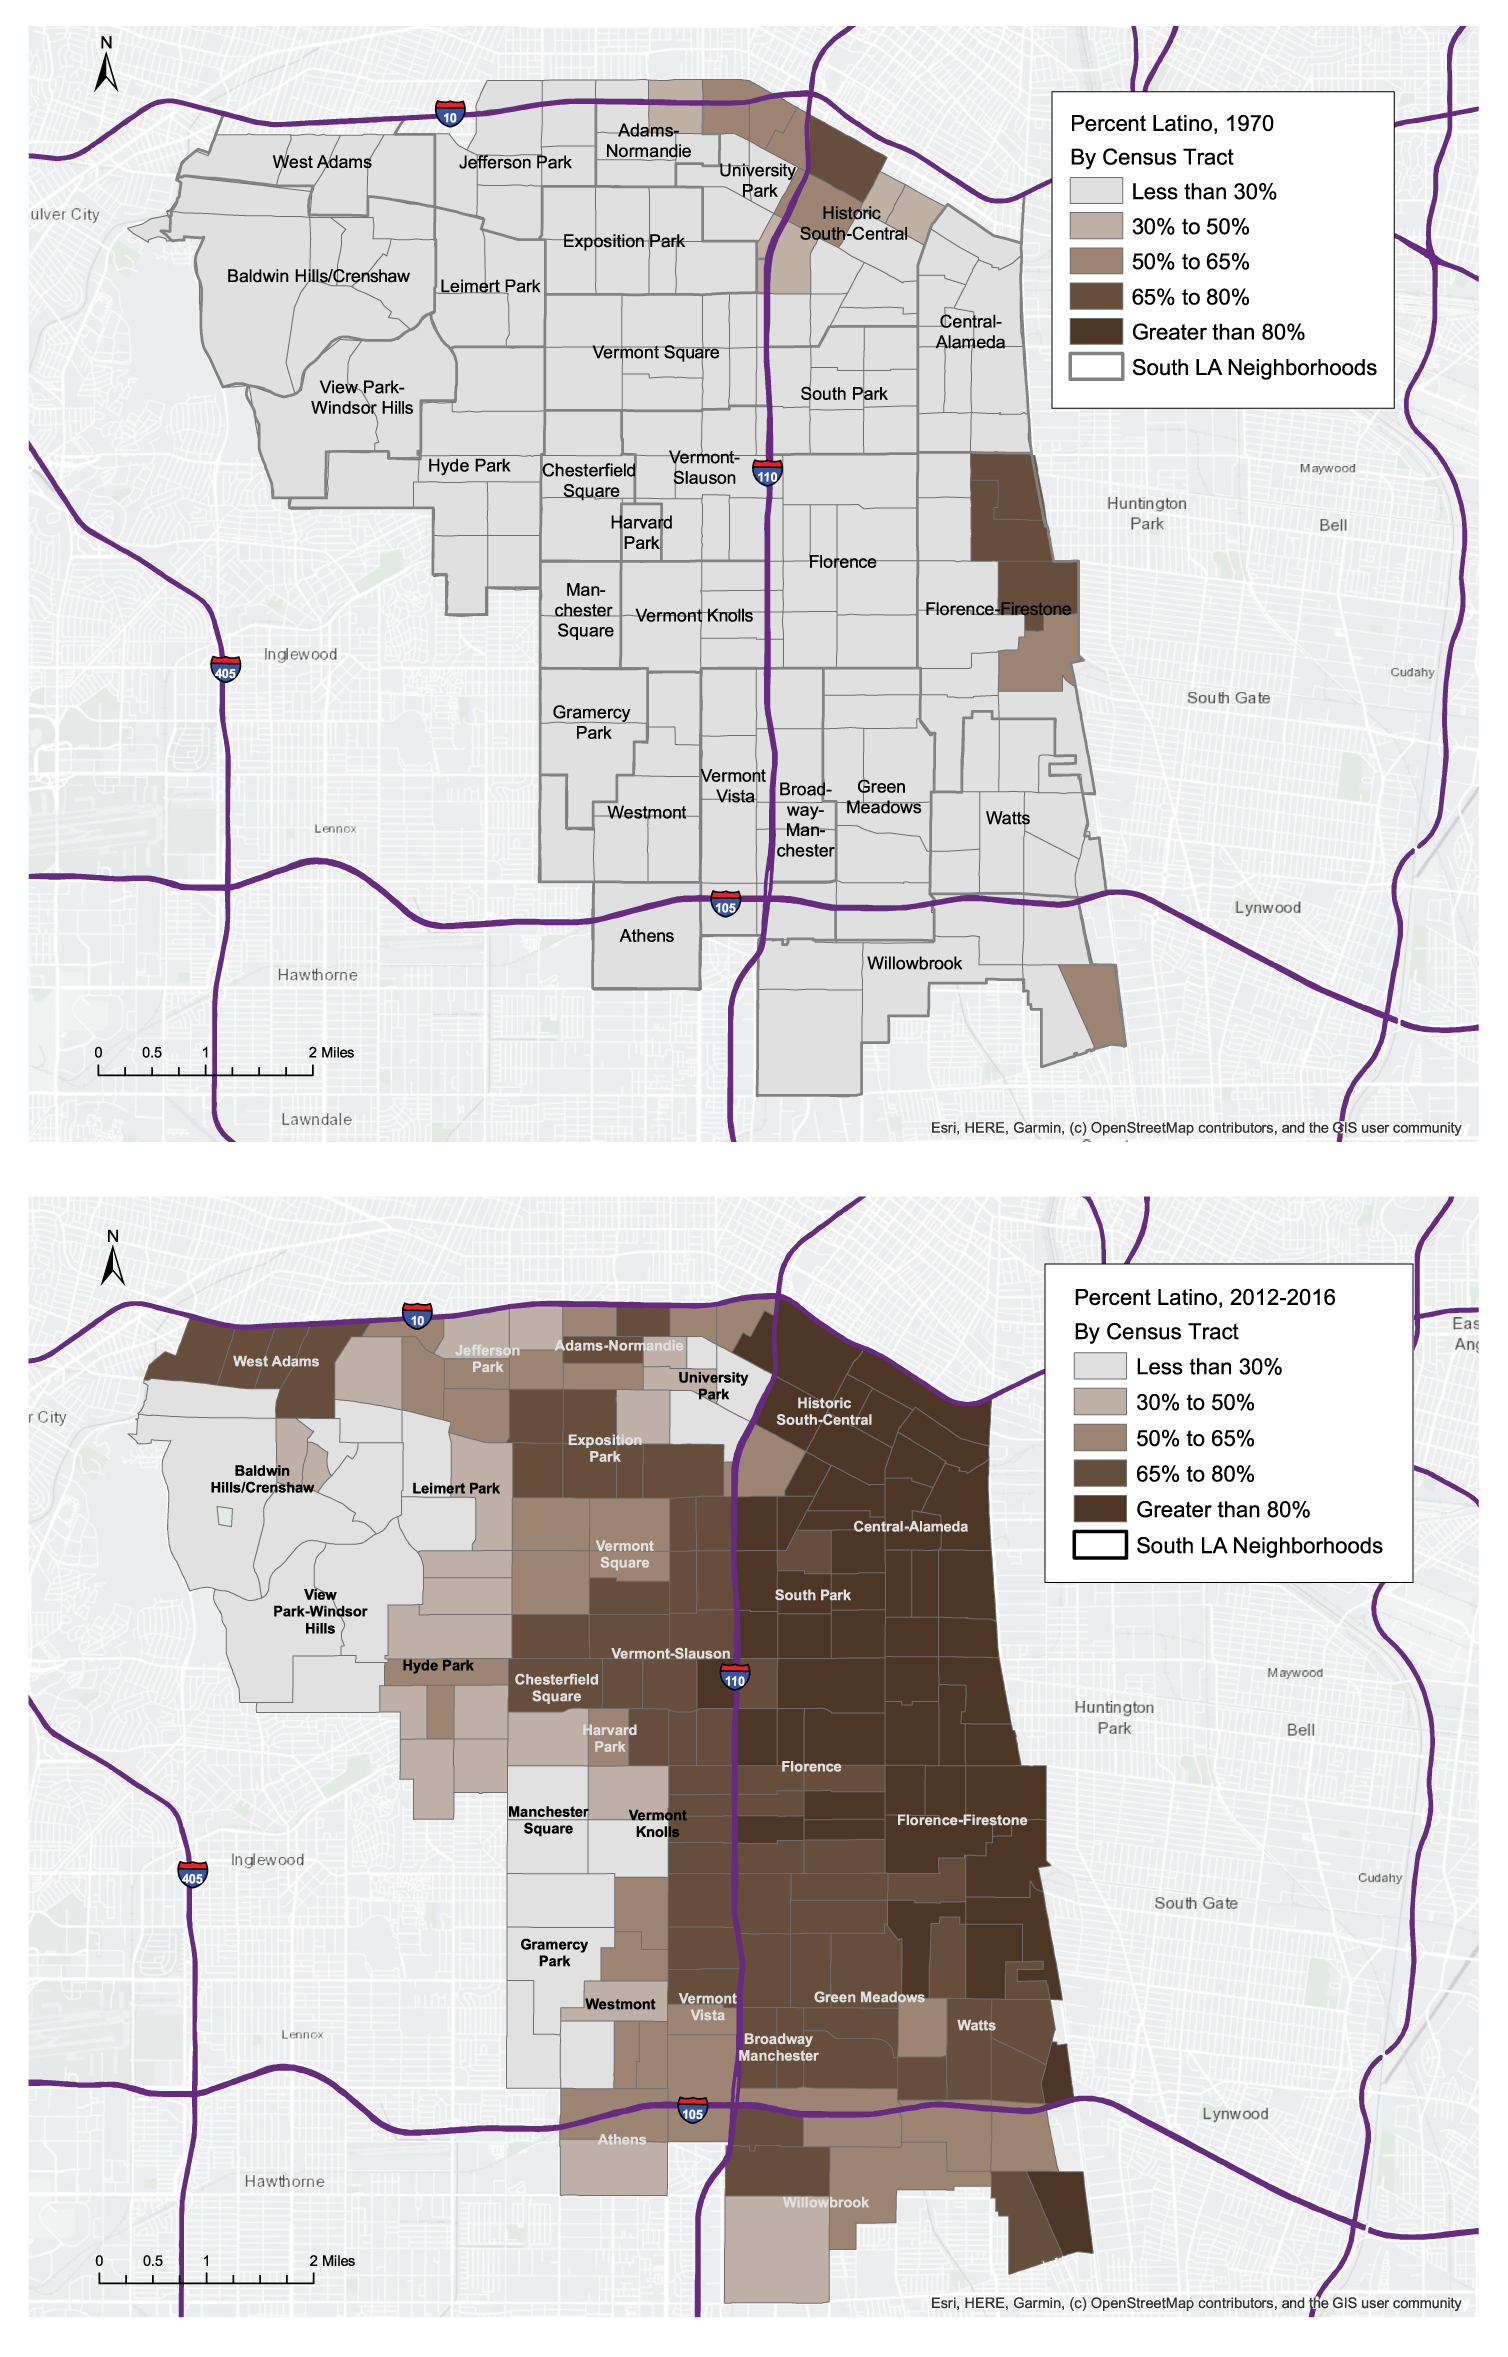
As noted above, one of the most striking trends in recent decades in South LA has been the overall growth of the Latino population. Nearly eighty percent Black in 1970, by 2010, South LA was sixty-four percent Latino, and by 2016 it was about two-thirds Latino.Footnote 7 Figure 3 and Figure 4 show the demographic transformation spatially and illustrate that it has been geographically uneven. Latinos have been moving into South LA from the north and east, where there are other established Latino communities (e.g., Pico Union, East LA, etc.). Neighborhoods that had a sizeable Latino population—like Central Avenue neighborhood that was already forty-five percent Latino in 1980—are now staggeringly Latino. But even some neighborhoods with relatively small Latino populations a few decades ago—like Vermont Square/Vermont-Slauson and Watts—are now majority Latino. On the other side of this phenomenon, in 1980 twenty-four of the twenty-eight neighborhoods in South LA were majority Black. According to the 2012-2016 American Community Survey, only six were still majority Black: Baldwin Hills/Crenshaw, Gramercy Park, Hyde Park, Leimert Park, Manchester Square, and View Park-Windsor Hills.
Maps of Percent African American by Census Tract, 1970 and 2012–2016
Source: U.S. Census Bureau, Geolytics Inc.
Maps of Percent Latino by Census Tract, 1970 and 2012–2016
Source: U.S. Census Bureau, Geolytics Inc.
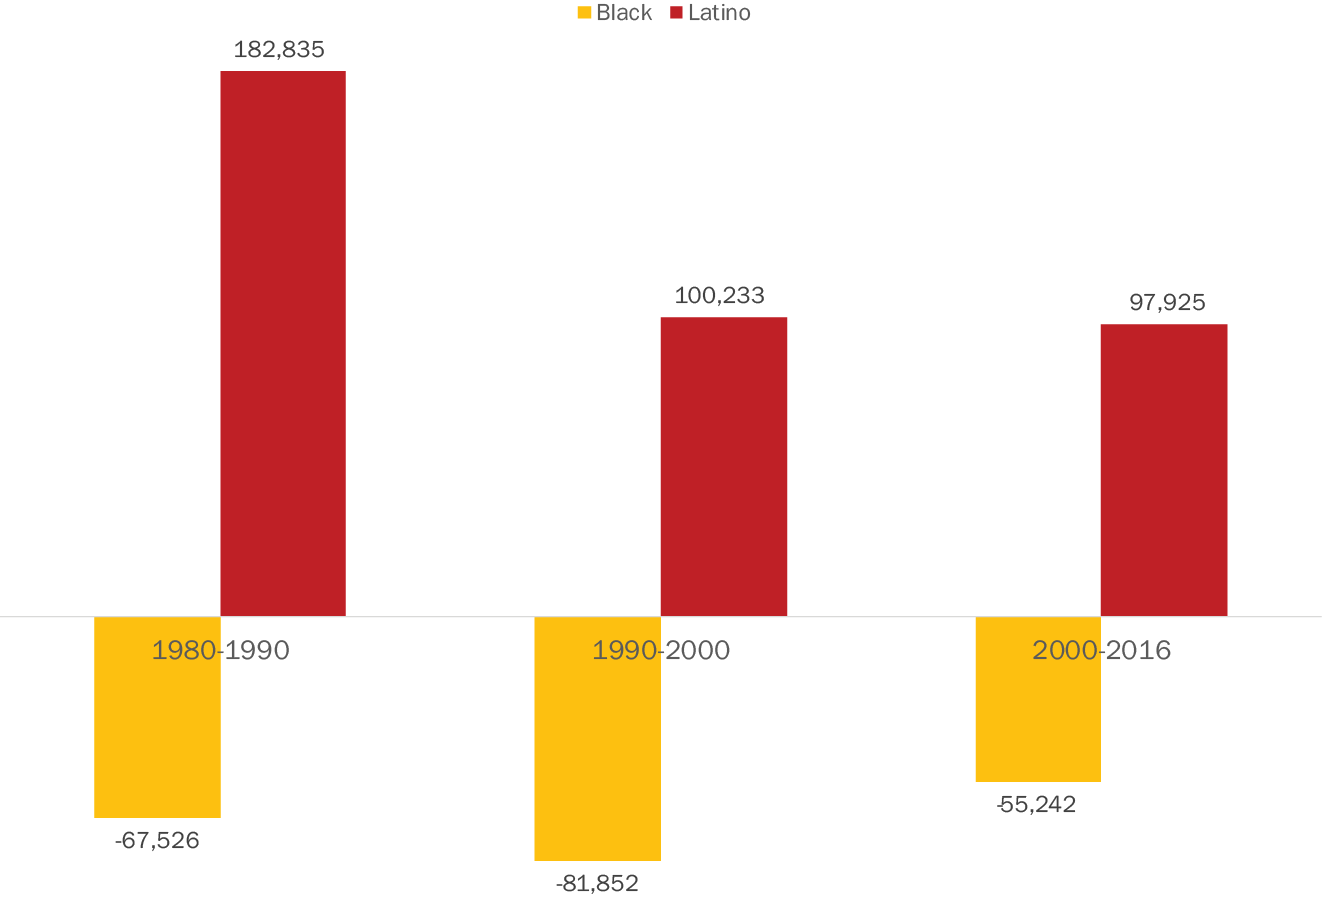
The demographic shifts in South LA are partly a function of countywide trends. After all, between 1980 and 2016, LA County’s Latino population more than doubled while its Black population declined by fifteen percent; in that light, it is not surprising that South LA (like the rest of LA) would become more Latino.Footnote 8 But it’s more than just a countywide phenomenon. Figure 5 shows that during the 1980s and 1990s, nearly 150,000 Black residents left South LA for the myriad of reasons mentioned earlier, resulting in a nearly forty percent decline between 1980 and 2016 (as compared to the aforementioned fifteen percent for the County). There was, in short, a dispersal of the countywide Black population: in 1980, nearly half (forty-seven percent) of African Americans in LA County lived in South LA compared to twenty-eight percent in 2016.
Decadal Population Growth by Race/Ethnicity, South LA, 1980–2016
Source: U.S. Census Bureau, Geolytics Inc.
The growth in the Latino population was partly a result of immigration as the share of immigrants in South LA doubled from eighteen percent in 1980 to thirty-five percent in the 2012–2016 period. The foreign-born population has now stabilized, a phenomenon typical of the broader Los Angeles area (Myers et al., Reference Myers, Pitkin and Ramirez2009) and, overall, South LA’s immigrant population increased by just five percent between 2000 and 2016.Footnote 9 What now drives change is the shift in the youth population. Between 1980 and 2016, the Black population under the age of eighteen in South LA fell by two-thirds while the Latino youth population grew by 170 percent (see Figure 6). This shift had its biggest impact on schools: while every one of the eight major public high schools in South LA were majority Black in 1981—with six being more than ninety percent Black—by 2016, only two of these high schools were majority Black and four of the eight were more than eighty percent Latino. As such, schools surfaced first as the primary sites for emergent tensions and later as part of place-based identity formations between Black and Brown youth of South LA, a topic we explore in the interview data below.Footnote 10
Change in Black and Latino Youth Population in South LA, 1980–2016
Source: U.S. Census Bureau, Geolytics Inc.

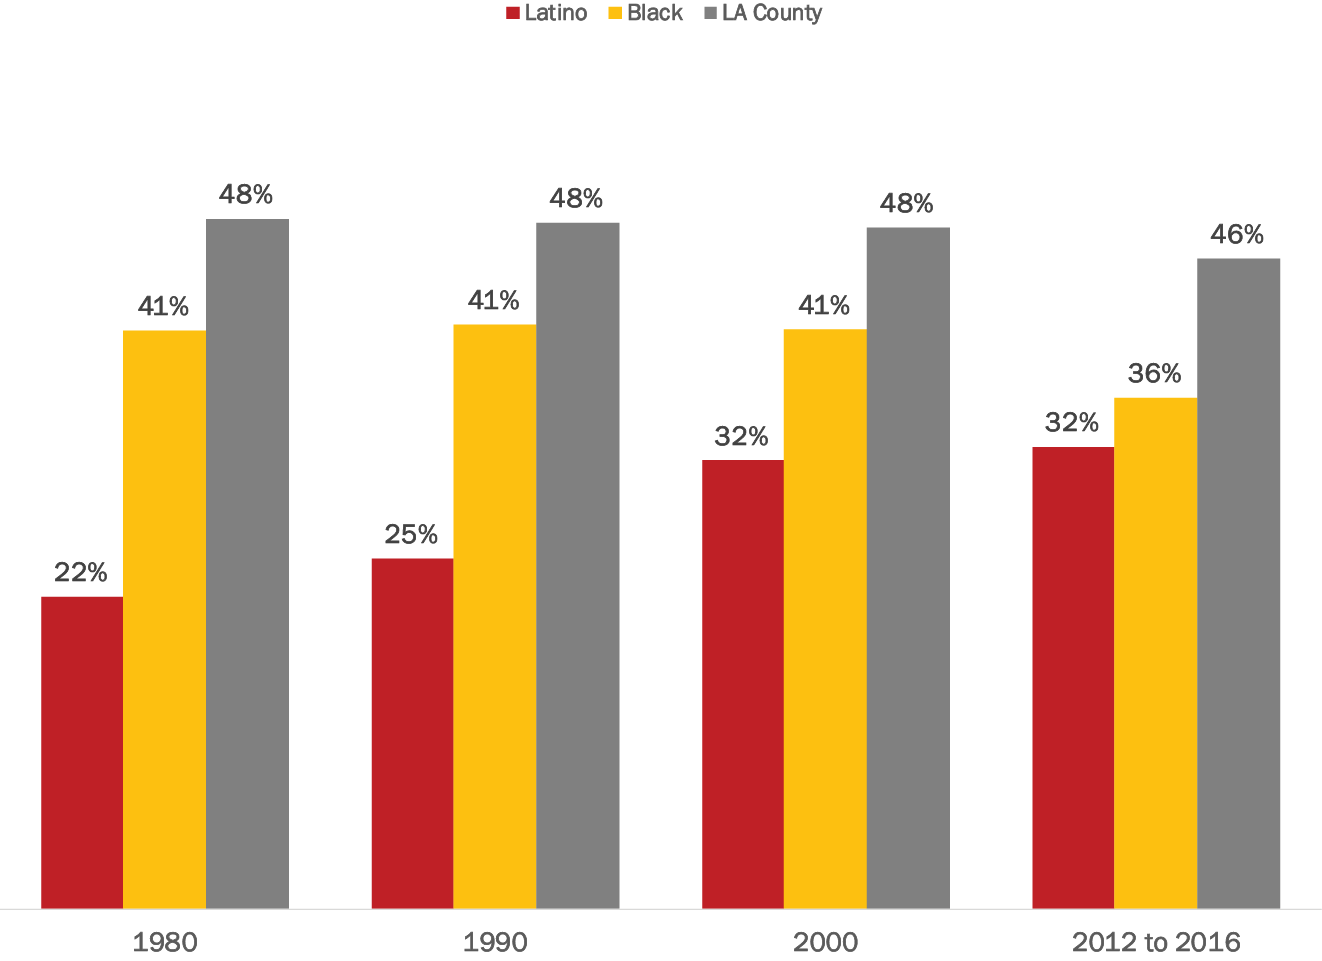
The growth in the Latino youth population reflects rooted family formations among Latino residents, a process further illustrated in changing rates of Latino homeownership in the neighborhood. As shown in Figure 7, over the past few decades, homeownership rates for Latinos in South LA have increased, although they are still lower than overall countywide rates. Through the 1980s and 1990s, Black homeownership rates remained relatively constant in South LA; the foreclosure crisis and economic recession, however, had a significant negative impact on Black homeownership in Southern California, including South LA (Leonard and Flynn, Reference Leonard and Flynn2012). An equally important feature of home ownership has to do with length of residence. As can be seen in Figure 8, fifty-nine percent of Black homeowners in South LA have been in their homes for twenty years or more (and forty-four percent for thirty years or more) while two-thirds of Latino homeowners have less than twenty years of residence. Moreover, the median age for Black homeowners in South LA is sixty-four while the median age for Latino homeowners is just fifty years old, suggesting that a generational dynamic—how older residents react to a burgeoning youth population—might be one factor in some of the conflicts that emerged in South LA as demographic changes first impacted the area.
Homeownership by Race/Ethnicity in South LA and LA County, 1980–2016
Source: U.S. Census Bureau, Geolytics Inc.
Black and Latino Homeownership by Length of Time in Residence, South LA and LA County, 2012–2016
Source: CSII analysis of 2012–2016 pooled IPUMS data.

Experiencing Demographic Change
So how did the Black residents we interviewed react to these changes in neighborhoods, schools, and home ownership? For some Black residents who have remained in South LA, there is a sense of living in a space that they sometimes see as catering to a newer demographic of people with a distinct and different culture, language, and identity. As a result, Black interviewees shared that they have experienced conflicts both with new neighbors and civic institutions that do not seem to serve either population adequately. As Kasi, a woman born and raised in South LA stated, “…putting people together in the same place does not bring racial reconciliation.”Footnote 11
Indeed, while many interviewees expressed positive feelings about their Latino neighbors (a theme we explore more below) others were either tepid or somewhat negative. Candice, a fifty-four year-old woman who has lived in South LA her whole life, simply said that Black and Latino neighbors rarely “bother” each other, noting that Latinos are “doing the same thing we doing, a lot of them—trying to make it.” She went on:
I mean, you know, like … everybody trying to keep a roof over their head, and I mean, you know, everybody doing about the same thing. We all got kids, and trying to make sure they all right, and doing the right thing out there. You know, you can’t follow them everywhere they go, but everybody’s—you know, everybody people.
On the other hand, some of the Black interviewees shared that they “know” that their Latino neighbors do not feel warmly towards Black residents; they sense hostility and express it back. For example, Jamaal, also a resident of Watts, pointed to what he saw as Latino rudeness, sharing that:
…you pump the community full of Latinos who have very few to any real relationship with Black people in America and a lot of them come over here and they have an issue with Black folks almost like we’re in their way or we did something to them.
Meanwhile, in the words of Raven, who has lived in Vermont Square for over a decade:
I’m not against them. I love them. I love everybody…but I’m saying some of them could be rude too…and I don’t understand that because this is not your area to do that, number one. You got to get registered and be legit and then talk to me. You know? This is South Central LA, not Tijuana.
Being “registered” speaks to the question of documentation and this is a real phenomenon in South LA. For a myriad of reasons—the spillover of the Central American population from Pico-Union, lower housing costs, and, as we suggest later, the way in which anti-Black policing may provide a sort of cover for Latino immigrants—the share of the Latino population that is undocumented is much higher than it is in the County as a whole.Footnote 12 While about eighteen percent of all Latino adults in the rest of Los Angeles County are undocumented, one third of Latino adults (and about forty-five percent of foreign-born Latino adults) in South LA are in that immigration limbo.
In any case, the perception of Latino hostility and prejudice as well as the sheer foreignness of the population can make it feel like home is no longer home. Eloise, a leader of a group organizing parents of school children notes that:
…[I]f you don’t make it very focused on [Black parents], and you just go knock on doors, and you go stand in front of school, and you do presentations at school… you will only have Latino parents. Because you only have Latino parents, Black parents will see it and they actually won’t come. So it’s kind of a self-fulfilling prophesy…. So then you have the fact that Latino parents (are) becoming empowered, and having all these spaces where they’re the only group in the room. And then the notion of empowerment, just like any group, translates into positions and councils, and getting close to the administration in schools, and being connected….
These feelings of dislocation are echoed by those who did move away, partly as a result of the demographic change. While, as noted, we did not interview residents who had left South LA, some interviewees shared insights on why Black families have left the area. Alongside the other factors that propelled Black flight—a desire for safer spaces and less expensive housing— Eloise suggested that many have moved out of Los Angeles to places like San Bernardino and Palmdale because:
…like I was saying before, it feel like it’s becoming Hispanic territory mostly, and like I said, not everyone gets along with Hispanics, so they’d rather just uproot and go to where they know that there’s more Blacks and they feel more at home.
In her work interviewing Black residents who left South LA for what is called the Inland Empire (Riverside and San Bernardino Counties), Deidre Pfeiffer (Reference Pfeiffer2012) reports on one respondent who suggested that they made the change to find something that South LA no longer provided for her, “…a feeling of community, of collectivism, of a sense of belonging, of a sense of being insulated from broader societal forces…those who were seeking that same kind of level of comfort and sense of belonging moved to where the African Americans were at, which was in San Bernardino and Riverside” (p. 79).
One of our respondents, a long-time Black resident and civic observer notes that the sense of Black loss is:
… very palpable. I mean we would say well, these Latinos, you know, maybe they’re poor, they don’t have much but they have numbers on their side. Numbers is a kind of capital, right, it’s a kind of wealth. We don’t have numbers. We don’t have money. We don’t have political clout. So what do we have? Now, to me, you know, the only capital we have, or the consistent capital, is community and when that goes what do you have?
This is, of course, consistent with a broader narrative of historic theft of labor and property that characterizes the Black experience in America and so one can see why it resonates. As we note below, this sense of Black erasure has been exacerbated in recent years by the pressures of gentrification, with African Americans feeling like the area is about to improve but that it will do so in a way that drives up rents, steps up policing of their youth, and will eventually force them to join the earlier exodus out of South LA. Meanwhile, as Black homeownership dwindles, a trend we pointed to above, the loss of claim to the space of South LA becomes material.
Economic Precarity: Commonalities and Differences
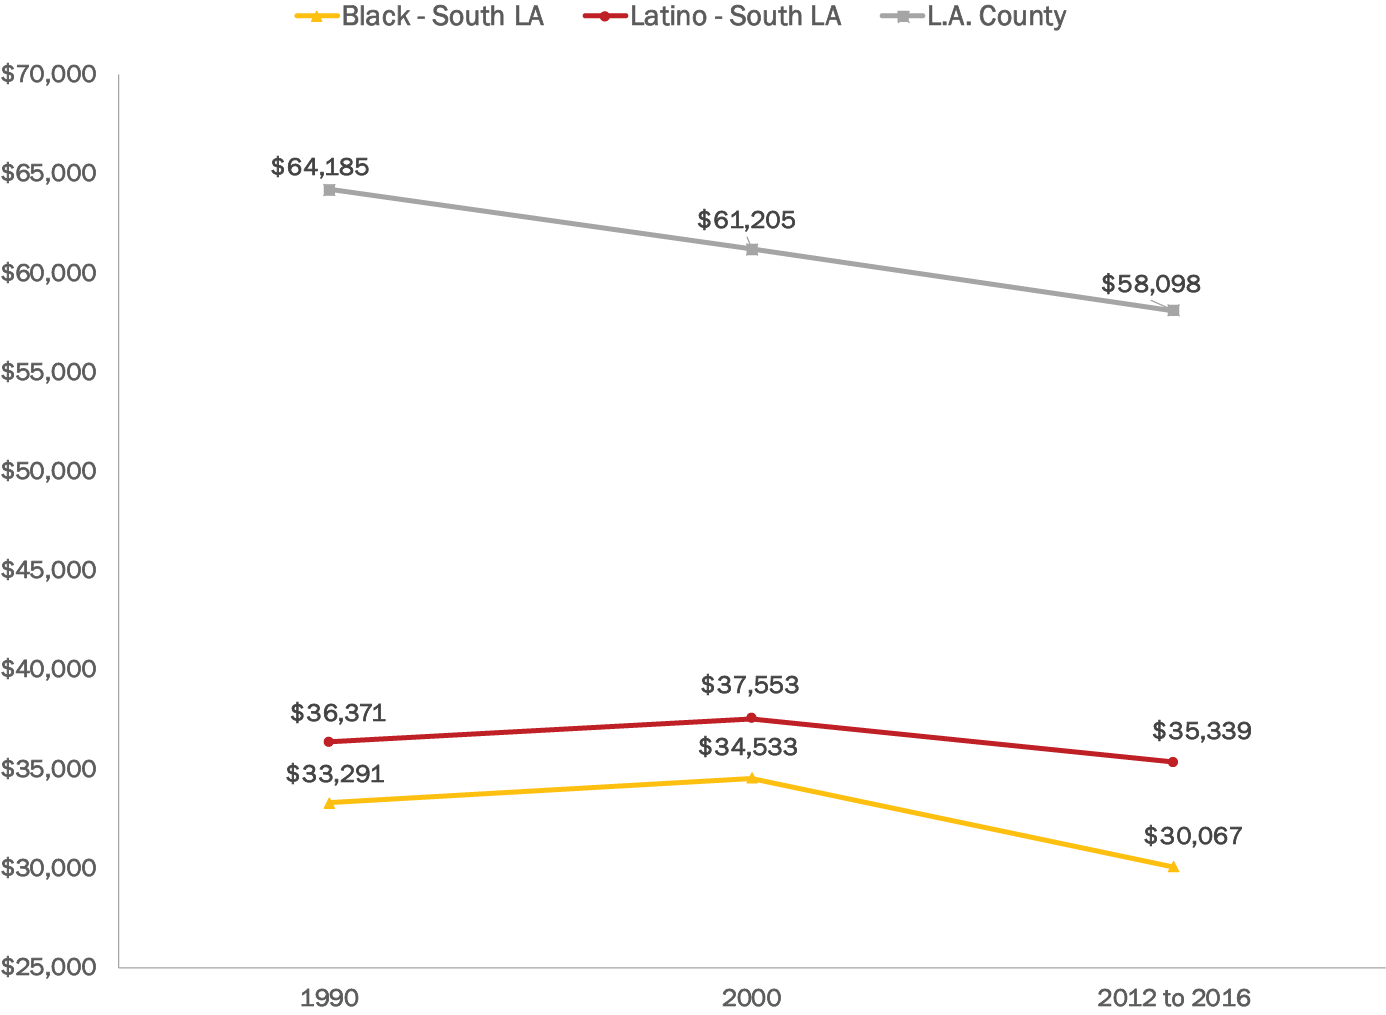
South LA has historically been and continues to be one of the most low-income areas of Los Angeles County: according to the 2012-2016 American Community Survey, the overall poverty rate for South LA was thirty-three percent, nearly double that of the county (eighteen percent). Figure 9 shows that median incomes for South LA’s Latino and Black households have been low and stagnant and well below the county median over the past few decades. Latino median household income tends to be higher than for Black households, but because of larger household sizes, poverty rates for Latinos are actually higher (thirty-four percent compared to thirty-one percent for African Americans), as the government measures poverty as a function of family size. Even so, while economic precarity is an issue for both Black and Latino communities, the ways in which they manifest are considerably different and this can have important implications for both community relations and the ability to accumulate wealth in a way that would allow Black residents to stay in South LA.
Black and Latino Median Household Income (2016 $), South LA, 1990–2016
Source: U.S. Census Bureau, Geolytics Inc.
Economic precarity for the Black community in South LA has been undergirded by rampant Black unemployment spanning several decades, linked to the decline in manufacturing mentioned earlier, as well as to continued practices of employment discrimination and barriers faced by those who were formerly incarcerated. In contrast, unemployment has been less of an issue for Latino residents. As Figure 10 illustrates, data from 2012–2016 show that the unemployment rate for Latinos in South LA was 9.6 percent, quite close to the county average of around nine percent, and has actually been on a steady decline since 1990. By contrast, the Black unemployment rate was nearly nineteen percent, the culmination of a steady climb over the past three decades. Compounding high unemployment, Black workers are more likely to be discouraged from entering or re-entering the workforce, so labor force participation rates for African Americans during 2012–2016 was just fifty-two percent compared to sixty-six percent for Latinos.Footnote 13
Black and Latino Unemployment Rates, South LA, 1980–2016
Source: U.S. Census Bureau, Geolytics Inc.
Note: A person is unemployed if they are in the labor force and currently looking for work. The unemployment rate is the share of unemployed persons out of the total labor force (the sum of those currently employed and those unemployed).
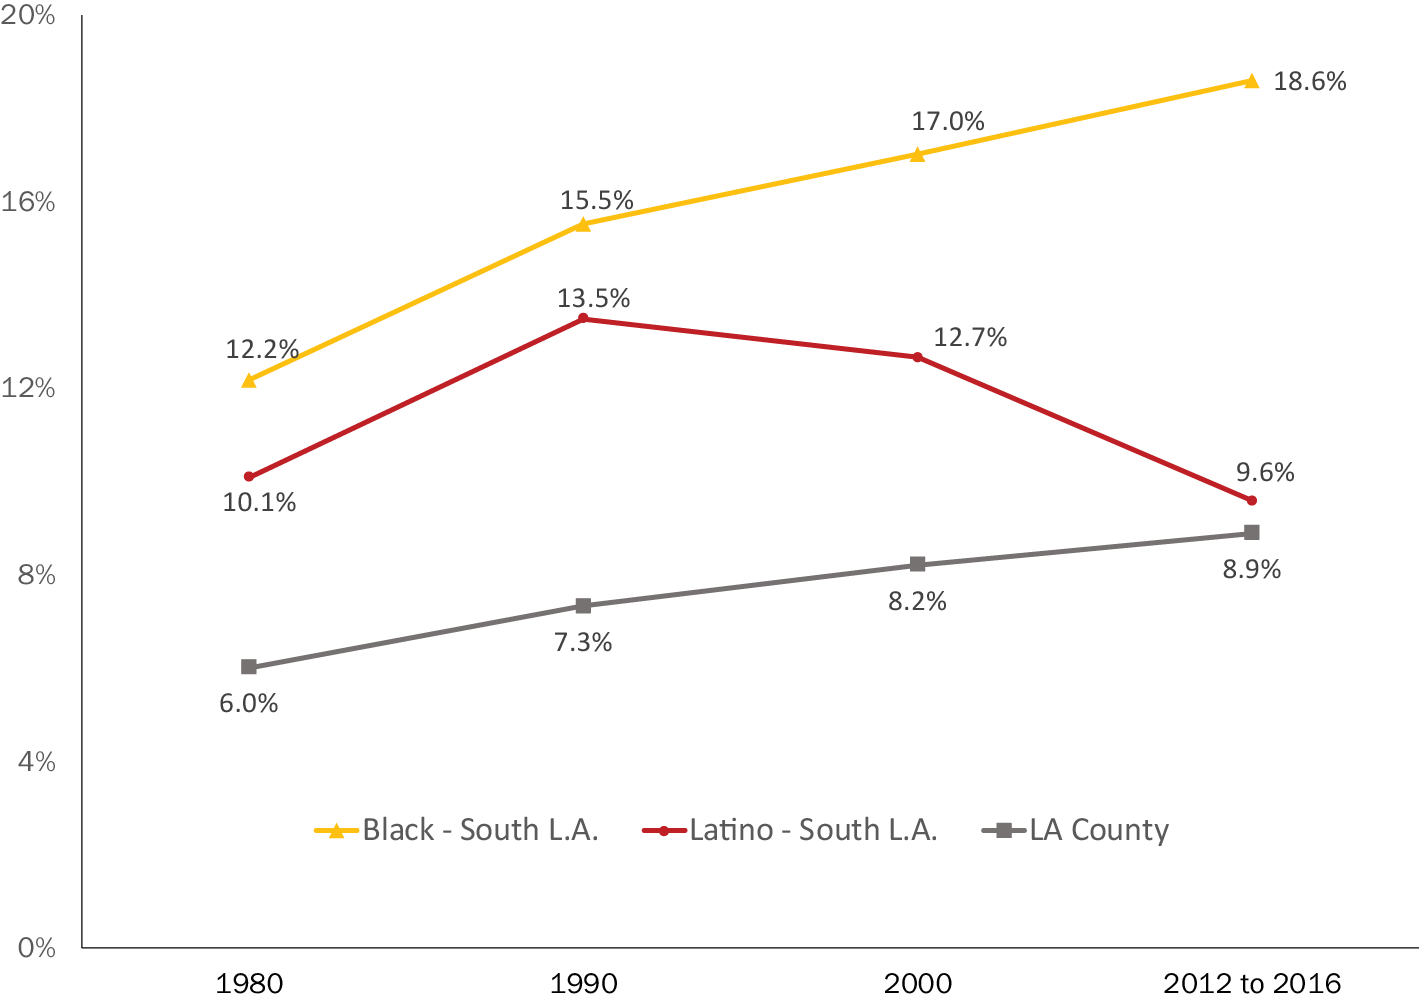
The material realities coming from decades of employment discrimination have marked Black residents’ understanding of the changing demographics in South LA. As one interviewee said, there is a sense—even if interviewees indicated that it is held by others, not themselves—that “‘Oh they’re coming and taking things away from us.’” And in our interviews, the “things” taken away from Black residents were almost always jobs. In fact, a recurrent topic was that of economic competition as a result of limited job availability—or even that jobs are now only intended for bilingual Latinos. Aiesha, a twenty-five year-old woman from Watts, shared, “It’s hard for a Black person to get a job before a Mexican.” The perceived reason is discrimination:
…I think they get treated better than us. I think they get hired way before us if they don’t got no bad background ‘cause I know most people check that…I seen it happen with my little brother when he trying to get a job…they hired nothing but Mexican people.
Another reason was language. As one civic leader (and longtime Black resident put it):
I did hear a lot of ‘we can’t even get jobs at fast food restaurants anymore, our kids can’t get jobs at fast food restaurants anymore because you have to speak Spanish.’ …And some people said, well, we need to learn Spanish, but that—you know, from a lot of people that didn’t seem practical and I think there was some, there was a stress about that. Like gosh, now what do we do, we can’t even get these jobs. And really I kept hearing that, it was the language. It wasn’t like, oh, you know, they’re taking our jobs, it was…to get that job we need to speak Spanish suddenly and we couldn’t do it.Footnote 14
Language barriers were also perceived to extend beyond entry-level work requirements. As Sierra, a young woman from Watts, described:
So we’re in a union meeting and they’re speaking Spanish. So it’s like, how do you expect anybody to care or anybody to know the things that you’re talking about, even though the decisions that you’re talking about affects us, if you’re speaking a different language?
While Latinos might also suffer from a lack of English skills in the labor market, these interviewees suggest a reversal of fortunes with language requirements and practices in the workforce used in codified ways to discriminate against and exclude Black workers.Footnote 15
Policing and Perceptions in South LA
Much writing on immigrant integration has, in recent years, been about deportation and its consequences (Menjivar and Abrego, Reference Menjivar and Abrego2012; Ryo Reference Ryo2015). Given the generalized uptick in deportations during 2014–2015, a period in which the Obama administration was breaking historical records for removals, we were anticipating this to surface as a major concern and were struck by the relative lack of verbalized deportation fears from our Latino respondents.Footnote 16 This was particularly surprising since so many of the residents are, as noted above, undocumented and there is, as a result, a large share of mixed status households who could be one immigration encounter away from family separation.Footnote 17
Why so little focus by residents on this issue? First, there is a long-standing order followed by the Los Angeles Police Department (LAPD) that prohibits officers from stopping residents to query about their immigration status (Smith Reference Smith2017). This lack of cooperation with Immigration and Customs Enforcement is not complete but it does provide a local shield, one much in keeping with the state’s overall adoption in 2018 of legislation designating California as a “sanctuary state.” But another factor in why deportation fears were subdued may have to do with the nature of policing in Los Angeles—that is, the long-standing pattern of policing being targeted at Black people may lead to a sense of Latinos being under the policing radar, particularly in South LA.
The data seem to confirm these notions. Between 2012 and 2017, fifty-seven percent of arrests in South LA were African American, compared to forty-one percent being Latino—a near transversal of the neighborhood’s demographics (MDHP 2019). Further implicating the LAPD for targeting, a recent analysis showed that the Metropolitan Division, a mobile unit that had recently been increased in size to combat a perceived surge in violent crime, was stopping Black drivers at a rate five times their share of the City population, and twice the share for South LA, where most of the stops were made (Chang and Poston, Reference Chang and Poston2019).
Indeed, a senior law enforcement official interviewed as part of this project reported that his meetings with African American community members were often filled with complaints of mistreatment of young Black males; by contrast, meetings with Latino community members tended to include complaints about slow response time and expressions of the desire for a stronger police presence. In his words:
My experience with the Latino community has been more that they just don’t think we come. I mean, I don’t really get the complaints about, ‘You stopped my kid. You’re harassing us.’ We don’t get those complaints. We get the complaints that ‘I called the police and you never got here. I called the police and you didn’t do anything when you got here’ …whereas in the Black community it’s, ‘You’re picking on my kids. We’re afraid you’re going to shoot us’…
This is not to say that Latinos do not experience issues with policing; younger Latino respondents also reported feeling harassed by the police, and frustration about over-policing was a point of unity with younger Black residents.
Moreover, Aaron Roussell (Reference Roussell2015) highlights the institutional vehicles for community participation in the bureau that polices South LA that work against Latino voice: the meetings are monolingual rather than bilingual; the Black and Latino participants are generally separated, with the Spanish language meetings having a downgraded or secondary status, and the English language meetings being often dominated by elderly and middle-aged Black residents offering seemingly anti-Latino complaints about illegal vending and gatherings of day laborers (a perspective that is also tied to the generational differences outlined earlier). Still, as Roussell (Reference Roussell2015) argues:
The [police] discourse over Latino in-immigration constructs Latinos as victims of black crime, as deserving and hard workers (regardless of the legality of their work), and as necessary for the maintenance of LA’s restructured economy. This leads to negotiations over how to “practice tolerance” toward the new arrivals—that is, how to regulate rather than banish. Latinos in South Division are seen as comprising a distinct group of laborers whose purpose is clear and necessary, if often unruly and sometimes necessitating sharp rebuke and selective deportation. Moreover, officers’ racial biases regarding divergent Latino and black work ethics and crime propensities translate directly into accommodation or expulsion respectively (p. 839).
This, coupled with the police commitment—not always honored—to not act as immigration enforcement agents may explain why the issue of deportation and detention came up relatively infrequently in our community interviews with Latino residents. This is a topic worth further research but the salient point here is that there are differing attitudes toward law enforcement that become increasingly complicated with the intensive anti-Black police presence in South LA.
Creating Black-Brown Place Identities
Despite feeling the strain of their home changing around them, many of our interviewees offered their own ways of creating community both amongst themselves and between ethnic groups. One important way to create bonds was through church groups. Avid and long-time South LA church-goer, Gabrielle, prints church flyers in both English and Spanish so that, “the Spanish community knows that they’re welcome.” Jasmine, who has lived in Watts and attended church there her whole life, expressed her excitement when her own church created a multicultural space where Latinos would be integrated into their space:
We had a … Catholic Evangelization Center, for example… I’ve been with them for twenty years. And they developed this group called Building Bridges Between Black and Brown and from the moment they started talkin’ about it, I said I wanted to be on this committee.
But even the subject of church community brings up a sense of Black loss. In the words of Janice, whose family has passed down a home in Historic South Central for multiple generations:
I would say pastors [are leaders], to a certain extent, but that’s kind of fading away. So, the church influence is not as big in this community as it was before, and obviously, that’s another part of the shift.
One young woman in Watts expressed that South LA community organizations should do a better job of reaching Latino families who may feel uncomfortable to look for resources in historically Black neighborhoods and who may be “excluded from the conversation” due to language barriers. Gabrielle, quoted earlier, looks to community leaders as a resource for bringing Black and Brown business interests together:
They need somebody who can help bring together Hispanic business with [Black] business, because to me it seems like Hispanics kind of have their thing going on and Black folks trying to do theirs, but if some kind of way it could be brought together, really both can be built up, then it’d help little mom and pops who wanna go in business, what are those steps to take, and why can’t we build together? I mean some kind of way. It seems like we stay separated too much.
Such engagements are already ongoing. For example, the Black owner of a dry cleaner on Central Avenue was elected the first president of a new business association largely composed of Latino entrepreneurs, partly because she had so much experience dealing with city issues. As one Latina owner of a hair and nail salon noted, “She is an honest person, a very hard-working woman and very dedicated to the community… We’re all in this together. Among us there are no differences of color” (Tobar Reference Tobar2011, p. A2).
In addition to opening up their spaces to and forging working relationships with Latino neighbors, many Black residents described how they attempt to spread inclusive attitudes in their daily interactions. One woman shared that she challenges her Black neighbors when she hears complaints about Latinos taking jobs, while Kasi, a thirty-six year-old woman quoted earlier considers jobs an equally challenging obstacle for Black and Latino residents:
I think challenge number two, like I said, is jobs, and what other things that we have that are setting up walls so when we do go on those interviews and we’re trying to get those jobs that have better career paths, like where you continue to rise and get promoted and a lead if you can get in the door to do that. I feel like it’s equally challenging for Blacks and Latinos for maybe different reasons.
And James from Watts also challenged the narrative of “taking jobs”:
A lot of Black people have issue with [Latinos]; feel like they’re taking the jobs, they’re taking the opportunities. My God, man, they don’t control the job market. They don’t control the economics. They don’t control anything. They control about as much as you.
Thirty-one year-old Devon from Watts similarly added that “The main challenge for everybody is poverty…And that’s what connects us, basically.” Meanwhile, Paula, who has lived in Vermont Square for over fifty years, noted that Latinos “have problems just like the African American. Well, being discriminated against. You know they are, don’t you? Whether they accept it or not, they being discriminated just like we are.”
Twenty-six year-old Desiree from Watts argued that Black and Latino residents face the same issues, elaborating these as:
The gang[s], bull[ies], sometimes finding work…Everybody think just because you Hispanic, you can go out and get a job. It’s not that easy either, being Hispanic. You’d be surprised at how many Hispanics that don’t actually have jobs or can’t get jobs. They in the same predicament we in. Some of them was born and raised here too, so you know, we stereotyping because of the color of they skin. They go through the same thing we go through. They go through struggles and can’t eat and homeless and they go through the same thing we go through. They just a different race.
That sort of commonality and empathy was shared by a community resident who said, “You know, (where) I grew up in Watts the majority of my friends were Mexican or Latino. And I’ve never seen anything as a color issue….” This is also a dynamic that has changed over time. As one younger Black male respondent put it, somewhat echoing the statement above:
To be honest, when I was a little kid it was a lot more racial, a lot. Even in middle school we had, like, food fights. Black homies used to be like, ‘Oh, you hanging out with the Mexicans….’ Little did they know, I’d go to the Hispanic homie’s parties, bro, they feed you, you’re drinking, you say, ‘I need a ride home.’ They turn you up, the family love you, like especially the ones who grew up with Black folks, like they mama love you, granny love you, abuela, all that. You know. And now it’s a little bit more laid back…like Black and Brown people’ kids hanging out with each other, playing with each other at the park, skateboarding together.
Looking at the overall pattern, one finds a complex mix: simmering tensions coexist with feelings of solidarity and a broader, and not always begrudging, acceptance of the new reality of a Black-Brown South LA. But even for those who embrace the change, the sense of loss lingers. As one observer noted, this is rooted deeply in the African American experience:
There’s a lot of subtleties there and a lot of different history that Black people don’t feel comfortable—there’s no space to talk about it… [T]hey’re always kind of expected to bear the burden or just, you know, get along—just accept and get along and they have, but there’s things that they’re anxious about that they feel they’re losing. That they’re actually losing that has, in some ways, nothing to do with Latinos or—it just is this historical sense that we’re being marginalized, generation after generation after generation…
Providing leadership amid this stew of emotions—particularly when joblessness, hyper-incarceration, and under-education remain key issues for African Americans—is a unique challenge for political and community leaders in South LA, be they Black or Latino.
Black-Brown Politics
As the area has changed, so have the politics. This is not to say that Latinos have achieved representation in proportion to their numbers—not a single elected position from South LA is held by a Latino. But many of the traditional Black bases of political and civic power have been on the decline while Black-Brown coalitions have been on the rise. For example, both the local branch of the Southern Christian Leadership Conference and the local NAACP have a lighter community footprint than in the past, and the Urban League—once headed, until his retirement in 2005, by the influential and highly respected John Mack—has seen its budget and staffing shrink in recent years. The churches that were once key anchors of Black civic life have been transformed. For example, Second Baptist is now a commuter church surrounded by almost entirely Latino neighbors (Terriquez and Carter, Reference Terriquez and Carter2013). First African Methodist Episcopalian (FAME)—the first Black church founded in Los Angeles and the go-to location for Black Angelenos during and after the 1992 civil unrest, once led by the charismatic Reverend “Chip” Murray—has been weakened by scandals and conflicts. Holman United Methodist, headed between 1974 and 1999 by civil rights icon James Lawson, remains a center for community gathering but its impact is limited compared to its impressive influence in an earlier era.
Instead, what have emerged in local politics as the most dynamic and strong organizations and political figures are those groups and individuals who are more steeped in Black-Brown organizing. Long-time LA County supervisor, Mark Ridley-Thomas, for example, actually won his seat in 2008 by overpowering a mainstream Black City Councilman and former police chief, Bernard Parks, who received endorsements from major Black politicians and was popular with many older Black voters. Ridley-Thomas’s winning strategy combined Latino and labor support with a targeting of new and occasional voters (Barkan Reference Barkan2008). And many of the new poles of community power—groups mentioned earlier like Community Coalition and SCOPE—have emerged from organizing that places a strong emphasis on Black-Brown coalition building and constructing a shared South LA identity.
Of course, the leadership embrace of Black-Brown unity is sometimes strained by real world community-level pressures. For example, one of the major struggles in recent years in South LA was over the loss of a fourteen-acre community gardening space called South Central Farm (Barraclough Reference Barraclough2009; Irazábal and Punja, Reference Irazábal and Punja2009). As it turns out, the farmers there were almost entirely immigrant Latinos and as one of our civic leader interviewees, who visited before the struggle took full form, noted, “I remember going and definitely feeling a very… like sensing a very anti-African American vibe.” Moreover, the councilperson in charge of the area was a mainstream Black official, Jan Perry, who saw South Central Farm as an impediment to potential job creation on the site. While several Black activists became engaged with the struggle and helped to change some of the imagery of the Farm’s fight as entirely Latino, racial tensions over the site and its future were clearly present.Footnote 18
Meanwhile, several other place-based efforts in South LA—such as the effort of the UNIDAD coalition to resist gentrification in the historic corridor around Figueroa Street—have been seen as more oriented to the needs of Latino residents. This is partly because some of the main groups involved—CD Tech, Strategic Actions for a Just Economy (SAJE), and Esperanza Community Housing, all of which have grown in prominence and influence relative to other strong coalition partners like the Watts Labor Community Action Committee—work in the far more Latino northeast side of South LA. This has caused some residents to sense that community organizing momentum has slipped in the direction of Latino residents and that Black-Brown coalition building may be a precursor to Latino succession. Adding to the concern is that some key organizations in South LA, including the flagship Community Coalition, CD Tech, and another grouping called the Community Health Councils, now have Latino/a leaders who have succeeded effective and charismatic Black directors.
Civic leaders navigating these waters are aware of the challenges and consistently lift up the necessity of tackling anti-Black racism for both moral and strategic reasons even as they build Black-Brown organizations. Intentionality, and attention to the emotional landscape, matters. But it does not take away from the fact of subtle shifts in political power. The concern is fed by another countywide demographic dimension: the difference in group exposure as measured by the likelihood of encountering a person of another group in a neighborhood based on the concentration of those groups. The county-level exposure of African Americans to Latinos has been on a steady rise (quadrupling between 1970 and 2000) while the exposure of Latinos to African Americans barely moved over that period (Ethington et al., Reference Ethington, Frey and Myers2001). In essence, many Latinos have been moving into Black neighborhoods, but few African Americans have been moving into areas with high concentrations of Latinos.
This means that African American civic leaders who are positioning for city- and county-wide presence are often inclined to think of alliances with Latinos; likewise, Black residents in South LA are forced to think through daily accommodations with their Latino neighbors. By contrast, Latino residents and leaders in traditionally Latino areas, such as East Los Angeles, are not held accountable to fostering such Black-Latino relations. Of course, Latino leaders in South LA do need to think about their relationship to Black people and anti-Black racism but this is not always echoed on a citywide basis. This asymmetry in both exposure and the way in which that impacts politics is important and feeds into a further a sense of losing space, something which is now exacerbated by gentrification pressures that are affecting South LA as a whole.
Black Futures in Black-Brown Space
Up to this point we have discussed how Black residents of South LA have responded to the growing presence of Latinos, specifically the ways in which they have acclimated and sometimes resisted the notion of rethinking South LA as a Black-Brown space. To the extent that both communities have made strides past initial tensions towards new solidarities, the loss of salience of South LA as Black Los Angeles is perhaps symbolic of the overarching sense of erasure that the Black population is simultaneously feeling and fearing throughout Los Angeles. This sense of erasure is grounded in the historical contestations over space that have intricately linked notions of Black identity and geography (Lipsitz 2011).
Even though Black spaces are inherently markers of pervasive spatialized racial inequality, the Black spaces in Los Angeles were hard earned and have been reconfigured into the landscapes in which Black populations have been able to claim and assert control over the futures of their own communities. However, the prospect of staying in these communities is becoming increasingly less feasible, and the newer post-recession migrations out to the fringes of the county and into the Inland Empire are less fueled by the prospects for economic mobility as they were in the past, but reflect the sentiment that exiting is the only feasible resolution to the changing landscape of South LA.
Black claims to space have been long tied to the community’s ability to invest in itself, be it through commercial endeavors or through homeownership (Chapple Reference Chapple, Hunt and Ramón2010). As we illustrated earlier, Black homeownership rates in South Los Angeles have always trailed that of the county as a whole. After the recession the disparity got worse, with the Black homeownership rate trailing the countywide rate by ten percentage points. The implications for such a disparity are quite serious, as homeownership has been the primary access point to transferable wealth for Black communities throughout the nation (Bullard Reference Bullard2007). This geographic claim has been complicated by the age profile of homeowners: Black homeowners are older than their Latino counterparts and as such are more open to selling their homes in order to retire to somewhere more affordable and more amenable to an older population.
Compounding this issue is the fact that Black households are less likely to be comprised of more than one generation than Latino households. Only forty percent of Black households are multigenerational compared to more than three-quarters of Latino households.Footnote 19 The dearth of multigenerational households complicates the potential for transferring homeownership amongst family members for Black residents, thus leaving an opening for placing homes for sale on a much more speculative and increasingly more financialized real estate market, especially in the wake of the recession (Fields Reference Fields2018).
Of course, the recession and the changing real estate market has not only impacted homeowners but has left renters in increasingly more precarious situations especially in some of the holdout majority Black neighborhoods in South LA, such as Baldwin Hills/Crenshaw and Leimert Park. Gentrification pressures are materializing in South LA as the neighborhood has experienced transit investments as well as various stadium and entertainment projects in and around it (particularly in adjacent Inglewood which has captured the attention of the Rams, the Chargers, and now the Clippers). Meanwhile, the affordable housing stock is increasingly more vulnerable as thousands of affordable units have either already lost rental subsidies or affordability restrictions or are at risk (HCIDLA 2018). An increasing majority of Black residents that are in renter households can be less certain about their ability to stay in the neighborhood, particularly as two-thirds of these renters are rent-burdened.Footnote 20
One interviewee spoke directly to the implications of new development in South LA, indicating that this will likely change the demographic of the area:
The property values here are lower than they are in other places, and that is an incentive for anyone to want to come here and get a bigger house or get whatever it is that they feel like they can get as an advantage by getting a certain type of house for a lower price or getting more of a house, or even buying—you can buy a duplex cheaper…. That dynamic is going to continually attract new types of people into this community. That’s what’s going to create the change in face.
Several other interviewees also spoke to this notion about a changing character of South LA, particularly in their discussion of the future of the neighborhood in the next decade or two. For some interviewees, these threats of gentrification and displacement were seen in the broader context of slowed, albeit continuous, migration of Black South LA residents out to the region’s fringes and even other parts of the country. This left them unsure about the prospects for the future of the neighborhood, or sometimes even their particular future in the neighborhood.
Elaborating on the impacts of gentrification and the potential for Black spaces in Los Angeles, one interviewee asserted:
I feel like we’re just spread out. We’re everywhere. I can’t really put my finger on where Black people will be… I can’t. I can’t even say, ‘Oh, yes, Leimert Park will be back,’ and I would love to say that, right? I just don’t believe it. And then the way people are talking about gentrification…they’re talking about redoing the whole mall, Baldwin Hills Mall, creating these high rises. We can’t afford it. We cannot afford it. So where are we gonna be, you know what I mean? So I feel like Black people are being displaced a lot in our community. This is not—South LA will not be the Black community. It’ll be Latino; it’ll be White, have a few of us sprinkled in there, and some Asian folks. And that’s how it’s gonna be.
Black sense of loss in South LA, then, ties heavily to the lack of a prospect for Black futures in the neighborhood, and perhaps more broadly in the city of Los Angeles. As noted earlier, some civic leaders are making great strides in both promoting Latino civic engagement and meeting the needs of the existing Black community. But this is a difficult and uneasy balance, particularly since the earlier embrace of interethnic unity during the Tom Bradley mayoral administration offered modest political and symbolic gains to communities of color even as low-income neighbors and neighborhoods were left behind in that era’s growth boom (Pastor Reference Pastor, Pulido and Kun2014).
With every reason to be suspicious in the current moment, organizing residents of South LA to articulate their concerns and articulate their visions is crucial. But while it may be tempting to go with the new Black-Brown organizing dynamic and stress commonality based on a shared “home,” this runs the risk of flattening experiences and failing to adequately address each respective community’s needs (Rosas Reference Rosas2019). In earlier sections, we have attempted to tease out why purely place-based politics will not resonate with either community. We similarly acknowledge that blanket statements about institutional racism and White supremacy do not do full justice to the particular experiences of Black and Latino communities in South LA. In order to animate and engage both communities, it is important to take seriously the legacies of racial segregation and anti-Black racism and discuss them in conversation with the legacies of imperialism, anti-immigrant policies, and Latino experiences of segregation in Los Angeles.
Another major barrier in envisioning a Black future for South LA is the actual connection of everyday residents to their leaders: a struggle that came up in many of the interviews. Perhaps reflective of a broader change in the national political schema—we note earlier how prominent institutions of the Civil Rights Era are now less central—many interviewees struggled to identify who the leaders in their communities actually are. One interviewee spoke directly to this notion, highlighting the changing political landscape across generations:
So this is kinda hard because I think, for many years, it was the old guard; it was the older people who were really the leaders in our community. And it was council people, and people really kind of depended upon the system and tried to navigate that system, but I think as we’ve had more police brutality and just different issues, people getting killed unjustly, now, I think it’s more of the millennials are kinda moving in and it’s Black Lives Matter groups, it’s people working outside of the system, it’s like Melina Abdullah [a local professor and BLM organizer] is really seen as a leader now.
Others argued that current formal leaders do not fully grasp the challenges facing Black people in South LA. As one resident put it:
Yeah, they grew up in South LA, but they probably don’t really have the real roots here. You know what I mean? Maybe they do but to me, it doesn’t seem like the people who are in politics and the people who are in the leadership positions have the roots and the connection. I think that that’s what LA needs is somebody that grew up here and really understands the dynamics…what the problems are and how to address it.
By way of example, one interviewee noted:
I look at the homeless problem. The reason why we have more homeless in this community is because they started to redevelop downtown Los Angeles. They started to redevelop USC area. So what happens? People get pushed this way…we start getting most of the problems and it’s not shared, you know? So, I think our leaders, like our councilmember, he’s kind of—in one way, it’s like, ‘Oh, we’re beautifying this—the downtown LA is gonna boast of the new whatever kinda center…I mean, I think when we get new resources, it’s because they’re building it around USC. The fact that there’s a Trader Joe’s coming to USC, that’s because they’re catering to that community. It’s not about increasing access in this particular community. So I’m just keeping it 100—you know, the Expo Line, the Crenshaw Line, all of these assets that are coming, it’s not about us.
Another interviewee put it more frankly: “They ain’t trying to help us.”
CONCLUSION
While South LA has always been a place of change and transformation, its role as the locus of Black Los Angeles has been essential to its identity. This article has tried to explore the tension between that legacy and the emergence of South LA as an overwhelmingly Latino community. Our focus has been partial but crucial: while in other work, we have explored what this means for Latinos, particularly in terms of generational tension and the lack of Latino civic participation (Pastor et al. Reference Pastor, Hondagneu-Sotelo, Alejandro, Stephens, Carter and Thompson-Hernandez2016), here we have tried to stress how this shift has impacted Black residents of South LA.
The story is complex. While African American residents have been deeply concerned about economic competition with Latino immigrants, there are also clear and deep impulses toward solidarity. While there are striking instances of quotidian accommodation, there is also evidence of Black flight and a sense of being frozen out of shifting systems, for example, in terms of parent participation in school decision-making. And while there is an appreciation of how a Black-Brown political framing rooted in a sense of place and mutuality can facilitate power-building, there is also a sense of disappointment that like so many other aspects of U.S. history, for power to only come with a diminished focus on the Black experience simply adds insult to racist injury. This sentiment is particularly acute in light of gentrification pressures in the neighborhood that create a sense that this space—hard-won by Black Angelenos challenging racist redlining and other exclusionary real estate practices—is about to slip away as both an iconic and actual home.
That context complicates community organizing and identity. Forging political power requires new alliances and new place-based identities but for Black residents to buy in to this perspective, it is also necessary to acknowledge the concerns about Black loss and erasure. Given this, civic leaders and community organizers must recognize how the experiences of Black and Latino residents simultaneously converge and diverge; for example, how both groups face economic disparities but the ways in which they play out are markedly different. Recognizing these similarities and differences can alter the landscape of this demographic change from one of Latino triumphalism to a more resonant articulation of South LA as shared Black and Brown space. Some civic leaders and community organizers and institutions have already taken the lead on such a complex place-making and identity-forging effort. However, the potential for Black futures in South LA are further hindered by larger forces in the city and region as a whole, as threats of gentrification and displacement continue to threaten the viability of the Black community.
So what is the future of South LA? Our interviews with Black residents indicate that the onus is on civic leaders to connect and advocate for the issues that affect the people struggling the most—only then can they envision a future in South LA. Ultimately, the potential for forging Black futures in the changing landscape of South LA—and the ability to secure that future in many other urban areas experiencing similar demographic changes— relies on the ability of civic leaders to articulate the needs of Black South LA residents in the broader landscape of Los Angeles politics. While some of the leaders that we spoke to are attempting to do just that, our interviewees suggest that it is just as important to have homegrown leaders who directly connect to the struggles that the community faces as it is to have Black leadership per se.
Recognizing the changing terrain of South LA identity, some organizers in this area have sometimes sought to bring together community members with the hashtag, #WeAreSouthLA. It’s an evocative appeal to the common sense of place that has indeed been forged: both Black and Brown residents of South Los Angeles are proud of the resilience their communities have evinced in difficult times. But for this common identify to become real will require a more nuanced understanding of the history and the reality. It is our hope that this research provides a more honest portrayal of the tensions and transformations that have occurred across time and help move forward both new theories of racial formation (Molina et al., Reference Molina, HoSang and Gutiérrez2019) and the more concrete task of amassing sufficient coalitional power so that the residents of South LA can indeed determine their shared fate.



