A common hypothesis about voting behavior in the 2008 presidential election, in which the first African American candidate from a major party faced a white opponent, is that racial attitudes influenced the ballot choices of nonblack voters. A handful of studies of individual-level behavior reports an effect of prejudice on voting behavior (Lewis-Beck, Tien, and Nadeau Reference Lewis-Beck, Tien and Nadeau2010; Hutchings Reference Hutchings2009; Pasek et al. Reference Pasek, Tahk, Lelkes, Krosnick, Payne, Akhtar and Tompson2009; Sniderman and Stiglitz Reference Sniderman and Stiglitz2008; Reference PistonPiston forthcoming; Tesler and Sears Reference Tesler and Sears2010; Parker, Sawyer, and Towler Reference Parker, Sawyer and Towler2009). This article returns to the important subject of the relationship between racial attitudes and support for Obama using new data and adopting a different approach, with the goal of explaining state-level variation in nonblack support for Obama versus McCain. The findings reinforce results from prior individual-level studies and go beyond them by suggesting that at the state level, the influence of prejudice on voting was comparable to the influence of partisanship and ideology. Racial attitudes explain support for Obama and shifts in Democratic voting between 2004 and 2008 but are only modestly related to presidential voting in 2004 and 2000; additionally, the relationship between prejudice and approval of George Bush in 2008 was negligible. Prejudice does not therefore appear to have a pervasive influence on opinion and behavior but instead seems to be invoked when the candidate being evaluated is African American.
BACKGROUND
As the first African American candidate for president from a major party, “it follows from common sense that racial prejudice [would] stoke opposition to Obama” (Sniderman and Stiglitz Reference Sniderman and Stiglitz2008, 1). Indeed, the ballot box would appear to be a relatively easy place for a prejudiced individual to act on that view. Choices are private and anonymous—therefore not subject to social sanction—and made about people with whom voters do not have a personal relationship. To be sure, primary elections that include an African American candidate may be even more susceptible to the influence of prejudice, because other differences between candidates are muted.Footnote 1
Given that hardly any scholar of racial politics in America or mass American political behavior argues that prejudice has been eradicated, few would doubt the proposition that prejudice influenced presidential voting in 2008. While there will undoubtedly be more inquiries into the subject, the first round of studies focusing on individual-level choices of white voters all report evidence consistent with this hypothesis (Lewis-Beck, Tien, and Nadeau Reference Lewis-Beck, Tien and Nadeau2010; Hutchings Reference Hutchings2009; Pasek et al. Reference Pasek, Tahk, Lelkes, Krosnick, Payne, Akhtar and Tompson2009; Sniderman and Stiglitz Reference Sniderman and Stiglitz2008; Piston Reference Pistonforthcoming; Tesler and Sears Reference Tesler and Sears2010; Parker, Sawyer, and Towler Reference Parker, Sawyer and Towler2009). These studies motivate the present investigation, which shifts the analysis to the level of states, the units on which the outcome of a presidential election is directly based.
The question addressed in this article is how the variation in prejudice levels across the American states influenced the vote shares that Obama received.Footnote 2 The focus here is twofold: (a) the absolute magnitude of influence; and (b) the relative amount of influence in relation to the two state-level variables that have been used to explain upwards of 85% of the variance in recent state-level presidential election results, state partisanship and state ideology (Erikson, Wright, and McIver Reference Erikson, Wright, McIver and Cohen2006).
DATA AND MEASURES
To measure voting behavior in the 2000, 2004, and 2008 elections, I relied on the Voter News Service (2000) and National Election Pool (National Election Pool, Edison Media Research, and Mitosky International Reference National Election Pool and International2005; National Election Pool and Edison Media Research/Mitofsky International 2010) state exit polls conducted for major media outlets and made available through the Inter-University Consortium for Political and Social Research and the Roper Center for Public Opinion Research. Surveys were conducted in every state for all three election years. For each year, I computed the percentage of nonblack respondents who reported voting Democratic among major party voters.Footnote 3 For an additional test (described later), I also computed the percentage of nonblack voters in each state in 2008 who reported disapproval of Bush's job performance.
Figure 1 reports the estimates of primary interest, the state-level nonblack vote for Obama among major-party voters. Substantial variation is evident, ranging from less than 20% (Alabama, Mississippi, and Louisiana) to over 60% (Massachusetts, Rhode Island, Vermont, Hawaii, and the District of Columbia). Overall, the median value was 48%, with Obama receiving a majority of the nonblack major-party vote in 23 states. Full descriptive statistics for all three vote variables (as well as the other variables used in the analyses) are provided in table 1.
Estimated Nonblack Vote for Obama among Major-Party Voters

State-Level Descriptive Statistics

Note.a Percentages based on two-party vote.
The independent variables of nonblack partisanship and ideology were also measured using the state exit polls. Because state partisanship and ideology are typically stable over short—or even long—periods of time (Erikson, Wright, and McIver Reference Erikson, Wright and McIver1993; Erikson, Wright, and McIver Reference Erikson, Wright, McIver and Cohen2006; Brace et al. Reference Brace, Arceneaux, Johnson and Ulbig2004), in order to minimize measurement error, I pooled the 2000, 2004, and 2008 polls. Partisanship was coded 0 for Republican, 0.5 for Independent, and 1 for Democrat. Ideology was coded 0 for conservative, 0.5 for moderate, and 1 for liberal.Footnote 4
Constructing a measure of prejudice was not as straightforward. I sought a survey or set of surveys with a sufficient number of respondents across the states to permit the creation of a reliable state-level measure. Standard academic surveys did not meet the criteria. Fortunately, the PEW Research Center Values Study (Pew Research Center for People and the Press 2010) has repeatedly asked a question about “social distance,” a common indicator of prejudice. Respondents are asked whether they “completely agree,” “mostly agree,” “mostly disagree,” or “completely disagree” with the following statement: “I think it's all right for blacks and whites to date each other.” This question was asked in 13 surveys, providing a total of almost 20,000 nonblack responses. I first coded the answers to range from 0 (completely agree) to 1 (completely disagree) and then computed state averages.Footnote 5
To facilitate comparison of the estimated effects across the three independent variables, all three were rescaled so that the 10th percentile was coded 0 and the 90th percentile was coded 1, as shown in table 1. Thus, in the OLS regressions that follow, the focus is on the estimated differences in nonblack voting behavior across the range of observed variation in the independent variables. Figure 2 shows the rescaled values for each state on the prejudice scale.
Estimated Nonblack Prejudice

RESULTS
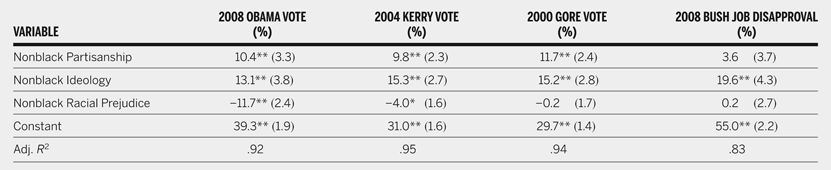
Figure 3 shows the bivariate relationship between the state-level nonblack vote for Obama in 2008 and racial attitudes. The relationship is strong, with a correlation of −.82, indicating that Obama received fewer votes in states with higher relative levels of prejudice. Table 2 reports the parameter estimates of the state-level nonblack vote for Obama in 2008. The estimated influence of prejudice is a substantial −11.7, suggesting that the difference in support for Obama between the most and the least prejudiced nonblack electorates was 11.7 percentage points. Significant in its own right, the magnitude is modestly larger than the estimate for partisanship (10.4) and almost as large as that for ideology (13.1).Footnote 6
State-Level Nonblack Prejudice and Voting for Obama

Predicting State-Level Nonblack Presidential Vote and Bush Disapproval

Notes. Standard errors in parentheses.
* p < .05;
** p < .01.
It is possible that the influence of prejudice did not emerge in response to the specifics of the 2008 campaign and Obama's race. Given the racial realignment that has taken place in the United States in the wake of President Johnson's signing of the Voting Rights Act and the Civil Rights Act (Carmines and Stimson Reference Carmines and Stimson1989) and the ongoing divergence in the racial policies endorsed by the major parties, racial considerations may now shape nonblack political behavior in general. Estimates of nonblack Democratic voting in 2004 and 2000 speak to this hypothesis.Footnote 7 As table 2 shows, for 2004 and 2000, the estimated effects of partisanship (9.8 and 11.7, respectively) nearly match the 2008 estimate (10.4). The same pattern occurs for the estimated effects of ideology (15.3 in 2004 and 15.2 in 2000, compared to 13.1 in 2008). The only noticeable difference across the three models is for racial prejudice. Compared to the estimated effect of −11.7 in 2008, the estimate for 2004 is only about one-third as large (−4.0) and the estimate for 2000 is nearly zero (−0.2).Footnote 8 More evidence that the role of prejudice was uniquely important for presidential voting in 2008 comes from the analysis of levels of nonblack disapproval of Bush in 2008. While prejudice was strongly associated with support for Obama, its influence on state-level nonblack disapproval of Bush was essentially zero, with the estimated effect being less than a single percentage point (0.2) compared to the nearly 12-point effect for 2008 presidential voting.Footnote 9 Racial prejudice does not manifest as a pervasive influence on behavior and opinion. Instead, its influence appears to have been triggered by the presence of Obama.
A final piece of evidence suggesting the unique role that prejudice played in voting in 2008 comes from an analysis of change in the nonblack Democratic vote from 2004 to 2008. Table 3 reports the parameter estimates. Vote change is negatively associated with prejudice: nonblack electorates with higher levels of prejudice moved relatively less toward Obama than did electorates with lower levels of prejudice. The estimated difference in movement toward Obama between the most and least prejudiced states was 9.4 percentage points. Neither state partisanship nor ideology is significantly related to vote change between 2004 and 2008.
Predicting Change in State-Level Nonblack Presidential Vote from 2004 to 2008

Notes. Adj. R 2: .31.
* p < .05;
** p < .01.
Clearly, the overall influence of prejudice did not prevent Obama from winning the presidential election, so in that sense, prejudice was not a decisive factor in the outcome. However, one implication of the findings reported here is that Obama would have won more votes and possibly more states had there been less prejudice. This relationship is an important aspect of the election, because the margin of victory affects a president's subsequent ability to influence the policymaking process (Grossback, Peterson, and Stimson Reference Grossback, Peterson and Stimson2007).
To predict how much better Obama would have done if there had been less prejudice in the election, I estimated how state-level outcomes would change if racial attitudes were at the level observed for the state at the 10th percentile of the prejudice scale—the level recorded for the state of California.Footnote 10 The procedure involved several steps. First, for each state, I used Clarify (King, Tomz, and Wittenberg Reference King, Tomz and Wittenberg2000) to simulate 10,000 estimates of how much the nonblack vote for Obama would change if the level of prejudice were equal to the California level rather than the actual, observed levels in the respective states.Footnote 11 Each of 10,000 values for each state, multiplied by the proportion of nonblacks in the voting population, is an estimate of how much Obama's overall vote share would change if the level of prejudice were reduced. Added to Obama's actual share of the presidential vote, these values are estimates of the state outcomes, with prejudice reduced. Table 4 reports the results for the 22 states that McCain won (i.e., states that Obama might have won had there been less prejudice). First, consider the average predicted outcome across the 10,000 simulations. For example, Obama narrowly lost the state of Missouri, with 49.9% of the two-party vote. His average predicted vote across the 10,000 simulated Missouri elections with the level of prejudice reduced is 55.8%. As table 4 shows, there are 9 states, including Missouri, where the average predicted vote for Obama climbs over 50% when the level of prejudice is low. Combined, these states had a total of 70 electoral votes. Adding this number to the 365 electoral votes that Obama received from the states he actually won produces an electoral vote landslide of 435–103.
Simulated Outcomes if the Levels of Prejudice Were Reduced, for States that Obama Lost

Notes. States in italics are those for which the average predicted vote is greater than 50%.
a Overall Obama percentage of the two-party state vote—i.e., actual election outcome. bBased on 10,000 simulated elections, with the value of prejudice set to the value observed for the state at the 10th percentile of the prejudice scale. Simulations take into account the observed levels of prejudice in the states and the sizes of the nonblack electorates. cProportion of each state's 10,000 simulations in which the Obama vote is greater than 50%.
Another way to summarize the results is to examine them simulation by simulation. Across each of the states in each of the 10,000 simulations, I assigned Obama either a “win” or a “loss” based on whether his vote share in a state exceeded 50%. For example, the results of the first simulation yielded 10 additional wins (out of the 22 originally won by McCain) for Obama, collectively worth 66 electoral votes. In the second simulation, Obama won 14 more states, worth 122 electoral votes. Across all 10,000 simulations, the average increase in Obama's electoral vote was 86, with 95% of the simulations producing increases between 35 and 134 electoral votes. Given the 365 electoral votes that Obama gained from the states he actually won, the predicted Obama electoral vote rose to 451 (365 + 86), with a 95% range of 400 to 499.
The key source of the larger average electoral vote in the second method (451 electoral votes) compared to the first (435 votes) is Texas and its 34 electoral votes. As table 4 shows, when prejudice is reduced, the average predicted vote for Obama in Texas rises to 49.5%, not enough to clear the 50% hurdle and thus add Texas to the nine states produced by the first method. But when using the second method—as shown in the last column of table 4—in 46% of the 10,000 simulations, the predicted vote share in Texas does exceed 50%. In those simulations, Obama is credited with Texas's 34 electoral votes. Finally, it is important to note again that neither approach produces predictions for how outcomes would change if prejudice were at its theoretically lowest possible value. Instead, the predictions are for how outcomes would change if prejudice were at the level observed for the state at the 10th percentile of actual values.Footnote 12
DISCUSSION AND CONCLUSION
It comes as no surprise that prejudice appears to have influenced the state-level outcomes in the 2008 presidential election, in which Barack Obama was the first major-party African American candidate.Footnote 13 However, the finding that the influence of racial attitudes on voting was on par with the influence of partisanship and ideology is more striking. While consistent with previous individual-level analyses of presidential voting in 2008, the findings reported here are not consistent with the results in the one other aggregate study of racial attitudes and voting for Obama. Mas and Moretti (Reference Mas and Moretti2009) analyze the county-level change in voting between 2004 and 2008 and include the state-level social distance measure of prejudice from the General Social Survey (GSS) that asks about support for laws against interracial marriage. The study concludes that “the data that are available do not suggest that racism played a major role” (Mas and Moretti Reference Mas and Moretti2009, 329). A definitive explanation for the conflicting patterns of results is not possible in this article. However, two possible contributing factors are worthy of comment. First, the state-level measure of prejudice Mas and Moretti used is based on 8,757 individual responses, averaged to the state level. The corresponding sample size for the measure used here is more than double (19,395), which may have had the effect of producing a more reliable measure of prejudice. Second, the dependent variable used in Mas and Moretti is the actual county-level vote, which includes the African American vote and may have confounded the results. In contrast, all of the dependent variables employed in this article are based on the preferences of nonblacks only.Footnote 14
In conclusion, while prejudice appears to have significantly held down Obama's vote shares and electoral vote in the 2008 presidential election, there is reason for optimism regarding the influence of prejudice over the longer term. Hajnal has argued that when African Americans are elected to office (often in the face of strenuous opposition of whites), white voters' worst fears about the consequences do not come to pass (Reference Hajnal2001; Reference Hajnal2006). Rather,
For the vast majority of whites, their world under black leadership is almost identical to their world under white leadership…. Black representation, therefore, serves an enormously important … informational role. The greater the number of African Americans elected to positions of power, the more whites will learn about the effects of their leadership, the less they will fear it, and the more likely they will be to vote for black candidates in the future.
(Hajnal Reference Hajnal2001, 603–04)For nonblack voters, then, the opportunity to observe Obama behaving in the same manner as other Democratic presidents may have the effect of improving his reelection prospects and the election prospects of other African American candidates.