I. INTRODUCTION
Gallium arsenide (GaAs) is a superior semiconductor material for Monolithic Microwave Integrated Circuits (MMICs) due to its ability to handle signals at higher frequencies, at the same time, generate lower noise.Reference Smith, Le, Diadiuk, Hollis, Calawa, Gupta, Frankel, Dykaar, Mourou and Hsiang1,Reference Lam and Macdonald2 The MMIC components are designed to operate under harsh conditions, which involve considerable thermal and mechanical stresses. Metal-insulator-metal (MIM) capacitors are the most popular components for GaAs-based MMICs devices.Reference Hallakoun, Toledo, Kaplun, Bunin, Leibovitch and Shapira3 To ensure the reliability of GaAs-based MIM devices, a SiN dielectric film that is deposited to protect GaAs from oxidation and corrosion must remain intact and attached to the GaAs substrate in harsh service conditions.Reference Gioti, Logothetidis and Charitidis4 Interfacial cracks induced at high stress locations would result in dielectric leakage, shorting of adjacent structures, and loss of gate control for the SiN/GaAs-based MIM capacitors.Reference Chang, Tsai, Chang, Lin and Chang5 Moreover, delamination provides a pathway for moisture incursion, which may lead to the oxidation/corrosion of the GaAs substrate. While the previous research focused on the advancement of deposition techniques of the dielectric layer, e.g., Ref. Reference Chang, Cibuzar, Vanhove, Nagarajan and Pande6, little was done on the characterization of its adhesion properties onto the substrate.
The difficulty in characterizing interfacial adhesion lies in the complicated nature of the failure mechanism of the interface. In the last several decades, attempts to measure the interfacial properties have been made through indenting,Reference Chang, Tsai, Chang, Lin and Chang5,Reference Yeap, Zeng, Jiang, Shen and Chi7–Reference Rosenfeld, Ritter, Lardner and Lin9 scratching,Reference Perry10 stressed over-layer testing,Reference Volinsky, Moody and Gerberich11 pull-out tensile testing,Reference Rosenfeld, Ritter, Lardner and Lin9,Reference Zhang, Wang, Zeng, Khor, Weng and Sun12 tape peel testing,Reference Jacobsson13 and four/three-point bending.Reference Rosenfeld, Ritter, Lardner and Lin9,Reference Dauskardt, Lane, Ma and Krishna14 In particular, indentation enables the investigation of interfacial adhesion of a film/substrate system to be undertaken in a controllable manner by generating interfacial cracks on a sufficiently small scale and at a specific site.Reference Zhang and Zhang15 A number of models were established for quantifying the interfacial toughness (K in) or energy release rate (G in) via indentation, among which stress field analysis and energy methods were two major approaches. Stress field analysis required an intense modeling process that was complicated,Reference Lawn, Evans and Marshall16–Reference Alvarado-Rivera, Muñoz-Saldaña and Ramírez-Bon18 whereas the energy methodReference Xie and Huang19 was simpler and more straightforward. Using the continuum linear elasticity theory, the energy method evaluated the mechanical energy of a crack system and the surface energy associated with the formation of interfacial cracks.Reference Xie and Huang19
In the case of nanoindentation testing, the summation of the energy consumed in plastic deformation and the stored elastic energy within the material being tested was obtained by computing the area underneath a load–displacement (P–h) curve.Reference Anthony and Fischer-Cripps20 A previous study undertaken by Hainsworth et al. related the extra linear recovery at the ending of unloading to the occurrence of delamination.Reference Hainsworth, McGurk and Page21 They assumed that the mechanical work involved had limited contribution and the elastic strain energy stored in the flexed film was equal to the surface energy of the interfacial crack. Wei et al. approximated the elastic energy stored in the deflexed film as the energy associated with delamination.Reference Wei, Liang, Ai and Lin22,Reference Wei, Chio, Liang and Lin23 Both studies modeled the deflection of the delaminated film as a circular membrane. Chen et al. modified the extra linear recovery method by taking into account both the elastic strain energy and the external mechanical work.Reference Chen and Bull24–Reference Chen and Bull26 By extrapolating the initial part of an unloading curve, the difference between the extrapolated and the actual unloading curves was used to calculate the dissipated energy of the interfacial cracking. Those studies laid the foundation for the characterization of the thin film interfacial adhesion properties; however, as film/substrate structures exhibited quite different delamination characteristics,Reference Chen and Bull24 more material systems should be investigated to examine their reliability and generality.
In our previous work, the characteristics of nanoindentation-induced deformation and the delamination of SiN films on GaAs substrate were systematically studied.Reference Lu, Xie, Huang, Zou and He27 The present investigation augmented the previous study by quantifying the interfacial adhesion using an energy method. To determine the energy dissipated during film delamination, a new testing approach using a sequential dual-indentation test was developed and a uniformly loaded clamped circular plate model was adopted to estimate the delamination area. The Griffith energy balance was then used to calculate the delamination energy release rate G in.
II. THE ENERGY BASED MODEL
A. Indentation-induced interfacial delamination mechanics
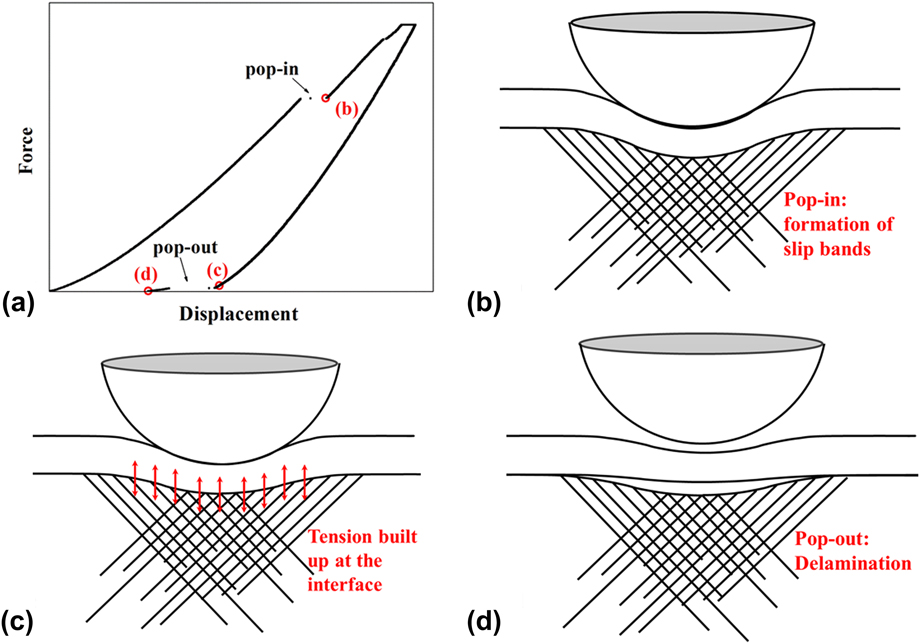
The energy model proposed in this work is based on the indentation-induced interfacial delamination mechanism that was revealed in our previous work.Reference Lu, Xie, Huang, Zou and He27 Figure 1 schematically shows the deformation stages of the SiN/GaAs film/substrate system in an indentation process. During loading, the film and the substrate initially deformed elastically under compression, and slip bands were formed in GaAs when the load was greater than a threshold value, as shown in Fig. 1(b). The plane slip led to a “pop-in” on the P–h curve, as shown in Fig. 1(a). During unloading, both the film and the substrate recovered elastically. Owing to the mismatch in elasticity and the difference in plastic deformation between the film and the substrate, tension was built up at the interface [see Fig. 1(c)]. When the tensile stress exceeded the interfacial adhesion strength, a crack was initiated at the interface and the film was then detached from the substrate [see Fig. 1(d)], leading to the occurrence of a “pop-out” [see Fig. 1(d)].
The indentation-induced deformation and delamination: (a) the indentation load–displacement curve; (b) slip bands formed in GaAs substrate during loading; (c) tension built up at the interface during unloading; and (d) the film detached from the substrate when the tensile stress was greater than the interfacial adhesion.

B. Griffith energy balance
The Griffith energy balance concept was used to obtain the energy release rate G in of the SiN/GaAs interface. It was assumed that the interfacial fracture occurred in the SiN/GaAs film/substrate structures acted as a reversible thermodynamic system, where the film and substrate were considered as two elastic bodies. For such a system, the net energy of a static crack is given byReference Cho, Lee, Yong Eun, Hee Hahn and Ko28
 $$U = {U_{\rm{e}}} + {U_{\rm{s}}} - W\quad ,$$
where U e is the strain energy stored in the elastic medium, U s is the free energy required to generate the entire crack surface, and the negative work −W is the potential energy of the externally applied loading component. To obtain the thermodynamic equilibrium by balancing the all three energy terms, it is required that
 $$U = 0\quad .$$
It is important to note that in Griffith's model, the external force at the outer boundary does positive work by pulling apart the two elastic bodies and the elastic strain energy builds up accordingly as the crack proceeds. In contrast, in the indentation-induced delamination model, the indenter does negative work (compressive) and the elastic strain energy in the film is negative (released energy). Defining W d as the external work done by the indenter, U e-d as the elastic strain energy in the deflected film, the equilibrium of the delamination system takes the form
 $$- {U_{{\rm{e}} - {\rm{d}}}} + {U_{\rm{s}}} + {W_{\rm{d}}} = 0\quad .$$
Rearranging Eq. (3), we obtain the energy required to generate the interfacial crack surface, written as
 $${U_{\rm{s}}} = {U_{{\rm{e}} - {\rm{d}}}} - {W_{\rm{d}}}\quad .$$
In a film/substrate system containing an interfacial crack of area A, the incremental increase of the crack surface energy dU s for a crack extension of dA can be expressed as the energy release rate, i.e.,
 $${G_{{\rm{in}}}} = {\mathop{\rm d}\nolimits} {U_{\rm{s}}}/{\mathop{\rm d}\nolimits} A = {U_{\rm{s}}}/A = 2{\rm{\gamma }}\quad ,$$
where γ is the free surface energy per unit area and U s equals 2γA.
C. Circular plate bending model
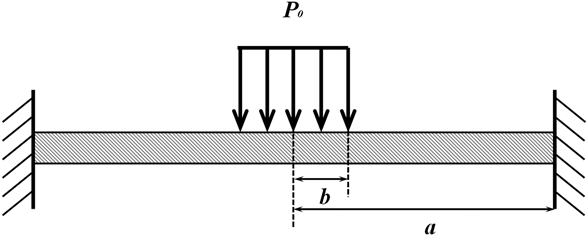
To calculate G in using Eq. (5), the delaminated area, A, must be measured. To estimate the delamination area, the detached film structure can be approximated as a clamped circular plate, as shown in Fig. 2. The delamination area is then calculated based on the deflection of the clamped circular plate. In this model, the indentation is treated as uniformly distributed load at a concentric circular area of a radius of b,
 $$b = {\left[ {R_{\rm{i}}^2 + {{\left( {{R_{\rm{i}}} - {h_{\rm{c}}}} \right)}^2}} \right]^{1/2}}\quad ,$$
where R i is the radius of the indenter (R i = 3 μm) and h c is the contact depth for a typical spherical contactReference Oliver and Pharr29 determined by
 $${h_{\rm{c}}} = h - {{0.72P} \over {{\mathop{\rm d}\nolimits} P/{\mathop{\rm d}\nolimits} h}}\quad .$$
The centrally loaded clamped circular plate model for delamination area estimation.

The radius of the delamination area a is associated with the deflection ω of the suspending film, which is written as
 $$\omega = {{{P_0}{b^2}\left( {{a^2} - 0.75{b^2} + {b^2}\ln (b/a)} \right)} \over {16D}}\quad ,$$
where P 0 is the load intensity and D is the flexural rigidity of the plate, expressed as
 $${P_0} = {P \over {2{\rm{\pi }}{b^2}}}\quad ,$$
 $$D = {{E{t^3}} \over {12\left( {1 - {{\rm{\upsilon }}^2}} \right)}}\quad ,$$
where E, t, and υ are the elastic modulus, the thickness, and the Poisson's ratio of the film, respectively. Once a is known, G in can be calculated by
 $${G_{{\rm{in}}}} = {{{U_{\rm{s}}}} \over A} = {{{U_{{\rm{e - d}}}} - {W_{\rm{d}}}} \over {2{\rm{\pi }}{a^2}}}\quad .$$
III. EXPERIMENTS
A. Specimens
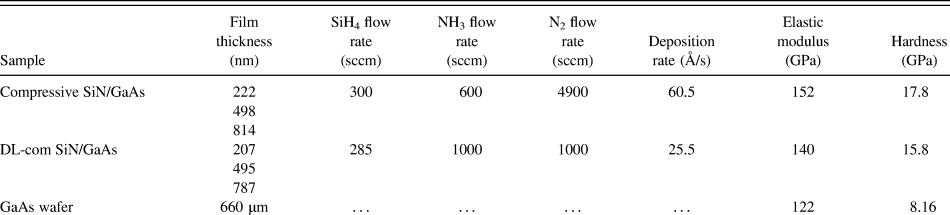
The SiN/GaAs film/substrate specimens and the GaAs (001) bare wafer used in this study were provided by WIN Semiconductors Co. (Taiwan). The SiN films were deposited using plasma-enhanced chemical vapor deposition (PECVD) on GaAs (001) substrates using a Trikon PECVD system. The compressive SiN and DL-com SiN films were deposited using two different process conditions. The deposition was performed in a nitrogen atmosphere and a gaseous mixture of SiN4 and NH3. The deposition temperatures were 250 °C and 300 °C, respectively. The silicon nitride films coated are non-stoichiometric and have amorphous structure.Reference Huang, Winchester, Suvorova, Lawn, Liu, Hu, Dell and Faraone30 The mechanical properties and the deposition conditions of the SiN films are summarized in Table I.
Deposition conditions and mechanical properties of the specimens.

B. Nanoindentation tests
Nanoindentation tests were performed at room temperature using a TI900 Hysitron Triboindenter (Hysitron, Inc., Eden Prairie, MN), which is equipped with an in situ atomic force microscope (AFM). A Berkovich indenter (Hysitron, Inc., Eden Prairie, MN) with an included angle of 142.3° and a tip radius of 100 nm was used to measure the elastic modulus and hardness of GaAs substrate and SiN films. Elastic modulus (E) and hardness (H) of the films were calculated from the P–h curve of the film/substrate specimens using a deconvolution method.Reference Huang, Winchester, Suvorova, Lawn, Liu, Hu, Dell and Faraone30–Reference Jung, Lawn, Martyniuk, Huang and Hu32 The values of E and H are shown in Table I.
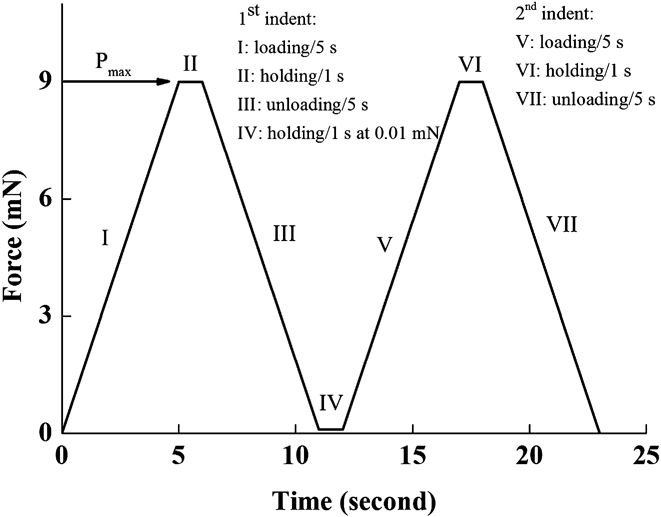
A conical indenter with spherical apex was used to study the elastoplastic deformation and interfacial delamination behavior of the film/substrate structures. The tip had an included angle of 120° and a tip radius of 3 μm. The indentation load was varied from 0.5 to 28 mN and different load ranges were applied depending on the thicknesses of the SiN films. The loading function of the sequential dual-indentation test is shown in Fig. 3. An initial indentation was followed by a second indentation, with each having the same loading and unloading conditions. The unloading portion of the first indentation ceased when the load reached 0.01 mN, so the contact between the indenter and the SiN film could be maintained. An intermediate holding period of one second was applied prior to the secondary indentation, which aims to attenuate the hysteresis in the elastic recovery of the film. The indentation impressions were examined using the in situ AFM (AIBIOS Q-scope 250/400 MOMAD, AMBIOS Technology Inc., Santa Cruz, CA). Non-contact mode probing was used to avoid damage to the surface features and to obtain the required resolution for examining the nanoscale crack structures.
The loading function of the sequential dual-indentation.

IV. RESULTS
A. Deformation behavior of SiN/GaAs film/substrate systems
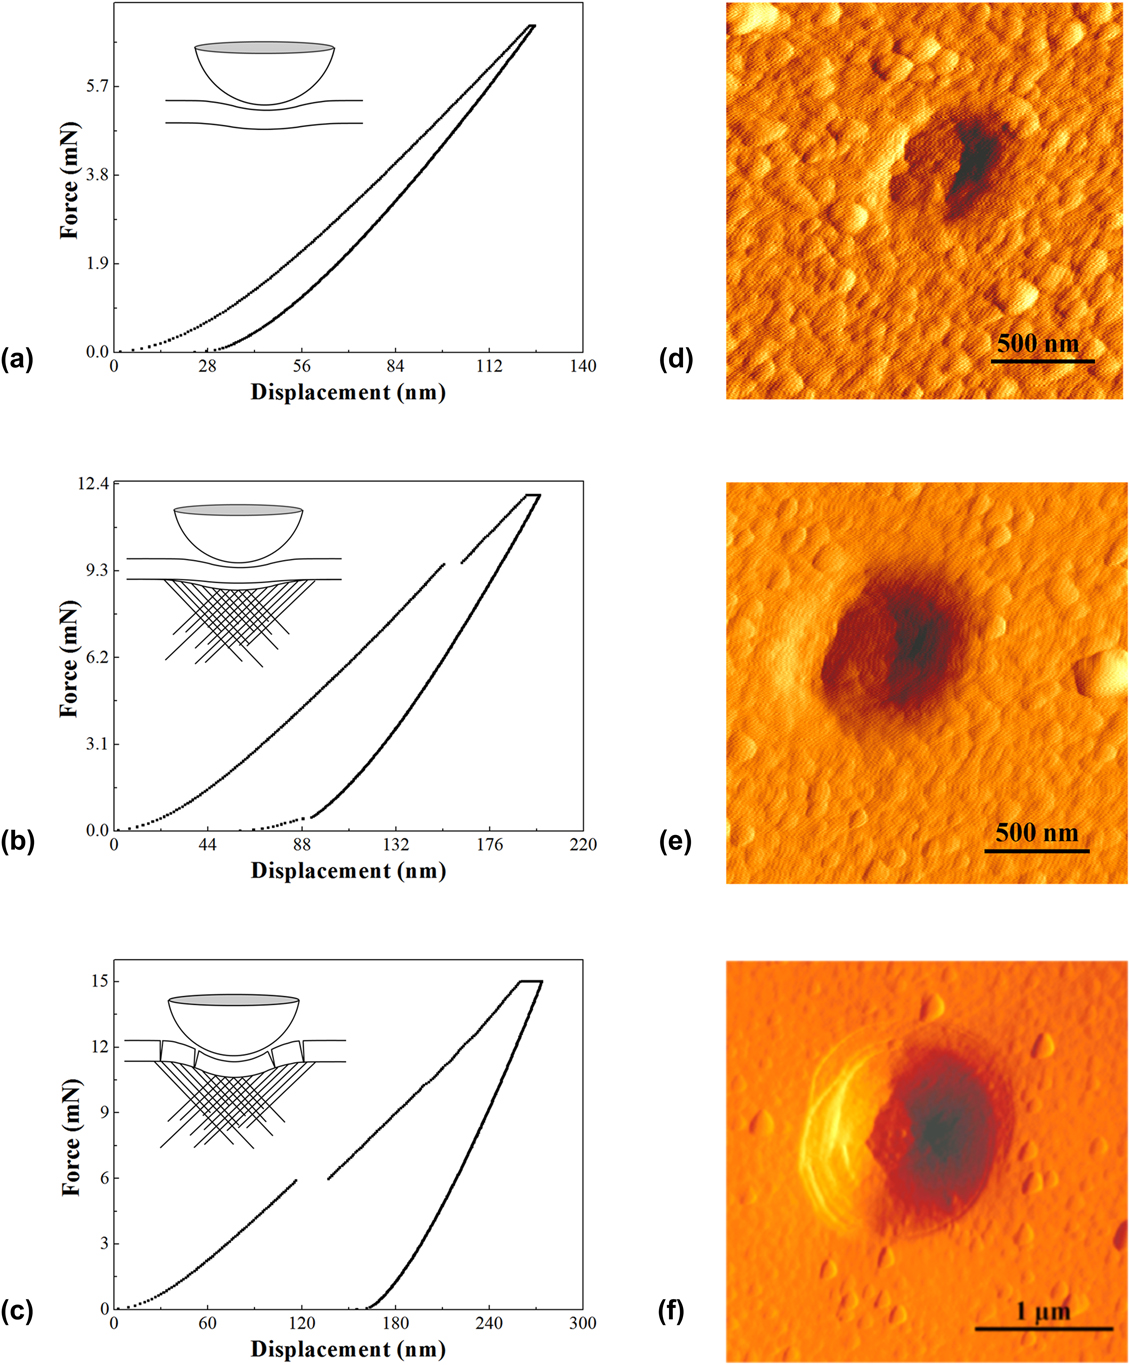
To analyze the crack initiation and propagation along the interface, the deformation behavior of the SiN/GaAs film/substrate system must be first understood. For this purpose, nanoindentation tests with loads ranging from 0.5 to 28 mN were carried out. Figure 4 shows the three representative deformation patterns observed from the P–h curves of the nanoindentation tests under different loads: (i) elastoplastic deformation, as shown in Fig. 4(a), (ii) substrate plane slip or pop-in and interfacial delamination or pop-out, as shown in Fig. 4(b), and (iii) annular film fracture, as shown in Fig. 4(c). The deformation patterns were also influenced by the film thickness, with thicker films requiring higher load for delamination or fracture. The same deformation route from elastoplastic deformation to catastrophic film fracture with the increased indentation load was found for both compressive and DL-com SiN films.
The P–h curves at loads of (a) 6, (b) 12, and (c) 15 mN. The AFM images in (d), (e), and (f) are the indents corresponding to the respective P–h curves on the left side. The indentations were made on the 495 nm DL-com SiN film on GaAs (001) substrate.

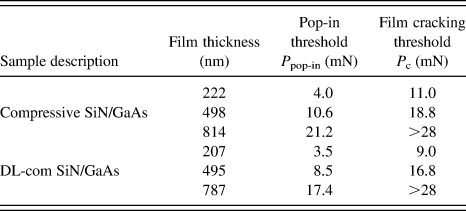
Figure 4(a) shows the indent made under the threshold load prior to pop-in, which showed relatively small plastic deformation as the impression was shallow (less than 30 nm in depth). In Figs. 4(b) and 4(c), pop-in occurred during loading, which was the response of the sudden occurrence of plane-slip in GaAs substrate.Reference Lu, Xie, Huang, Zou and He27,Reference Bradby, Williams, Wong-Leung, Swain and Munroe33,Reference Lloyd, Molina-Aldareguia and Clegg34 The thresholds for plane-slip of different specimens are summarized in Table II. Apparently, a thicker film requires a higher load to induce plane-slip. When the indentation load exceeded the pop-in threshold, but was below the load for fracturing the film, pop-out could occur during unloading.
Pop-in and film cracking threshold loads.

Also shown in Fig. 4(b), a distinct pop-out was observed at the near end of unloading, indicating the occurrence of film delamination. Our previous workReference Lu, Xie, Huang, Zou and He27 demonstrated that the delamination was induced by the tension built up at the interface associated with the mismatch in elastic–plastic properties of the film and the substrate. The corresponding AFM image in Fig. 4(e) shows a well-formed indentation impression, where no surface crack and no film buckling can be seen.
Figure 4(c) shows that at a higher load, 15 mN in this case, through thickness fracture/cracking occurred on the film. Annular or ring cracks were generated in the proximity of the contact area. The previous studies showed an annular crack often propagated through film thickness for hard brittle film/substrate systems.Reference Hainsworth, McGurk and Page21 Once the film had failed in this way, in general, delamination would be difficult to be induced as sufficient tension might not be built up at the interface due to the collapse of the cracked film. This is clearly evidenced by the P–h curve in Fig. 4(c), where pop-in, but no pop-out, can be seen and the corresponding indent has multiple ring cracks, as shown in Fig. 4(f). The critical loads for film fracture are also summarized in Table II. As expected, a higher load was required to generate cracks in the thicker films. The fracture thresholds for the 814 nm compressive and 787 nm DL-com films were higher than 28 mN, which was the maximum load applied in this study.
B. Deformation of sequential dual-indentation
Sequential dual-indentation tests were performed to study the energy equilibrium during delamination. The P max applied was higher than the pop-in threshold and below the film cracking threshold to achieve film delamination without film fracture. All the six specimens were tested and similar deforming behavior was observed. Indents were made with increased load at discrete intervals, which enabled the delamination energy and the energy release rate to be calculated as a function of the penetration depth.
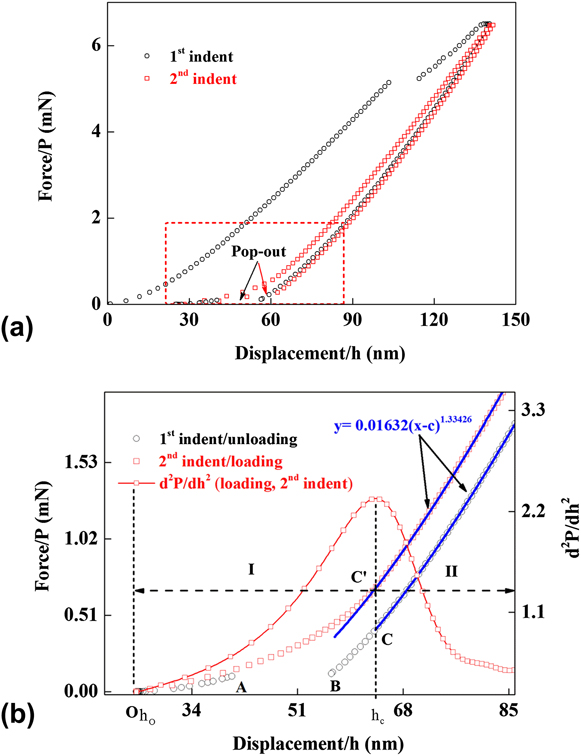
Figure 5(a) shows the typical P–h curve of the sequential dual-indention test at 6.5 mN on the 222 nm compressive SiN film. The loading and unloading curves of the secondary indentation are almost overlapped, indicating that the indentation was elastically dominated. The minor hysteresis observed in the P–h curve of the secondary indentation suggests that a small amount of plasticity did occur. The occurrence of the pop-out event at the near end of the second unloading curve should be due to the further extension of the interfacial crack (originally generated in the first indentation). Nevertheless, in this study, we focused only on the crack generated in the first indentation, due to the complex nature of the crack propagation in the secondary indentation.
(a) Typical P–h curves of a sequential dual-indentation and (b) the enlarged image of the area in the red dash line box in (a), showing the second derivative of the second indent loading portion and the curve fitting result using Hertz elastic contact theory.

The loading curve of the secondary indentation was used to compute the delamination energy release (U s) and the area being detached from the substrate or the delaminated area (A). The initial portion of the loading curve includes the responses of the detached film to elastic bending followed by the elastic deformation of both SiN and GaAs. Thus, it is essential to identify the point of gradient discontinuity, at which the detached film completed the deflection or regained contact with the substrate, to accurately obtain U s and A. Mathematically, the second derivative of the curve, i.e., d2P/dh 2 in this case, will have a cusp at the gradient discontinuity point. For this purpose, the second derivative, d2P/dh 2, of the loading curve was calculated and the d2P/dh 2 is plotted as a function of the penetration depth, h, in Fig. 5(b), where Gaussian smoothing operation was carried out to remove the noise.
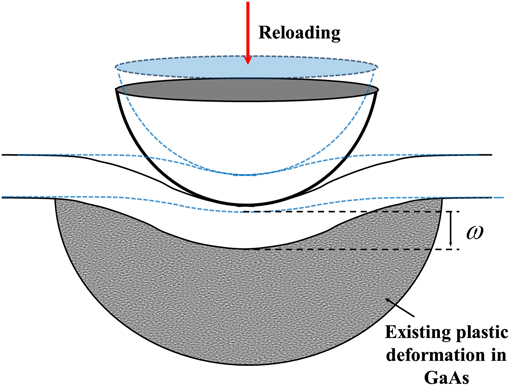
The two loading stages were evident in Fig. 5(b), delineated by the gradient cusp point at h = h c, i.e., Point C′. The stage I of the P–h curve (or the curve OC′) exhibits a distinctive elbow shape, indicating that the suspended film deflected downwards in the reloading stage. The film regained contact with the substrate at the point C′. The total deflection ω of the suspending film in the reloading stage equals (h C–h O), as shown in Fig. 5(b). From Point C′ onwards (i.e., Stage II), the reattached film/substrate system started to deform elastically as an integrated body. The reloading process is schematically shown in Fig. 6. The agreement between the measured P–h curve in Stage II and the Hertz elastic contact theory strongly supported the analysis. As shown in Fig. 5(b), the Hertz contact curves (the blue solid lines)Reference Anthony and Fischer-Cripps20,Reference Johnson35–Reference Ma, Morris, Jennerjohn, Bahr and Levine37 were expressed as
 $$P = K{(h - c)^{\rm{\beta }}}\quad ,$$
where K is a constant determined by the reduced modulus E r and the radius of the indenter, and β is determined by the geometry of the indenter and c is a constant (c is equal to residual displacement h f in fitting elastic unloading curve). Also in Fig. 5(b), the loading curve of the second indentation and the unloading curve of the first indentation were fitted using the same function, i.e.,  $P = 0.01632{\left( {h - c} \right)^{1.33426}}$, suggesting the reversed elastic deformation in the secondary indentation.
Reloading the delaminated film.

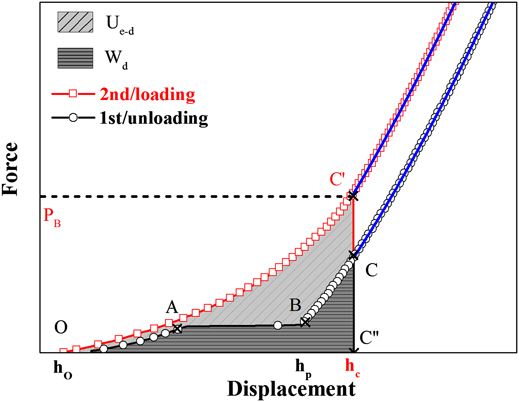
C. Delamination energy release rate G in
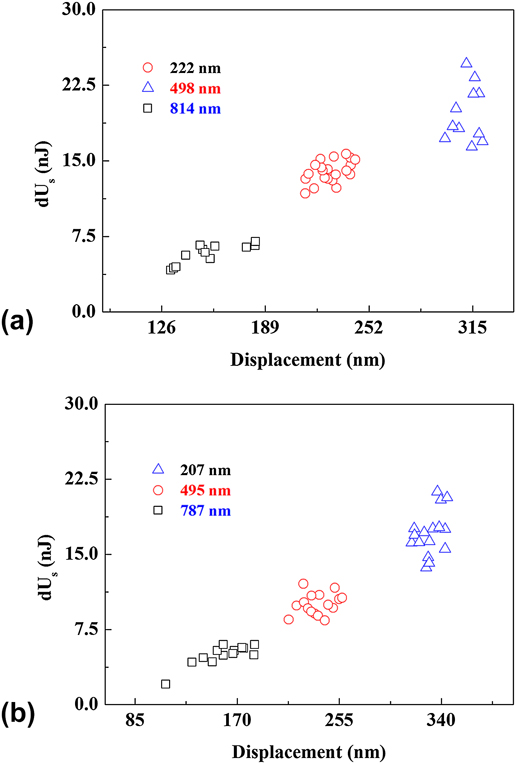
Figure 7 shows how the energy used for delamination can be obtained from the P–h curves of the sequential dual-indentation. As shown in Fig. 7, curve OC′ is the loading curve of the second indentation and is the response of the elastic bending of the detached film prior to contact with the substrate. Therefore, the area underneath the curve of OC′, i.e., the area enclosed by OC′C″O, is the stored elastic strain energy of the deflected film at h = h c. The equivalent mechanical work W d by the indenter can be calculated by integrating the unloading section over the corresponding displacement range of h O–h C, i.e., the area enclosed by OABCC″O. Therefore, according to Eq. (4), the surface energy U s can be approximated by the area enclosed by OC′CBAO. The values of U s for the six SiN/GaAs film/substrate specimens were calculated and are shown in Fig. 8. It is seen that the increase in indentation load resulted in greater surface energy. Apparently, a deeper penetration generated a larger delamination area; the resultant net surface energy was thereby higher.
Schematic illustration of the energy calculation model.

Delamination surface energy dU s plotted as a function of indentation displacement h max for (a) compressive and (b) DL-com SiN films.

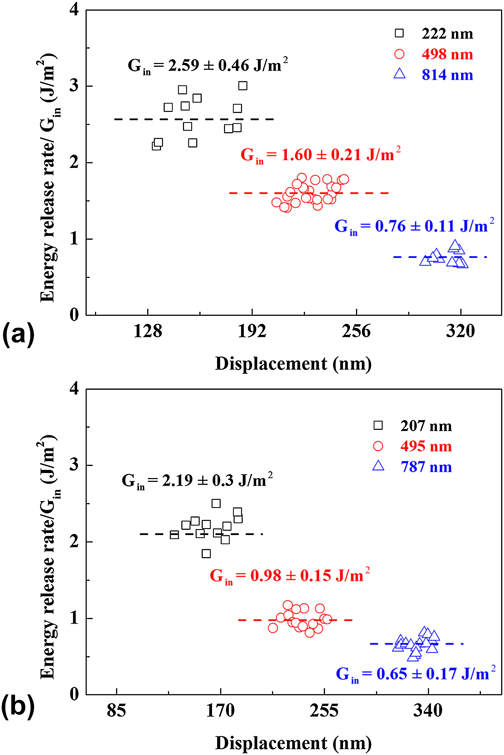
The circular plate model shown in Fig. 2 was used to estimate the delamination area A. The loading curve of OC′ of the secondary indent shown in Fig. 5(b) was approximated as the loading process on a circular plate under concentric loading. Therefore, the maximum deflection ω and the load at the maximum deflection P were obtained directly from the indentation measurements. After the area A was obtained, Eq. (10) was used to calculate G in. The values of G in computed are plotted against the penetration depth in Fig. 9. For the films with the same thickness, the values of G in appear to be independent of the indentation condition used. However, the G in value increased with the increase in film thickness. For all the six film specimens being tested, the standard deviations of the G in values are in the range of 3.2–13.8% of the average G in, indicating that the proposed method is consistent.
Calculated delamination energy release rate, G in, for (a) compressive and (b) DL-com SiN/GaAs bilayers.

V. DISCUSSION
As shown in Eq. (10), the accuracy in determining the dissipated energy for delamination and the area being delaminated would dominantly affect the accuracy of the proposed energy approach. Therefore, the nanoindentation load must be carefully chosen to avoid through-thickness cracking because cracking, or buckling, would substantially change the delamination pattern and lead to considerable elastic strain relief. The model developed in this study, however, does not account for the energy dissipation associated with either fracture or buckling.
As the interfacial delamination occurred underneath the film, it was extremely challenging to measure the delaminated area. Focused ion beam (FIB) milling was used to cross-section the delaminated area for such measurement in our preliminary study. However, it was difficult for FIB to locate the delaminated area accurately. Also, the ion beam milling could introduce microstructural modifications/damage during cross-sectioning.Reference Mayer, Giannuzzi, Kamino and Michael38,Reference Bei, Shim, Miller, Pharr and George39 Therefore, the estimation of the delaminated area using the bending plate model was important. The behavior of the flexed plates of equivalent geometries to the suspending film structure must be examined by solving the corresponding governing equations with the boundary conditions being appropriately assumed. Rosenfeld et al.Reference Rosenfeld, Ritter, Lardner and Lin9 used an annular plate model with plane stress condition along the axial direction to approximate the strain energy in the debonded coating with known geometry. Similarly, in Hainsworth's study,Reference Hainsworth, McGurk and Page21 a centrally loaded disc model was used to derive the stored elastic energy in the flexed annular coating, and a model of a circular membrane under uniform pressure was applied by Pal et al.Reference Wei, Chio, Liang and Lin23 for stress analysis of the detached film. In the above-mentioned studies, the plate bending models were used to obtain the energy by use of the stress/strain analysis of known geometries. In the present work, the detached film/delamination area A was estimated using the film deflection and loading conditions that were obtained directly from the indentation P–h curve based on the plate bending model. Assuming that the spherical apex of the conical indenter generated a circular delaminated area, the circular plate model was used for computation of the delaminated area. The firmly clamped edge was also assumed in our model because no through-thickness fracture was generated. Therefore, the assumption in our work that treated the delaminated film as a uniformly loaded circulate plate at the concentric circular area with its edge being firmly clamped was appropriate to simulate the deflection of the delaminated film.
Nevertheless, two error sources could be introduced into the calculation of the delamination area. First, small elastic–plastic deformation might occur on the film at the initial stage of the secondary loading. This would result in uncertainties in determining the plate deflection ω and the corresponding load P in Eq. (8). Assuming that 20% of the normal displacement during bending was attributed to such deformation, an error of 2–6% would be produced in the calculated G in value. Second, this method did not address the uncertainties from the variation in post-indentation film properties, such as the regional stiffening effect. However, as the SiN films were amorphous, stiffening effect was considered insignificant.
Using the proposed energy method, reasonable interfacial energy release rate G in was obtained for different samples, with very small variation in the G in values. It is well known that G in is the intrinsic property of a specific film/substrate system and should not vary with the testing conditions. The calculated G in values in this study were shown independent on the indentation load/penetration, which agrees with the theoretical concept of the energy release rate. Also shown in Fig. 9, the energy release rate decreased with the increase in film thickness, though all the other fabrication conditions remained the same. The effect of film thickness on the interfacial toughness has been reported in a number of studies,Reference Pobedinskas, Bolsée, Dexters, Ruttens, Mortet, D'Haen, Manca and Haenen40–Reference Volinsky, Vella and Gerberich43 which is associated primarily with the variation of the residual stress levels in thin films. It is well accepted that residual stresses, developed during film deposition, significantly undermine the decohesion resistence at the film/substrate interface by providing crack driving force.Reference Evans and Hutchinson44–Reference Khanna46 Therefore, it is reasonable to derive that the decrease in G in with the increase in film thickness should be attributed to the change in residual stress. In our case, the thicker the film, the higher the compressive stress could be induced, and thus the smaller the G in resulted in. Future work would be carried out to systematically investigate the effect of stress on the interfacial delamination and to verify this hypothesis.
VI. CONCLUDING REMARKS
This study systematically investigated the deformation and interfacial delamination behaviors of SiN/GaAs film/substrate systems by use of nanoindentation testing. Four types of deformation and fracture patterns were found in succession: (i) elasticity dominated deformation, (ii) elastic–plastic deformation, (iii) interfacial delamination, and (iv) film fracture.
A sequential dual-indentation approach was developed for determining the energy release rate of interfacial delamination. An analytical model that is based on the Griffith energy conservation theory was proposed to obtain the energy released for interfacial delamination and a clamped circular plate model was adopted to estimate the delamination area. The energy release rates, G in, computed are in the range of 0.76–2.59 and 0.65–2.19 J/m2 for the compressive SiN and DL-com SiN films on GaAs, respectively.
The proposed method was based on the experimental nanoindentation P–h curves to determine the interfacial adhesion property of SiN/GaAs film/substrate systems. This avoided the use of complicated computational modeling. Although this approach was developed for the specific SiN/GaAs structures, it should be readily implemented to any film/substrate systems, where interfacial delamination can be induced without damaging the film or the substrate.
ACKNOWLEDGMENTS
The authors would like to acknowledge the financial support of WIN Semiconductors Co. and Australian Research Council (ARC). This work was financially supported by ARC under the Future Fellow Program.