I. INTRODUCTION
Due to their low manufacturing costs, large-area coverage, mechanical flexibility, and light weight, organic complementary circuits comprising both hole-transporting (p-type) and electron-transporting (n-type) organic semiconductors have received increasing interest for technological as well as scientific reasons over the past two decades. Reference Klauk, Zschieschang, Pflaum and Halik1,Reference Arias, MacKenzie, McCulloch, Rivnay and Salleo2 Compared to the development of p-type organic semiconductor materials that handily demonstrate sufficient air stabilities, the development of n-type counterparts with high electron mobility still faces the challenge of improving the operational stability due to high injection barrier of electron and the intrinsic instability of organic radical anions in air. Reference Newman, Frisbie, da Silva, Bredas, Ewbank and Mann3 In general, attaching electron-withdrawing groups to the p-type organic semiconductors with extended π-conjugation area is an effective strategy to convert them to n-type materials. Reference Zaumseil and Sirringhaus4,Reference Wang, Kim, Facchetti and Marks5 A practical approach to effectively alleviating the problem with stability of n-type organic semiconductors is to create the materials with a sufficiently low level of the lowest unoccupied molecular orbital (LUMO). Reference Sancho-García, Pérez-Jiménez, Olivier and Cornil6 Therefore, developing ambient stability and high-performance novel n-type materials is currently hot topic and also a crucial challenge.
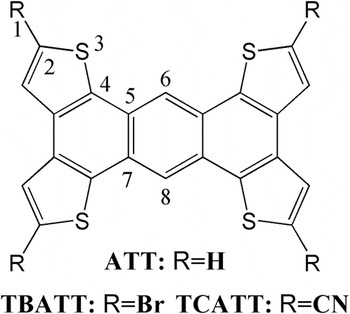
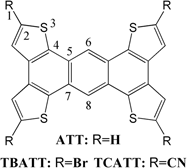
During the past few years, oligothiophenes, linear arenes, and their derivatives are the most widely studied organic semiconductors on account of their extended π-conjugation and desirable chemical and physical properties. Reference Takimiya, Ebata, Sakamoto, Izawa, Otsubo and Kunugi7 In comparison of the linear organic conjugated oligomers and polymers used, star-shaped molecules offer a number of advantages when used in organic field-effect transistors (OFETs), the disc-like molecule guarantees it good coplanarity and large overlap with neighbor molecules and leads them to have physical properties that can be markedly different from their simple, linearly conjugated analogues. Reference Kanibolotsky, Perepichka and Skabara8 As the evidence of this strategy, an innovative series of thiophene–arene semiconductors was recently reported. Liu et al. devised a simple synthesis of two sulfur-rich anthra-[1,2-b:4,3-b′:5,6-b″:8,7-b‴]tetrathiophene (ATT) heteroarenes with favorable π–π interactions. A hole mobility of 0.012 cm2/(V·s) was obtained from ATT due to morphology changes in films from less ordered to highly ordered structures after thermal annealing. Reference Liu, Zhou, Ma, Cao, Wang and Pei9 Intriguingly, the star-shaped molecule ATT not only possesses a planar and delocalized π-electron system, but also forms a highly organized two dimensional thin film network and possesses high thermal stability in air due to the extended conjugation of its ATT unit and favorable overlap packings. Reference Brusso, Hirst, Dadvand, Ganesan, Cicoira, Robertson, Oakley, Rosei and Perepichka10 Generally, many experimental and theoretical investigations have shown that, to design air-stable n-channel organic semiconductors, two strategies of functionalization have been widely exploited: (i) functionalization with electronegative halogen atoms (F, Br); (ii) functionalization with strong electron-withdrawing group (CN). Reference Hutchison, Ratner and Marks11,Reference Geng, Niu, Peng, Shuai, Coropceanu and Brédas12 Chai et al. have revealed that attaching fluorine or bromine atoms to π-conjugated systems can lower the LUMO energy level and increase the electron affinity (EA), which will facilitate the electron injection from electrodes and enhance the air-stability of n-type materials. Reference Chai, Wen, Huang and Han13 Kuo et al. have proven that the nonbonding interaction of cyano groups can enhance the delocalization of electrons and then result in a smaller reorganization energy, which will improve the mobility of organic semiconductor. Reference Kuo, Chen and Chao14 On these accounts, we investigated the charge transfer properties of the brominated and cyanated derivatives of ATT (Fig. 1). The brominated ATT of 2,5,9,12-tetrabromotristhieno[2′,3′:5,6;3″,2″:3,4;3‴,2‴:7,8]anthra[1,2-b] thiophene (TBATT) has already synthesized and its crystal structure could be used. Reference Leitch, Mansour, Stobo, Korobkov and Brusso15 However, the cyanated analogue of 2,5,9,12-tetracyanotristhieno[2′,3′:5,6;3″,2″:3,4;3‴,2‴:7,8]anthra[1,2-b]thiophene (TCATT) is not synthesized yet. We predicted the crystal structure of TCATT by the Monte Carlo-simulated annealing method with Electrostatic Potential (ESP)-fitted charges being embedded. The crystal structure thus obtained was further optimized by the dispersion-corrected density functional theory (DFT-D) method. The charge transport properties of TBATT and TCATT were predicted by the incoherent charge-hopping model. The present work intensely focuses on the influence of different electron-withdrawing groups on the crystal packings and transport properties.
Molecular structures of systems ATT, TBATT, and TCATT.

II. THEORETICAL AND COMPUTATIONAL METHODOLOGY
A. Theoretical methodology
At room temperature, the charge carriers in organic single crystals are localized and the charges transport in a sequential hopping mode between neighboring molecules which could be described by the incoherent hopping mechanism. Reference Coropceanu, Cornil, da Silva Filho, Olivier, Silbey and Brédas16 Using the hopping mechanism, the charge transfer rate between neighboring molecules, k, can be expressed by standard Marcus–Hush theory. Reference Marcus17
 $$k = {{2\pi {V^2}} \over h}{\left( {{\pi \over {\lambda {k_{\rm{B}}}T}}} \right)^{{1 \over 2}}}\exp \left( { - {\lambda \over {4{k_{\rm{B}}}T}}} \right)\quad ,$$
where V denotes the transfer integrals between two adjacent molecules in organic single crystal, λ is the reorganization energy, k B is the Boltzmann constant, and T is the temperature which is 298 K in our calculations.
In the solid state, the reorganization energy is mostly from the internal energy relaxation when the charge transports, and the contribution from the environment to the reorganization energy could be neglected. Reference Kwiatkowski, Nelson, Li, Brédas, Wenzel and Lennartz18 Thus the reorganization energy λ could be expressed by the adiabatic potential (AP) energy surface approach Reference Malagoli and Brédas19 :
 $${\lambda _ \pm } = {E_0}\left( {{Q_ \pm }} \right) - {E_0}\left( {{Q_0}} \right) + {E_ \pm }\left( {{Q_0}} \right) - {E_ \pm }\left( {{Q_ \pm }} \right)\quad ,$$
where E is energy and Q is geometry. The subscripts 0, +, and − denote neutral, cationic, and anionic states, respectively. For example, E + (Q 0) is the energy of cation with geometry of the optimized neutral molecule. Furthermore, the ionic state properties such as vertical ionization potential (IPV), adiabatic ionization potential (IPa), vertical electron affinities (EAV), and adiabatic electron affinities (EAa) were calculated by the following formulas Reference Wang, Li, Xu, Zhang and Tian20 :
 $$\eqalign{ & {{{\rm{I}}{{\rm{P}}_{\rm{V}}}} \mathord{\left/ {\vphantom {{{\rm{I}}{{\rm{P}}_{\rm{V}}}} {{\rm{I}}{{\rm{P}}_{\rm{a}}}}}} \right. \kern-\nulldelimiterspace} {{\rm{I}}{{\rm{P}}_{\rm{a}}}}} = {{{E_ + }\left( {{Q_0}} \right)} \mathord{\left/ {\vphantom {{{E_ + }\left( {{Q_0}} \right)} {{E_ + }\left( {{Q_ + }} \right)}}} \right. \kern-\nulldelimiterspace} {{E_ + }\left( {{Q_ + }} \right)}} - {E_0}\left( {{Q_0}} \right)\quad , \cr & {{{\rm{E}}{{\rm{A}}_{\rm{V}}}} \mathord{\left/ {\vphantom {{{\rm{E}}{{\rm{A}}_{\rm{V}}}} {{\rm{E}}{{\rm{A}}_{\rm{a}}}}}} \right. \kern-\nulldelimiterspace} {{\rm{E}}{{\rm{A}}_{\rm{a}}}}} = {E_0}\left( {{Q_0}} \right) - {{{E_ - }\left( {{Q_0}} \right)} \mathord{\left/ {\vphantom {{{E_ - }\left( {{Q_0}} \right)} {{E_ - }\left( {{Q_ - }} \right)}}} \right. \kern-\nulldelimiterspace} {{E_ - }\left( {{Q_ - }} \right)}}\quad . \cr}$$
Numerous theoretical works have shown that B3LY P is considered to give good evaluation for the reorganization energy of the sulphur-bearing aromatic π-conjugated organic molecules. Reference Delgado, Kim, daSilvaFilho and Brédas21,Reference Song and Ma22 So fully geometrical optimizations for ATT, TBATT, and TCATT in the neutral, cation, and anion state were performed at the B3LYP/6-31G(d,p). Reference Li, Huang and Kuo23,Reference An, Zhang, Li, Pan, Chen, Yang, Zhu, Sun, Zhang and Li24 Then the reorganization energies were calculated using the AP approach. All the above calculations were performed with the Gaussian 09 program package. Reference Frisch, Trucks, Schlegel, Scuseria, Robb, Cheeseman, Scalmani, Barone, Mennucci, Petersson, Nakatsuji, Caricato, Li, Hratchian, Izmaylov, Bloino, Zheng, Sonnenberg, Hada, Ehara, Toyota, Fukuda, Hasegawa, Ishida, Nakajima, Honda, Kitao, Nakai, Vreven, Montgomery, Peralta, Ogliaro, Bearpark, Heyd, Brothers, Kudin, Staroverov, Kobayashi, Normand, Raghavachari, Rendell, Burant, Iyengar, Tomasi, Cossi, Rega, Millam, Klene, Knox, Cross, Bakken, Adamo, Jaramillo, Gomperts, Stratmann, Yazyev, Austin, Cammi, Pomelli, Ochterski, Martin, Morokuma, Zakrzewski, Voth, Salvador, Dannenberg, Dapprich, Daniels, Farkas, Foresman, Ortiz, Cioslowski and Fox25
The calculation of charge transfer integral V is based on the molecular orbitals of the conjugated molecules. The coupling matrix element could be expressed by the site-energy corrected method. Reference Valeev, Coropceanu, da Silva Filho, Salman and Brédas26
 $$V = {{{J_{12}} - {{\left( {{E_1} + {E_2}} \right){S_{12}}} \mathord{\left/ {\vphantom {{\left( {{E_1} + {E_2}} \right){S_{12}}} 2}} \right. \kern-\nulldelimiterspace} 2}} \over {1 - S_{12}^2}}\quad ,$$
here, the transfer integral V could be written with charge transfer integral J, overlap matrix S, and site energy of monomer E. In the calculation of transfer integral in single crystal, the monomer orbitals with proper orthogonalization are used as basis sets for the Hamiltonian of the dimer system. Assuming h is the Kohn–Sham Hamiltonian of a dimer and ϕ1 H/L, ϕ2 H/L are the localized molecular orbitals of adjacent monomers. For hole transport the highest occupied molecular orbitals (HOMOs) of monomers are used as the basis function while for electron transport the LUMOs are used, and then S, J, and E could be expressed as Reference Löwdin27 :
 $$\eqalign{ & {J_{12}} = \left\langle {{\phi _1}^{{{\rm{H}} \mathord{\left/ {\vphantom {{\rm{H}} {\rm{L}}}} \right. \kern-\nulldelimiterspace} {\rm{L}}}}\left| h \right|{\phi _2}^{{{\rm{H}} \mathord{\left/ {\vphantom {{\rm{H}} {\rm{L}}}} \right. \kern-\nulldelimiterspace} {\rm{L}}}}} \right\rangle \quad , \cr & {S_{12}} = \left\langle {{\phi _1}^{{{\rm{H}} \mathord{\left/ {\vphantom {{\rm{H}} {\rm{L}}}} \right. \kern-\nulldelimiterspace} {\rm{L}}}}\left| {{\phi _2}^{{{\rm{H}} \mathord{\left/ {\vphantom {{\rm{H}} {\rm{L}}}} \right. \kern-\nulldelimiterspace} {\rm{L}}}}} \right.} \right\rangle \quad , \cr & {E_1} = \left\langle {{\phi _1}^{{{\rm{H}} \mathord{\left/ {\vphantom {{\rm{H}} {\rm{L}}}} \right. \kern-\nulldelimiterspace} {\rm{L}}}}\left| h \right|{\phi _1}^{{{\rm{H}} \mathord{\left/ {\vphantom {{\rm{H}} {\rm{L}}}} \right. \kern-\nulldelimiterspace} {\rm{L}}}}} \right\rangle \quad , \cr & {E_2} = \left\langle {{\phi _2}^{{{\rm{H}} \mathord{\left/ {\vphantom {{\rm{H}} {\rm{L}}}} \right. \kern-\nulldelimiterspace} {\rm{L}}}}\left| h \right|{\phi _2}^{{{\rm{H}} \mathord{\left/ {\vphantom {{\rm{H}} {\rm{L}}}} \right. \kern-\nulldelimiterspace} {\rm{L}}}}} \right\rangle \quad . \cr}$$
All the calculations of the transfer integrals for the dimers of the title compounds were evaluated at the PW91PW91/6-31G(d,p) level by the site-energy corrected method using the AOMix program. Reference Gorelsky, Ghosh and Solomon28 Huang et al. have reported that the PW91PW91 functional gave the best description for the bandwidth of organic solid, and researchers have obtained very good results of transfer integral using PW91PW91/6-31G(d,p). Reference Huang and Kertesz29
The charge transfer mobility, μ, is then evaluated from the Einstein relation Reference Coropceanu, Cornil, da Silva Filho, Olivier, Silbey and Brédas16 :
 $$\mu = {e \over {{k_{\rm{B}}}T}}D\quad ,$$
where e is the elementary charge and D, diffusion coefficient, is a sum of the individual diffusion coefficient along the ith hopping pathway:
 $$D = {1 \over {2n}}\sum\limits_i {{r_i}^2{k_i}{P_i}} \quad ,$$
here, n = 3 is the space dimensionality, r
i
is the centroid distance of the hopping channel i, k
i
is the hopping rate of the charge carrier in the ith pathway, and P
i
is the relative probability for charge carrier hopping to a particular ith neighbor, which is calculated as by
 ${P_i} = {k_i}{\left( {\sum\limits_j {{k_j}} } \right)^{ - 1}}$
.
The mobility orientation function is deduced to simulate the angular-resolution anisotropic mobility in the organic single crystals Reference Wen, Li, Song, Deng, Han and Goddard30 :
 $${\mu _\Phi } = {e \over {2{k_{\rm{B}}}T}}\sum\limits_i {{r_i}^2{k_i}{P_i}} {\,\cos ^2}{\,\gamma _i}{\,\cos ^2}\left( {{\theta _i} - \Phi } \right)\quad ,$$
where γ i is the angle of hopping path relative to the plane of interest, Φ is the orientation angle of the transistor channel relative to the specific crystallographic axis, and θ i is the angle of the projected hopping path relative to a specific axis. These calculations are based on the detailed analysis of the molecular packing of organic single crystals.
B. Computational details
The prediction of crystal structures has been performed by employing the Polymorph Predictor (PP) module in Materials Studio.
31
A quantum chemical optimization for the molecule TCATT was performed by the generalized gradient approximation (GGA basis set) and the Perdew-Burke-Ernzerhof (PBE) exchange–correlation energy functional and the Gaussian ESP charges, which are better than force field charges, are obtained by the PBE functional and embedded into each atom. Then the crystal structure was predicted by the Dreiding force field, which is considered to be more appropriate force fields for molecular crystal prediction.
Reference Mayo, Olafson and Goddard32
The van der Waals energy of crystal structure was calculated by the Ewald summation in direct space with a cutoff of 6.0 Å and an accuracy of 10−4 kcal/mol−1. For TCATT, the PP calculations are restricted to the seven most probable space groups, P21/c, P1, Pbca, P212121, P21, C2/c, and
 $\bar P$
, since the statistical results from the Cambridge Structural Database system have illustrated that most of organic compounds belong to these seven space groups.
Reference Cheng, Lu, An and Zhang33
The generated structures for all seven space groups are arranged according to their energy in the list starting from the structure with the lowest energy. The predicted crystal cell parameters of TCATT for the ten crystal structures with the lower total energies are given in Table S1 in Supporting Information. The predicted crystal structures with the lowest energies were selected for further DFT calculations by using the DFT-D at the PBE level. Inclusion of the dispersion energy (-D) is usually needed to describe the solid-state packing of molecules.
Reference Ortmann, Bechstedt and Schmidt34
The optimized crystal parameters for TCATT with the lowest total energy are listed in Table S2. To evaluate the accuracy of crystal prediction method, the ATT crystal structure was predicted by an identical procedure. The predicted cell parameters for ATT were summarized as: a = 11.94 Å, b = 4.92 Å, c = 14.70 Å, α = 90°, β = 91.45°, and γ = 90°. These parameters are in good agreement with those retrieved from Cambridge Crystallographic Data Center (a = 11.29 Å, b = 5.03 Å, c = 14.31 Å, α = 90°, β = 92° and γ = 90°), demonstrating that the method is suitable for predicting the crystal structure of TCATT. The dimers of all possible hopping pathways were picked up from the crystal. Furthermore, we calculated the electronic band structures of ATT, TBATT, and TCATT by the Cambridge Sequential Total Energy Package (CASTEP) module in Materials Studio package using GGA-PBE functional and Double Numerical plus polarization basis set.
31
III. RESULTS AND DISCUSSION
A. Geometric and molecular structure
Based on the crystal structures, all the molecular geometries for ATT, TBATT, and TCATT were fully optimized at the B3LYP/6-31G(d,p) level and the optimized bond lengths, bond angles, and dihedral angels of the three compounds are collected in Table S3–S5. Reference Li, Huang and Kuo23 As seen in Tables S3 and S4, the bond length shows the difference of 0.03–0.06 Å between the calculated results and the crystal data, and the bond angles exhibit 0.1–0.5° discrepancies. Obviously, the optimized structures are in good agreement with their experimental values (crystal structures). Hence, the bond length change upon the reduction and oxidation processes were also obtained from the B3LYP/6-31G(d,p) method. It can be seen that the largest change of the dihedral angle R1–C2–S3–C4 between ionic and neutral states for the title compounds is just only 0.1°, which indicates that all charged species in the gas phase exhibit an excellent coplanarity and rigid skeleton with a high symmetry. In comparison with ATT, introducing the strong electron-withdrawing cyano group to the thiophene ring shortens the C–S bond by 0.002 Å, and prolongs the C3–C4 bond by 0.001 Å. However, the attachment of bromine atoms to the same positions prolongs the C–S bond by the 0.006 Å, but influences less on the C–C bond. To elaborate the geometric distortion quantitatively, we summed up the bond length changes (Ʃ|∆(A–G)| and Ʃ|∆(C–G)|) for the two compounds in charge carrier transport processes. Reference Zhao, Wang, Yin and Ma35,Reference Yin, Chaitanya and Ju36 Here ∆(A–G) represents the bond length difference between the anionic and neutral geometries, and ∆(C–G) denotes the bond length change between the cationic and neutral ones. The calculated Ʃ|∆(A–G)| value of TCATT reaches 0.326 Å, which is larger than those of ATT (0.309 Å), while the calculated Ʃ|∆(C–G)| value of TCATT (0.246 Å) is smaller than that of ATT (0.269 Å). Additionally, the Ʃ|∆(A–G)| and Ʃ|∆(C–G)| values for TBATT reach 0.332 and 0.337 Å, respectively. Compared with ATT molecule, it can be noticed that the geometric relaxation of TCATT is smaller in the oxidation process, but is slightly larger in the reduction process. Further analysis shows that the contribution to the geometric relaxations from the C–Br bond modification reaches 15.1 and 19.1% in the reduction and oxidation processes. When four cyano groups were introduced to the thiophene ring, the geometric relaxations from the C–C bond modification involving the CN group reach 6.13 and 1.3%, and the amounts of the C–N bond modification account for 3.8 and 0.6% in the reduction and oxidation processes, respectively. These results indicate that attachment of the bromine atoms to the ATT induces a larger geometric distortion, while introduction of electron-withdrawing cyano groups keep the coplanarity of the π-conjugated backbone of ATT, which is beneficial to the charge transport in molecular crystals.
B. Frontier molecular orbitals
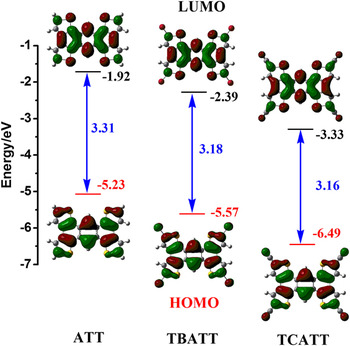
The frontier orbital characteristics as well as molecular geometry are the key to understand the charge transfer efficiency and majority carrier type. The energies of the HOMOs and LUMOs of all the studied molecules and their corresponding topologies are shown in Fig. 2. It can be found that both HOMOs and LUMOs possess π orbital features and mainly spread over the π-conjugated areas, which is dominantly the p z orbital of the carbon atoms. Reference Saranya, Navamani and Senthilkumar37 It is straightforward to see that for the HOMOs of the title compounds, most HOMOs were localized over the central area of each monomer molecule, whereas some were distributed over the C–C bonds of the anthracene and the C–S bonds in the thiophene rings. Since the HOMOs functions are more related to hole transport, the central spatial overlap area was believed to be responsible for hole migration. Compared to the HOMOs wave functions, the LUMOs of these compounds exhibited diffused distributions, and delocalization of the LUMOs over the whole conjugated system suppressed the charge recombination. This good delocalization is favorable for carrier transport. For TBATT, there is almost no orbital distribution on the bromine atoms. Thus, it can be speculated that the reduction of frontier orbital energies of TBATT is not attributed to the π-conjugation extension to the ATT skeleton, but to the electron-withdrawing effect of the bromine atoms. When the cyano group was introduced to the thiophene ring of the ATT, the LUMOs of TCATT are delocalized on the substituents. For TCATT, the strong electron-withdrawing effect of the cyano pulls the π-electron toward itself, which causes these electrons to become more delocalized. Besides, the conjugated effect of the cyano prolongs the π-conjugated system and delocalizes the π-electron further. The more delocalized distributions of LUMOs are expected to favor the electron transport along the π-orbital of nearby molecules of TCATT.
Illustration of frontier molecular orbitals energies levels and their corresponding contours for systems ATT, TBATT, and TCATT.

In comparison with ATT, the attachment of electron-withdrawing substituents to the conjugated thiophene could decrease both HOMOs and LUMOs levels to an extent and the LUMO levels are much more lowered. It can be found that the HOMOs levels of ATT and TBATT are −5.23 and −5.57 eV, respectively. These values match well with the high work-function metal of gold (5.1 eV). Reference Usta, Risko, Wang, Huang, Deliomeroglu, Zhukhovitskiy, Facchetti and Marks38 The LUMOs energies of substituted ATT derivatives (TBATT and TCATT) range from −2.29 to −3.3 eV. The lowered LUMOs levels facilitate the injection of electrons effectively which is necessary for an n-type organic semiconductor and which also contributes to its stability in the environment. For n-channel OFET materials, in which electron transport occurs predominantly by hopping through low-lying LUMOs, their energy level less than 3.0 eV in vacuum are generally necessary to ensure efficient electron injection. Reference Hutchison, Ratner and Marks11 Obviously, TCATT has the lowest low-lying LUMOs energy (−3.3 eV), indicating that electron is easier to be injected into TCATT than the parent compound pentacene. The smaller the barrier is, the easier the charge injection is. It can be found that by introducing the electron-withdrawing groups to ATT molecule, the HOMO–LUMO gap decreases clearly, indicating that the substitution of electron-withdrawing groups will be beneficial to electron transport.
C. Ionization potentials (IPs), electron affinities, and reorganization energies
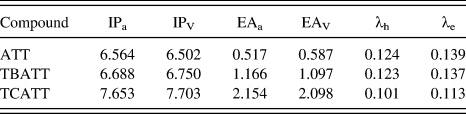
The IPs and EAs of the organic compounds are the most important parameters that characterize their oxidation and reduction stabilities, respectively. The IP and EA calculated at the B3LYP/6-31G(d,p) level are displayed in Table I. The small difference in the vertical and adiabatic values indicates that the structural relaxation upon charge injection is small. Reference Adiga and Shukla39 As seen in Table I, the values of the IP and EA increase evidently after substituent by electron-withdrawing groups in comparison with the parent ATT, which is in accordance with the calculated HOMOs and LUMOs energies as well as the above discussions. Previous studies have demonstrated that the IPa of air-stable p-channel materials ranges from 5.680 to 6.786 eV, and the materials with calculated EAa close to or higher than 2.8 eV are considered to be air stable. Reference Chang, Kuo, Chen, Lu and Chao40,Reference Liu, Mao and Kuo41 On the basis of this, the IPa of TBATT is 6.688 eV, indicating that TBATT is suitable for p-type organic material. On the contrary, the TCATT has a high EAa (2.154 eV) and high IPa (7.653 eV), which indicates that the TCATT is suitable for n-type organic semiconductor from the viewpoint of electron injection, but it is unstable as electron transport one due to the small EAa value.
The calculated IPs and electron affinities for adiabatic and vertical states and the reorganization energies for hole and electron transfer of the ATT, TBATT, and TCATT (all in eV) at the B3LYP/6-31G(d,p) level.

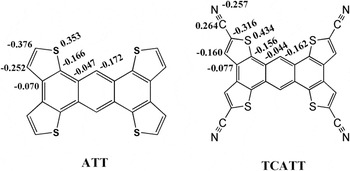
Reorganization energy (λ) is one key parameter governing the hopping rate. Generally, the reorganization energy is decomposed into the internal and external components. In our calculation, the reorganization energies only includes the internal contributions, which is induced by molecular geometric relaxation, since the contribution from the environment to reorganization energy is very weak and could be neglected. Reference Kwiatkowski, Nelson, Li, Brédas, Wenzel and Lennartz18 The reorganization energies of the title compounds were calculated at the B3LYP/6-31G(d,p) level and their corresponding values were shown in Table I. Reference Li, Huang and Kuo23 As seen in Table I, the magnitude of the electron reorganization energy (λe) of each molecule is somewhat larger than its corresponding hole reorganization energy (λh), indicating that these three compounds are suitable to p-type organic materials from the viewpoint of the reorganization energy. It can be found that when the bromine atoms are attached to ATT, the reorganization energies for hole and electron transfer decrease, which is beneficial to charge carrier transport. More intriguingly, TCATT exhibits lower reorganization energy than their parent ATT. To understand the trends of the reorganization energy, we analyzed the natural bond orbital (NBO) charges of ATT and its cyanated derivative TCATT, as shown in Fig. 3. It is seen that the populations on the C(2) atoms of TCATT are smaller than those of ATT and result in the reduction of the bonding and antibonding interactions. On the other hand, electron delocalization on the cyano groups has a strong nonbonding character. Incorporating a cyano group in ATT may not contribute significantly to the geometric distortion of the ATT skeleton, but greatly enhance the electron delocalization. Reference Mayo, Olafson and Goddard32 Thus, cyanation is an efficient way of reducing the reorganization energy. The λe of TCATT is only 113 meV, which is smaller than that of C60 (132 meV), a well-known n-type material. Reference Kwiatkowski, Frost and Nelson42 The small reorganization energy may be attributed to the extended π-electron conjugation of TCATT, which further indicates that TCATT can act as a promising n-type organic material considering its smaller λe and larger EAa.
The NBO charge population analyses of ATT and TCATT.

D. Packing motifs, transfer integral, and intermolecular interactions
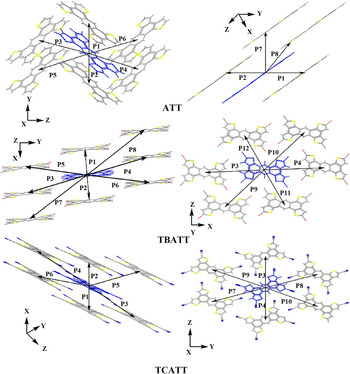
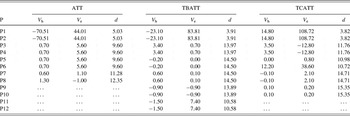
The transfer integral (V) dominated by the relative distance and orientation of the interacting molecules is one of the key parameters determining the charge mobility. Reference Tang, Liao, Gao, Geng and Su43 Based on the crystal structures of ATT, TBATT, and TCATT, the main carrier hopping pathways along the long axis and short axis are illustrated in Fig. 4 and their corresponding values of the transfer integrals are listed in Table II. As seen in Fig. 4, the crystal structure ATT exhibits a herringbone pattern and the packings of dimers P1 and P2 adopt the slipped π–π stacking, while the arrangement of other dimers are completely shifted with face-to-edge packing. Once the hydrogen atoms on the thiophene rings are substituted by the bromine atoms or cyano groups, the crystal stacking is inverted to the π–π stacking of TBATT and TCATT, which is considered to be a favorable packing with small energetic disorder and beneficial topology of charge percolating network. Reference Schrader, Fitzner, Hein, Elschner, Baumeier, Leo, Riede, Bäuerle and Andrienko44 On the whole, the packing motifs of all the compounds are sensitive to molecular conformation, suggesting that subtle changes of crystal structures may bring large changes of packing. According to Table II, the transfer integral in various hopping pathways are remarkably different and dimers P1 and P2 with π–π stacking are found to make dominant contributions to the transfer integrals, indicating that a π–π stacking gives rise to a large π-orbital overlap and hence a large transfer integral. It is noted that for the three compounds, the center-of-mass distances of dimers P1 and P2 between the neighboring molecules are quite small, while those of other dimers are larger, especially dimers P9 and P10. Besides, the values of transfer integral of dimers P9 and P10 are almost negligible compared to other dimers. When the center-of-mass distance is too far, the transfer integral is nearly zero. Thus, we can speculate that the value of transfer integral also depends on the distance between the intermolecular monomers directly interacting with each other. The transfer integrals for hole transport (V h) along dimers P1 and P2 follow the order of ATT > TBATT > TCATT. Contrarily, the electron transfer integral values (V e) along the same dimers are in a reverse order of TCATT > TBATT > ATT. Obviously, TCATT has the largest electron transfer integral (108.72 meV) since the introduction of the cyano groups extends the π–π orbital overlapping area for electron transport between the neighboring molecules. Additionally, for the substituted ATT molecules, the largest V e is much larger than its corresponding largest V h, which further indicates that the introduction of electron-withdrawing substituents could largely affect the electron transport.
Main carrier hopping pathways selected based on the crystals of ATT, TBATT, and TCATT.

The calculated hole (V h) and electron (V e) transfer integral (meV) and the center-of-mass distance d (Å) for compounds ATT, TBATT, and TCATT along different hopping pathways at the PW91PW91/6-31G(d,p) level.

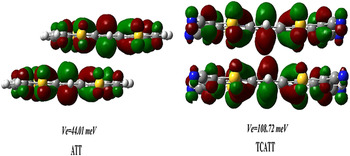
The intermolecular interactions can adjust the intermolecular packing and control the transfer integral. Reference Maly45 Therefore, to clearly discern the intermolecular interactions of the dimers in the crystal, we carried out the analysis of the intermolecular interactions for dimers P1 and P2. The overlapping of the LUMOs orbitals of dimer P1 and its corresponding transfer values for ATT and TCATT are presented in Fig. 5. It is noteworthy that dimer P1 of ATT has the smallest V e value due to a cancellation between bonding and antibonding overlaps weakening the electronic coupling. However, the LUMOs wave functions of dimer P1 for TCATT at the overlapping region possess the same phase, and thus this dimer exhibits optimal π-orbital overlap and large V e values. The large inter-orbital overlaps originate from the π–π interactions between the neighboring molecules. Reference Zhang, Zhao, Huang and Zhang46 It can be clearly seen that the attachment of cyano groups to ATT probably enlarges the overlapping area of the π orbital and hence increases the electron transfer integrals. The dimer P1 of TCATT possesses a minimum interplanar separation (3.82 Å) for the LUMOs wave functions, which strengthens the overlaps between bonding and antibonding and hence a larger V e value. As a whole, a larger overlap area of the π-orbital and a smaller center-of-mass distance between neighboring molecules contribute to the larger transfer integrals.
The LUMOs interaction as well as the value of transfer integral of dimer P1 for molecules ATT and TCATT.

E. Charger carrier and anisotropic mobilities
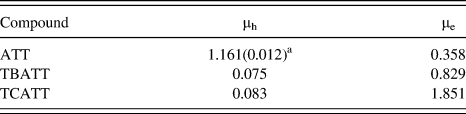
After obtaining the reorganization energy and transfer integrals, we evaluated the hole and electron mobilities of ATT, TBATT, and TCATT at the room temperature based on the Einstein equation and their corresponding values are listed in Table III. The calculated hole mobility (μh) of ATT is 1.161 cm2/(V·s), which is larger than two orders of the measured values [0.012 cm2/(V·s)] owing to a large anisotropic character in the crystal (see below in details). Reference Liu, Zhou, Ma, Cao, Wang and Pei9 Other possible reasons for the discrepancies involve the influence of the sample preparation, the polymorphism or amorphism, the electric field, the charge carrier density, and the nuclear tunneling effect in the experiments. Reference Hoang, Kim, Kim, Kim, Lee, Nguyen, Kim, Lee, Lee and Choi47 Theoretical work usually overestimates and provides an upper limit of the charge mobility, thus the difference between theoretical and experiment value is accepted. It is worth to notice that all the title compounds exhibit larger electron mobilities (μe) compared to their corresponding μh, indicating that they are expected to be n-type organic semiconductors. Additionally, their μe of the three compounds are more than 0.1 cm2/(V·s), a threshold value fully meeting the practical OFET applications. Reference Usta, Facchtti and Marks48 Among the title compounds, the μe of TCATT reaches up to 1.851 cm2/(V·s) due to its larger transfer integrals and lower reorganization energy, which is about 22 times larger than its hole mobility, indicating that TCATT should be a promising high-performance n-type organic semiconductor and be worth to synthesize.
The calculated carrier mobilities [cm2/(V·s)] for both hole and electron of ATT, TBATT, and TCATT.

a The value in the parentheses is the experimental hole mobility, measured based on film in Ref. Reference Liu, Zhou, Ma, Cao, Wang and Pei9.
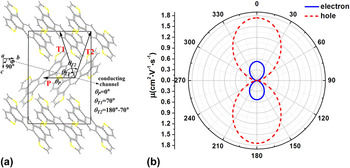
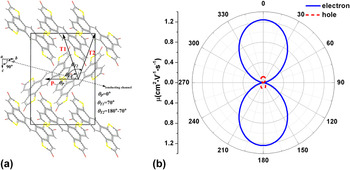
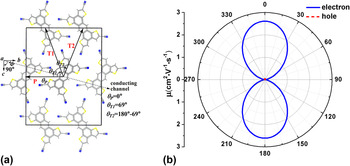
The anisotropy of mobility, namely the directional dependence of the mobility, leads to the disagreement between the experimental and theoretical data. Reference Huang and Kertesz29 Hence, the angular resolution anisotropic hole and electron mobilities of ATT, TBATT, and TCATT are depicted in Figs. 6–8, respectively. It can be found that the distributions of hole and electron mobilities for the three compounds vary a lot along the different directions and express the representative angular resolution anisotropic characteristic. As seen in Fig. 6, for the ATT, the highest hole [1.74 cm2/(V·s)] and electron [0.53 cm2/(V·s)] mobilities are along the 0 and 180° directions relative to the b-axis direction, while its lowest hole [0.002 cm2/(V·s)] and electron [0.001 cm2/(V·s)] mobilities are also perpendicular to the axes in the b–c plane, which further explains the large discrepancy between the experimental and theoretical charge mobility. The hole mobility is larger than its corresponding electron mobility, which further indicates that the ATT should be suitable for the p-type organic semiconductor. On the contrary, when the bromine atoms or cyano groups are introduced into the ATT, the electron mobilities of TBATT and TCATT are remarkably larger than that of hole mobilities. Notably, both TBATT and TCATT, the angle dependence of electron-transfer mobility in single crystal shows extraordinary anisotropic behavior. The maximum electron mobility value of TBATT and TCATT appears when the reference angle of near 0 and 180°, while the minimum appears in the c-axis direction, which corresponds to the reference angle of close to 90 and 270°. Interestingly, the maximum electron mobility of TCATT reaches up to 2.61 cm2/(V·s), which is much larger than that of perylene diimides derivatives, the most promising electron transport materials. Reference Zhou, Dong, Zhang and Hu49 Thus, the largest electron mobility in the special direction for TCATT crystal probably makes it widely applicable as a high performance n-type organic semiconductor. For TBATT and TCATT crystals, the directions of the largest electron mobilities are along the b direction correspond to the transport pathway with π–π interaction possessing larger transfer integrals, which suggests that we should choose the π–π stacking direction to obtain the optimal electron mobility in the process of device fabricating.
(a) Illustration of projecting different hopping pathways to a transistor channel in the b–c plane of ATT crystal; θP, θT1, and θT2 are the angles of P, T 1 and T 2 dimers relative to the reference crystallographic axis b; Φ is the angle of a transistor channel relative to the reference crystallographic axis b. (b) The simulated hole (red) and electron (blue) anisotropic mobilities in the b–c plane of ATT.

(a) Illustration of projecting different hopping pathways to a transistor channel in the b–c plane of TBATT crystal; θP, θT1, and θT2 are the angles of P, T 1, and T 2 dimers relative to the reference crystallographic axis b; Φ is the angle of a transistor channel relative to the reference crystallographic axis b. (b) The simulated hole (red) and electron (blue) anisotropic mobilities in the b–c plane of TBATT.

(a) Illustration of projecting different hopping pathways to a transistor channel in the b–c plane of TCATT crystal; θP, θT1 and θT2 are the angles of P, T 1 and T 2 dimers relative to the reference crystallographic axis b; Φ is the angle of a transistor channel relative to the reference crystallographic axis b. (b) The simulated hole (red) and electron (blue) anisotropic mobilities in the b–c plane of TCATT.

F. Band structure
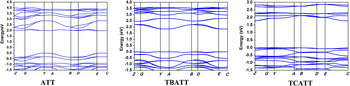
To further understand on the anisotropy of carrier transport in single crystals, the electronic band structures of ATT, TBATT, and TCATT crystals were calculated and plotted in Fig. 9. In general, the appearance of both dispersive and flat bands is an indication of anisotropic carrier transport in the crystals. The more the band dispersion is, the larger the carrier mobility is. Reference Duan, Li, Geng, Wu, Wang and Su50 It can be seen that ATT has the strongest dispersion of valence bands (VBs) among the three compounds, so it has the largest hole mobility. Besides, the strongest VB dispersion occurs in the GY subzone, corresponding to the b axis in real space, and dimers P1 and P2 with the maximum hole transfer integral are along this direction. It is noteworthy to find that the conduction bands (CBs) for TBATT and TCATT crystals are very dispersive, which is consistent with its large electron mobility, indicating that the two ATT derivatives can act as an good electron transport material. Especially, the dispersions in CB are clearly larger than those in VB for TCATT, which is in accordance with the above prediction that V e of TCATT are larger than those for hole transfer integral. Similarly, strong CB dispersion in the YA and BD directions for TCATT is also corresponding to the π–π packing that has a maximum electron transfer integral value. In a word, introduction of electron-withdrawing bromine atoms or cyano groups to ATT can improve the electron transport, which is consistent with the conclusions obtained from the hopping model discussed above.
The band structures of the crystals ATT, TBATT, and TCATT. High symmetry k-points in the first Brillouin zone are Z = (0, 0, 0.5), G = (0, 0, 0), Y = (0, 0.5, 0), A = (−0.5, 0.5, 0), B = (−0.5, 0, 0), D = (−0.5, 0, 0.5), E = (−0.5, 0.5, 0.5), C = (0, 0.5, 0.5).

IV. CONCLUSIONS
We used the combination of the Monte Carlo-simulated annealing technique with the DFT-D method to predict crystal structures of TCATT. The structural features and charge transport properties of ATT, TBATT, and TCATT were investigated by the DFT methods coupled with the charge-hopping mechanism. The calculated results reveal that the introduction of the electron-withdrawing substituents does not change the skeleton of ATT, and can stabilize the frontier molecular orbital and enhance the air stability. TCATT has the lowest-lying and delocalized LUMOs and relatively large adiabatic electron affinities, making it more suitable as n-type materials. When the hydrogen atoms on the thiophene ring are substituted by the bromine atoms or cyano groups, the crystal stacking transforms to a π–π stacking of TBATT and TCATT, which is favorable packing with small energetic disorder and beneficial topology of charge percolating network. Moreover, the π–π stacking with a short distance and the large coupling area could contribute to the largest transfer integral. Among the title compounds, TCATT has the largest electron mobility [1.851 cm2/(V·s)] due to its large transfer integrals and small reorganization energy. The simulation for the angle dependence of mobility reveals that the hole and electron mobilities in the three crystals are remarkable anisotropic, and the maximum electron mobilities were found along the crystallographic b-axis directions, which attributes to the strong π–π interactions. The band structures suggested that the paths with large transfer integrals are all along the directions with large dispersions in VB and CB. The introduction of bromine and cyano to ATT greatly changes the charge transport properties, which sheds light on molecular design for n-type semiconductors through simple chemical modification.
Supplementary Material
To view supplementary material for this article, please visit http://dx.doi.org/jmr.2016.8.
ACKNOWLEDGMENTS
The authors thank the National Science Foundation of China (No. 21372116), the Project Funded by China Postdoctoral Science Foundation (No. 2015M581083) as well as the Project Funded by the Priority Academic Program Development of Jiangsu Higher Education Institutions (PAPD) for supporting this work.