Introduction
Walentaite (Dunn et al., Reference Dunn, Peacor, Roberts, Campbell and Ramik1984; Grey et al., Reference Grey, Mumme and Hochleitner2019a), natrowalentaite (Nickel, Reference Nickel1987; Grey et al., Reference Grey, Mumme, Kampf, MacRae and Wilson2019b), halilsarpite (Husdal et al., Reference Husdal, Grey, Friis, DaL Bo, Kampf, MacRae, Mumme, Ljøstad and Shanks2020) and alcantarillaite (this study) form an isostructural series of minerals with orthorhombic symmetry, space group Imma, a ≈ 24–26 Å, b ≈ 7.4 Å and c ≈ 10.4 Å. Their general structural formula is [((A1yA1’1–y), A2)(H2O)n][Bx(As2)2–x(As3)M1(M2)2(TO4)2(O,OH)7], based on heteropolyhedral layers [M1(M2)2(TO4)2(O,OH)6] with surface-coordinated species at the B, As2 and As3 sites, and with interlayer hydrated cation groups centred at the A sites. The minerals all have dominant As3+ at the As sites and Fe3+ at the M sites and are distinguished chemically by different predominant cations at the A, B and T sites, and on this basis, they form a mineral group as defined by Mills et al. (Reference Mills, Hatert, Nickel and Ferraris2009). A proposal for a walentaite group, with the group name based on the first mineral in the group to be characterised has been approved by the Commission on New Minerals, Nomenclature and Classification (CNMNC) of the International Mineralogical Association (IMA) (Miyawaki et al., Reference Miyawaki, Hatert, Pasero and Mills2020).
Alcantarillaite is the newest member of the group. The characterisation of alcantarillaite is presented here. The name is for the locality and has been approved by the IMA-CNMNC (IMA2019-072, Hochleitner et al., Reference Hochleitner, Rewitzer, Grey, Riboldi-Tunnicliffe, Kampf, MacRae, Mumme, Kaliwoda, Friis and Martin2019). Portions of the Alcantarilla mine holotype sample used in the study are deposited in the Mineralogical State Collection Munich (collection number MSM37182) and at the Natural History Museum, Oslo (collection number KNR44147). Crystals from the holotype are deposited as a cotype in the collections of the Natural History Museum of Los Angeles County, 900 Exposition Boulevard, Los Angeles, CA 90007, USA, catalogue number 73568.
Occurrence
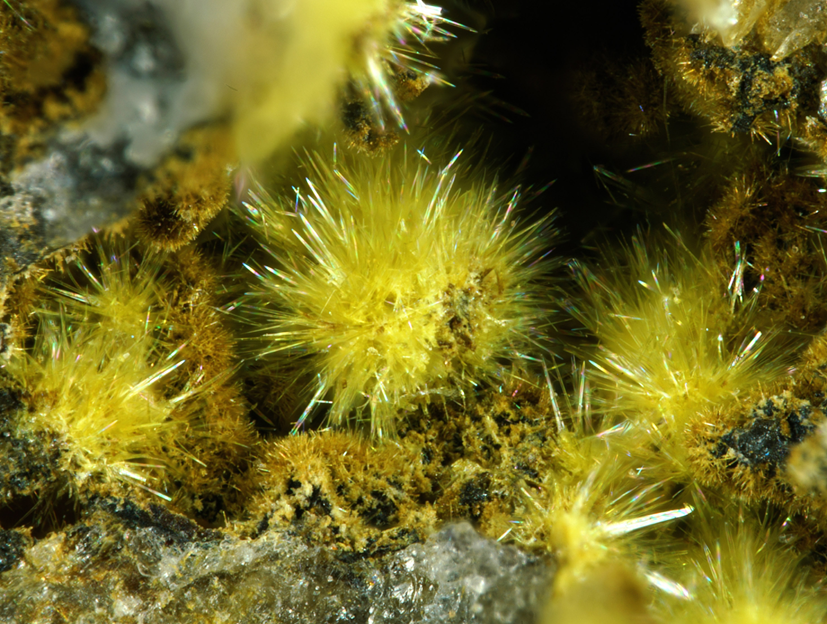
Alcantarillaite was identified on specimens from the Alcantarilla wolframite mine (Mina Nuestra Señora de Los Alcantarillas), Belalcázar, Córdoba, Andalusia, Spain (38°34′15″N, 5°3′40″W). The Alcantarilla mine is host to many secondary iron arsenites and arsenates including karibibite, tooeleite, pharmacosiderite and schneiderhöhnite (Rewitzer et al., Reference Rewitzer, Hochleitner, Fehr and Utrera2016). The specimens, including the type specimen, were obtained from within boulders at the mine dumps, but the mineral has also been found underground in a gallery by excavating löllingite pods in quartz. Alcantarilltaite most commonly is observed as lemon-yellow fillings together with massive scorodite in fissures and cracks in quartz adjacent to löllingite. It is also found as tiny rosettes lining vugs and as spheroids of ultrathin blades. From investigations on numerous samples, the main associations observed were alcantarillaite sitting on scorodite, on tooeleite, on karibibite and on pharmacosiderite. Tooeleite, karibibite and pharmacosiderite were also often found on scorodite. Primary mineral sources for the cations in alcantarillaite are löllingite (As and Fe) and ferberite (W and Fe).
Physical properties
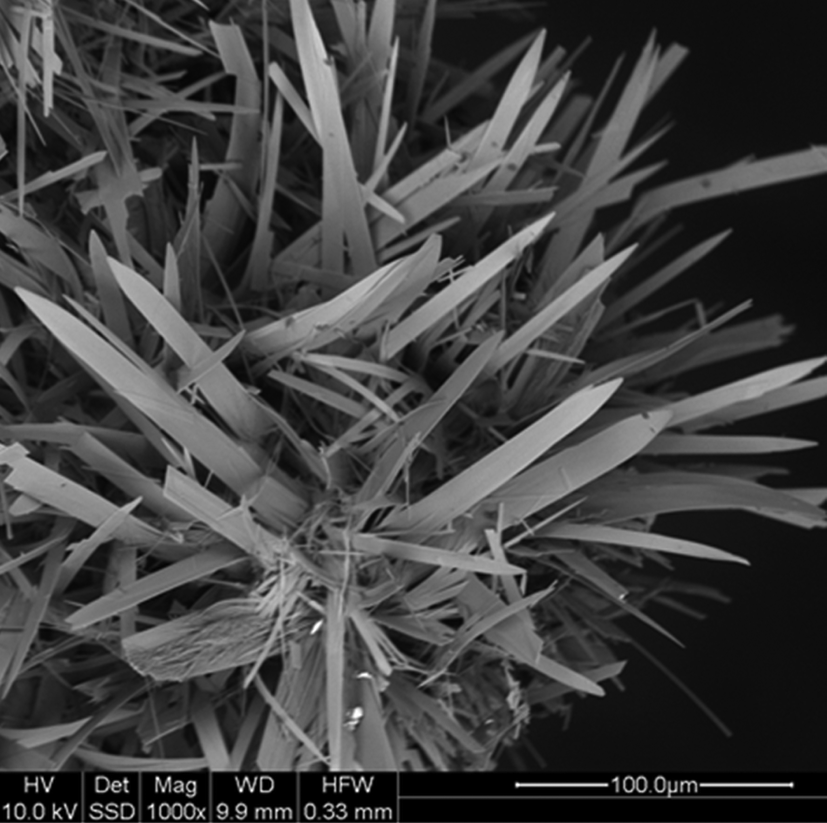
The alcantarillaite crystals used for the determination of physical properties were in the form of ultrathin elongated blades, with lengths up to 0.1 mm and thicknesses of only 1–2 μm (Figs 1 and 2). The crystals are generally curved, and show sub-parallel lamellae. They are lemon-yellow in colour with a pale-yellow streak and vitreous lustre. The crystals are brittle with uneven fracture and perfect cleavage on {100}. The calculated density is 3.06 g cm–3 based upon the empirical formula and single-crystal X-ray diffraction (XRD) cell.
Spheroids of alcantarillaite blades. Field of view = 2.6 mm, type specimen.

Back-scattered electron image of a cluster of blades of alcantarillaite (type specimen).

Optically alcantarillaite crystals are biaxial (–), with α = 1.703(calc), β = 1.800(5) and γ = 1.850(5) (white light). The measured 2V is 68(1)° from extinction data analysed using the program EXCALIBR (Gunter et al., Reference Gunter, Bandli, Bloss, Evans, Su and Weaver2004). The dispersion is r > v, moderate, and the optical orientation is X = a, Y = c and Z = b. No pleochroism was observed. Because α is perpendicular to the very thin plates, it could not be measured reliably; consequently, it has been calculated from β, γ and 2V.
Raman spectroscopy
The Raman spectrum of alcantarillaite was obtained using a Horiba XploRA system, mounted on an Olympus BX51 microscope, at the Mineralogical State Collection, Munich. By using a 100× long-distance objective, it was possible to obtain spectra from samples with a very small cross section (~20 μm). The spectra were obtained in a spectral range of 50–4000 cm–1 using a 532 nm laser. The background was subtracted by a polynomial fitting, implemented in the Horiba LabSpec Software (version 5). Peak analysis was performed by using the PeakFit Software (version 4.12). The location of bands in the region 50 to 1100 cm–1 was carried out using the Gaussian convolution method. The bands were fitted by a combination of Gaussian and Lorentzian peaks, successively optimised by iteration method, up to a squared correlation coefficient of r 2 greater than 0.990.
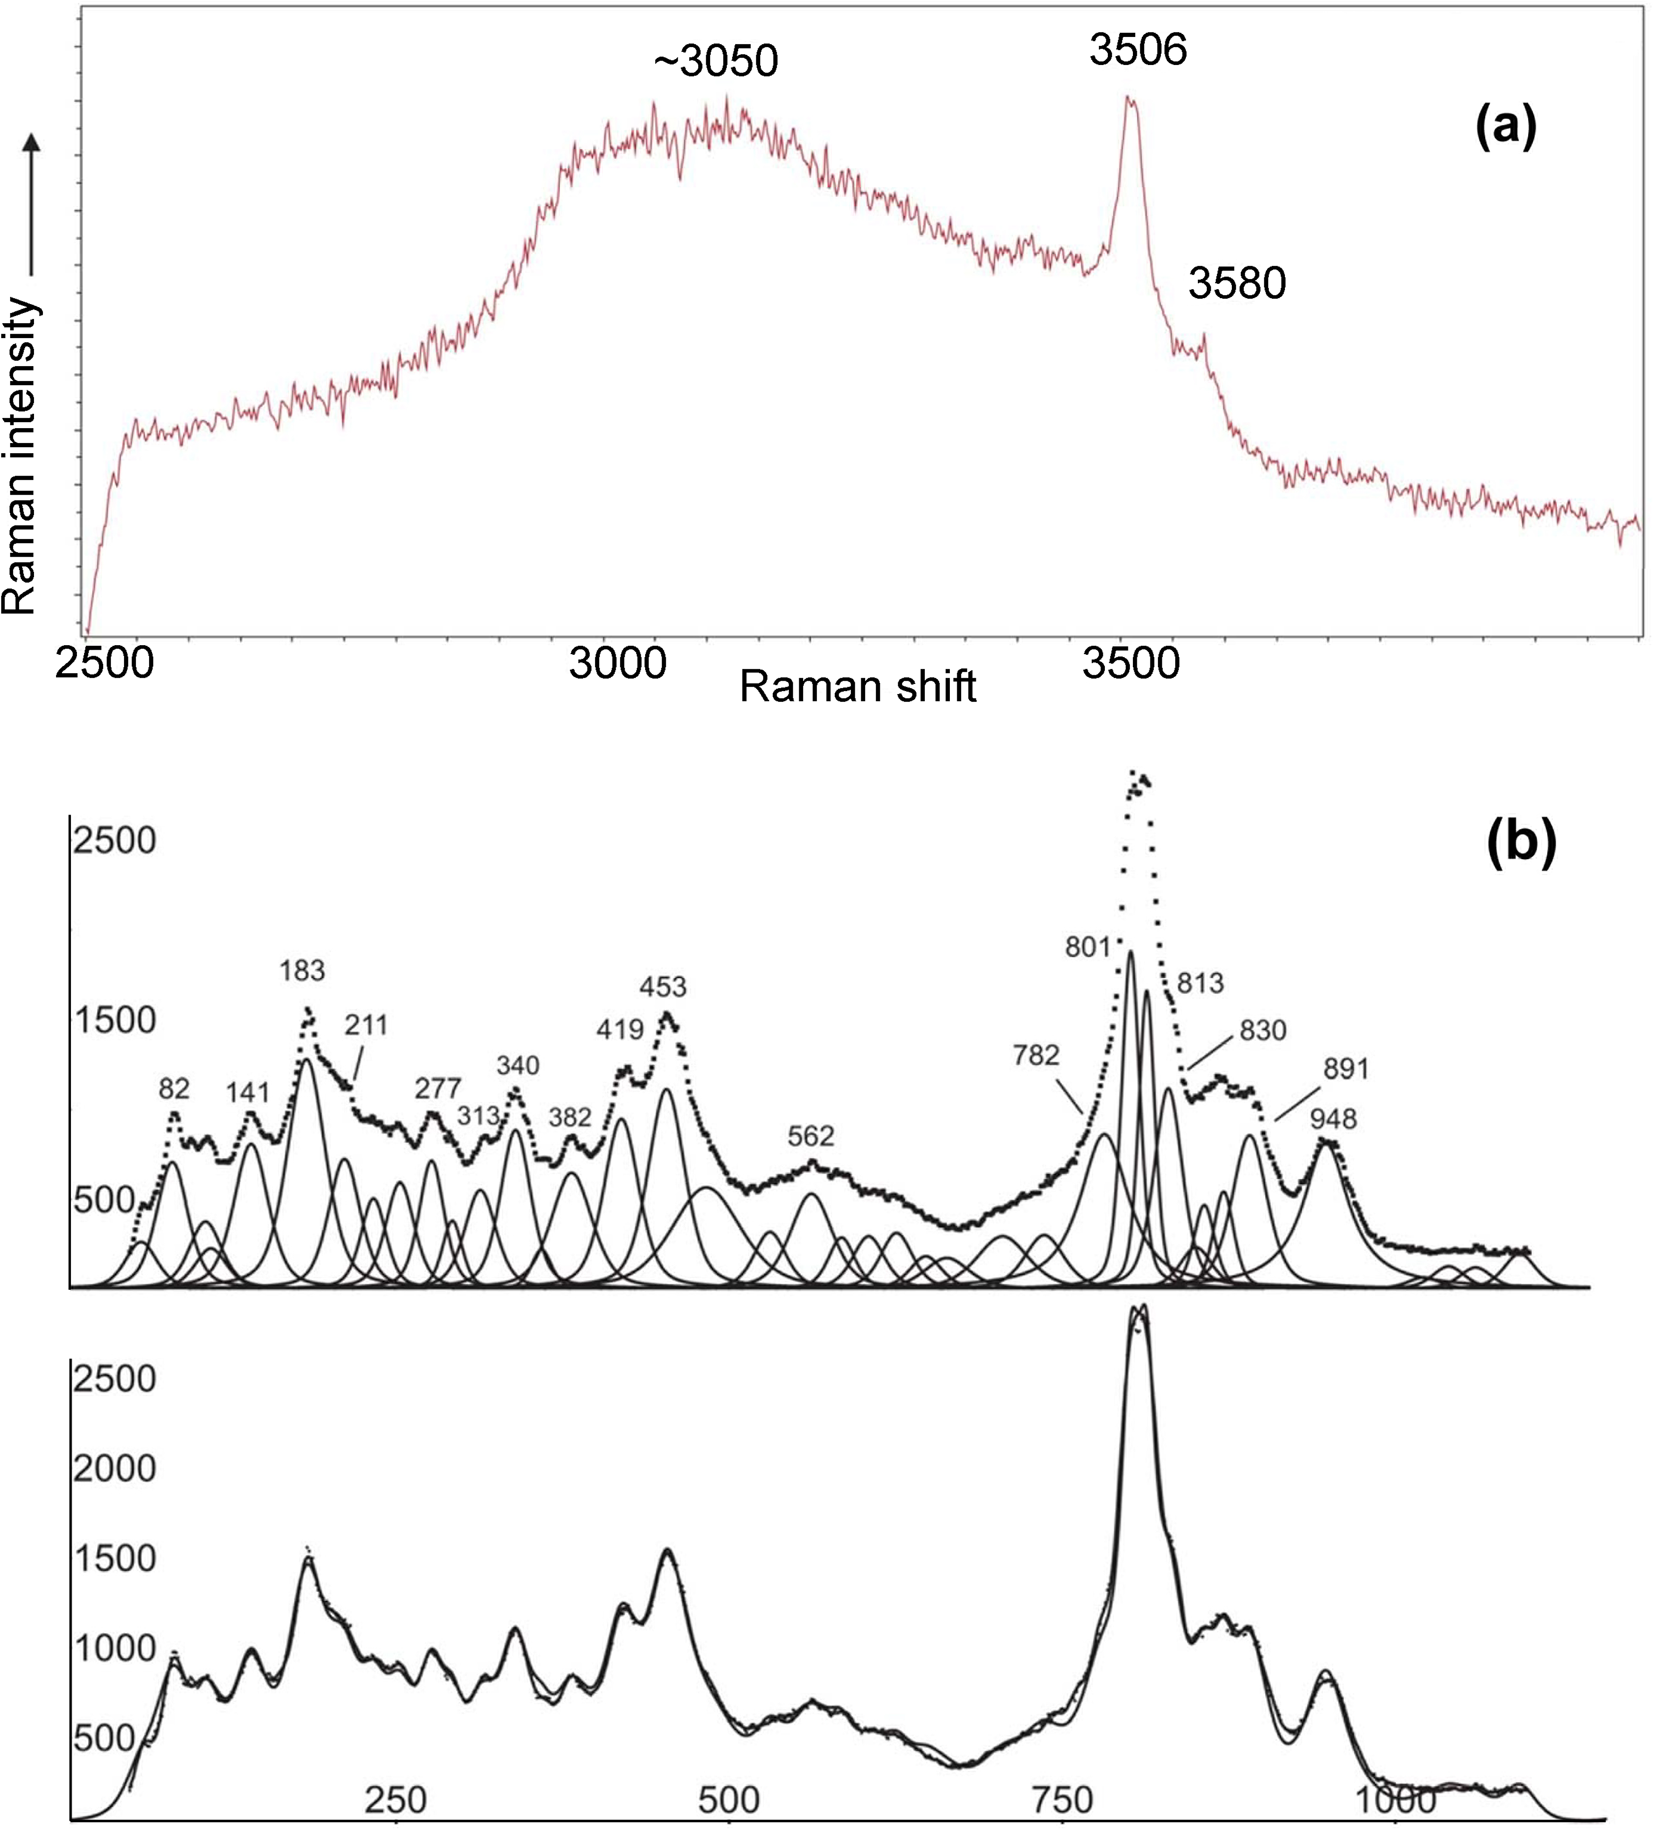
The Raman spectrum is shown in Fig. 3a for the region 2500 to 4000 cm–1 (region of O–H stretching) and in Fig. 3b for the region 0 to 1100 cm–1. Figure 3a shows two weak, sharp hydroxyl stretching bands at 3506 and 3580 cm–1 superimposed on a very broad band, centred at ~3100 cm–1, due to hydrogen-bonded H2O. The interpretation of the spectrum in the region 50 to 1100 cm–1 is complicated by the existence of both As3+ and As5+ together with W6+, so there are many overlaps. Assignments are very tentative.
Raman spectra for alcantarillaite. (a) O–H stretching region, 2500 to 4000 cm−1. (b) Fitted spectrum in the range 50 to 1100 cm−1.

The bands at 801 and 813 cm–1 can be assigned to the AsO4-stretching mode. In comparison with the spectrum of leiteite ZnAs2O4 (Frost and Bahfenne, Reference Frost and Bahfenne2010) the band at 453 cm–1 can be assigned to the ν2 As2O42– bending mode. A band at 419 cm–1 can be assigned tentatively to the δ AsO2 bending mode according to Bencivenni and Gingerich (Reference Bencivenni and Gingerich1983). The band at 830 cm–1 could be tentatively assigned to the AsO32– symmetric stretching mode (Frost and Bahfenne, Reference Frost and Bahfenne2010). W–O stretching bands mostly should be hidden under the dominating As–O stretching vibrations. In comparison with the data in the paper of Frost et al. (Reference Frost, Duong and Weier2004) on Raman microscopy of various tungstate minerals, the peaks at 891 and 948 cm–1 could be attributed to the W–O stretching vibrations as well as the peak at 782 cm–1. Note that an energy-dispersive analysis of the specimen used for the Raman spectroscopy showed negligible phosphorus, in agreement with the lack of P–O stretching vibration bands in Fig. 3b.
In the full scan, 50 to 4000 cm–1, there was no H2O bending mode peak evident in the region 1500 to 1700 cm–1.
Chemical composition
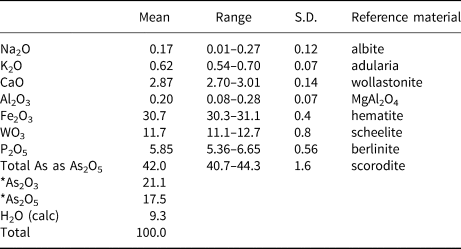
Alcantarillaite crystals were mounted in a polished section and analysed using wavelength-dispersive spectrometry on a JEOL JXA 8500F Hyperprobe operated at an accelerating voltage of 15 kV and a beam current of 4 nA. The beam was defocused to 1–2 μm. Analytical results (average of single analyses on four crystals) are given in Table 1. The As2O3/As2O5 were apportioned to give 2(As5+ + P) tetrahedral atoms per formula unit (apfu), in accordance with the crystal structure. The H2O was calculated based on the crystal structure. The results are given in Table 1. The atomic fractions, based on O = 19 apfu in accord with the structure are:
 $${\rm N}{\rm a}_{0.05}{\rm K}_{0.11}{\rm C}{\rm a}_{0.44}{\rm A}{\rm l}_{0.03}{\rm F}{\rm e}^{3 + }_{3.30} {\rm W}_{0.43}{\rm A}{\rm s}^{3 + }_{1.83} {\rm A}{\rm s}^{5 + }_{1.30} {\rm P}_{0.70}{\rm O}_{19}{\rm H}_{8.9}$$
Analytical data (wt.%) for alcantarillaite.

S.D. – standard deviation; *reapportioned based on crystal structure.
Expressing the atomic fractions in structural form gives the formula:
 $$\eqalign{\lsqb {\rm F}{\rm e}^{3 + }_{0.76} \lpar \squ _{0.27}\lpar {{\rm H}_2{\rm O}} \rpar _4\rsqb \lsqb \lpar {\rm C}{\rm a}_{0.44}{\rm K}_{0.11}{\rm N}{\rm a}_{0.05} \squ _{0.66}\rpar {\rm A}{\rm s}^{3 + }_{1.83} \cr\lpar {{\rm F}{\rm e}^{3 + }_{2.54} {\rm A}{\rm l}_{0.03}{\rm W}^{6 + }_{0.43} } \rpar \lpar {\lpar {{\rm A}{\rm s}_{0.65}{\rm P}_{0.35}} \rpar {\rm O}_4} \rpar _2{\rm O}_{6.1}\lpar {{\rm OH}} \rpar _{0.9}\rsqb $$
This formula deviates somewhat from the refined site occupancies for the A and B sites, as discussed in the structure refinement section. If a small portion of the iron is assigned as Fe2+ and located with Ca at the B site, the following empirical formula is obtained:
 $$\eqalign{&\lsqb {\rm F}{\rm e}^{3 + }_{0.52} \lpar \squ_{0.48}\lpar {{\rm H}_2{\rm O}} \rpar _4\rsqb \lsqb \lpar {\rm C}{\rm a}_{0.44}{\rm K}_{0.11}{\rm N}{\rm a}_{0.05}{\rm F}{\rm e}^{2 + }_{0.24} \squ_{0.42}\rpar {\rm A}{\rm s}^{3 + }_{1.83}]\cr&{\lsqb {{\rm F}{\rm e}^{3 + }_{2.54} {\rm A}{\rm l}_{0.03}W^{6 + }_{0.43} } \rpar {\lpar {\lpar {{\rm A}{\rm s}_{0.65}{\rm P}_{0.35}} \rpar {\rm O}_4} \rpar }_2{\rm O}_{5.86}{\lpar {{\rm OH}} \rpar }_{1.14}} \rsqb .$$
The ideal formula is [Fe3+0.5□0.5(H2O)4][CaAs3+2(Fe3+2.5W6+0.5)(AsO4)2O7], which requires Fe2O3 26.30, CaO 6.16, WO3 12.72, As2O3 21.71, As2O5 25.22, H2O 7.90, total 100 wt.%.
Crystallography
Powder X-ray diffraction
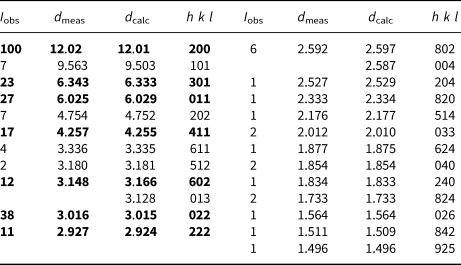
Several crystals of alcantarillaite mounted with oil on a cryo loop were used to collect powder XRD data with a Rigaku Synergy-S diffractometer, equipped with a hybrid photon counting area detector (HyPix6000HE). Data was collected in the two-theta range 4 to 82° using monochromatised CuKα radiation. A Gandolfi-like motion on the φ and ω axes was used to randomise the sample. The background was removed from the scan and Rietveld refinements were made using FULLPROF (Rodriguez-Carvajal, Reference Rodriguez-Carvajal1990). The atomic parameters were taken from the single-crystal refinement and only profile parameters were refined, giving refined unit-cell parameters: a = 24.025(16) Å, b = 7.418(4) Å, c = 10.348(7) Å and V = 1844(3) Å3. The indexed powder XRD pattern for alcantarillaite is given in Table 2.
Powder X-ray data for alcantarillaite (d in Å).

The strongest lines are given in bold
Single-crystal studies
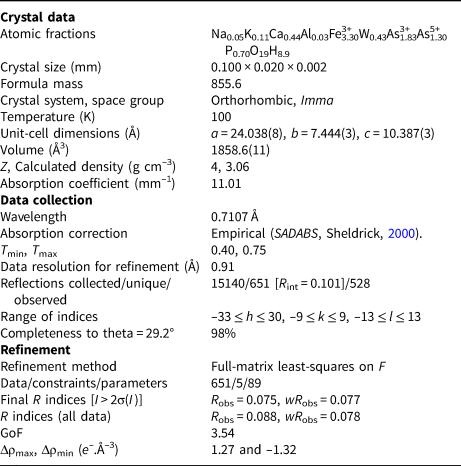
A thin blade of alcantarillaite, 0.100 mm × 0.020 mm × 0.002 mm was mounted in a fibre loop for data collection at the macromolecular beam line MX2 of the Australian Synchrotron, part of ANSTO. The MX2 beamline utilises an Eiger 16M detector operating at 100 Hz. Data were collected using monochromatic radiation with a wavelength of 0.7107 Å. The sample was placed in a stream of nitrogen gas at 100 K maintained using an Oxford Cryosystems ScryoStream 800 throughout the duration of the experiment. The experiment itself consisted of a single sweep of 360° rotation around φ. The crystal of alcantarillaite was exposed to X-rays for a total of 36 s (whilst the detector acquires the data), the resulting dataset consists of 3600 individual images with an approximate φ angle of each image being 0.1°. Prior to undertaking a final collection, individual snapshots of 20° (200 images) were undertaken to test the quality of the crystal and the required attenuation level. The best area of the sample to allow a full collection was located (towards the tip of the sample) and a level of attenuation of between 20–50% chosen during the collection. The resulting simulated diffraction pattern (merging of 10 × 0.1° frames) showed no signs of superstructure reflections, but showed weak diffuse reflections at higher angles. The raw intensity dataset was processed using XDS software (Kabsch, Reference Kabsch2010) to produce data files that were analysed using JANA2006 (Petříček et al., Reference Petříček, Dušek and Palatinus2014). Data collection and refinement conditions are given in Table 3.
Data collection and refinement conditions for alcantarillaite.

Structure refinement
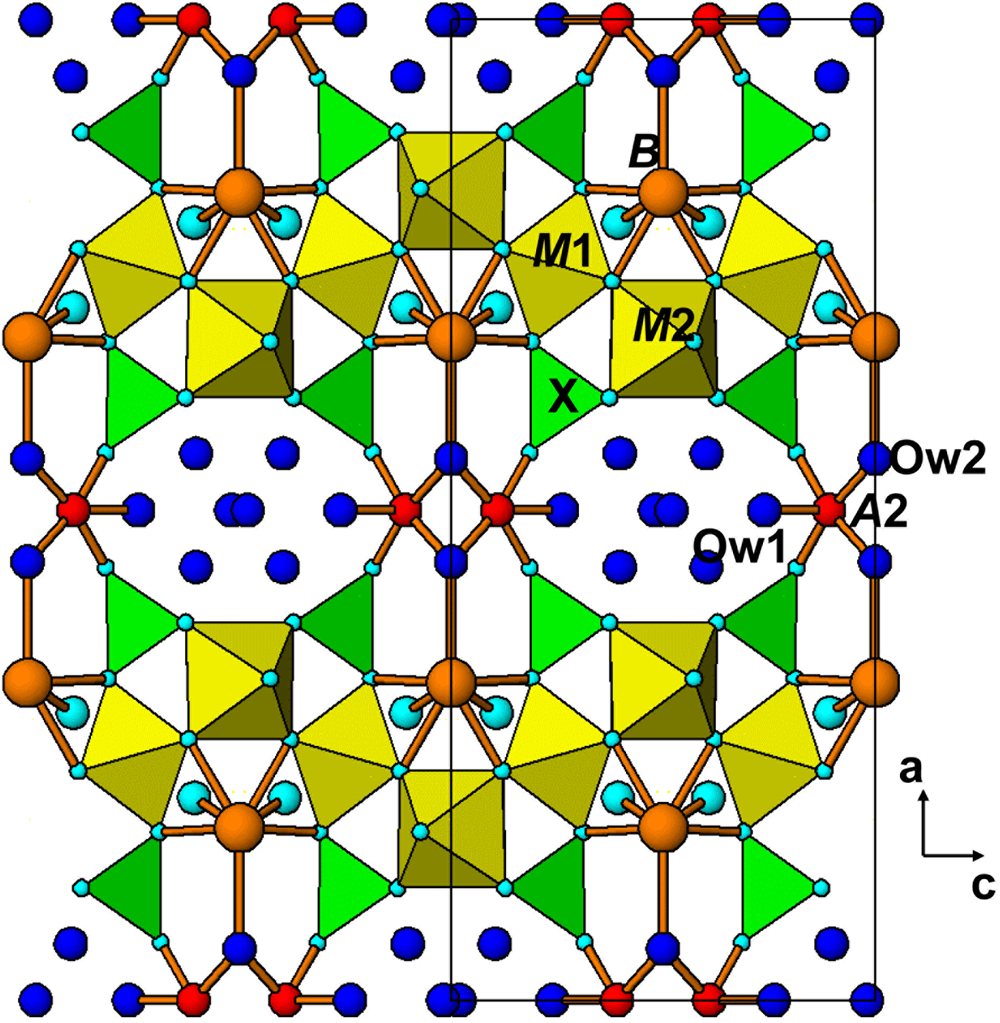
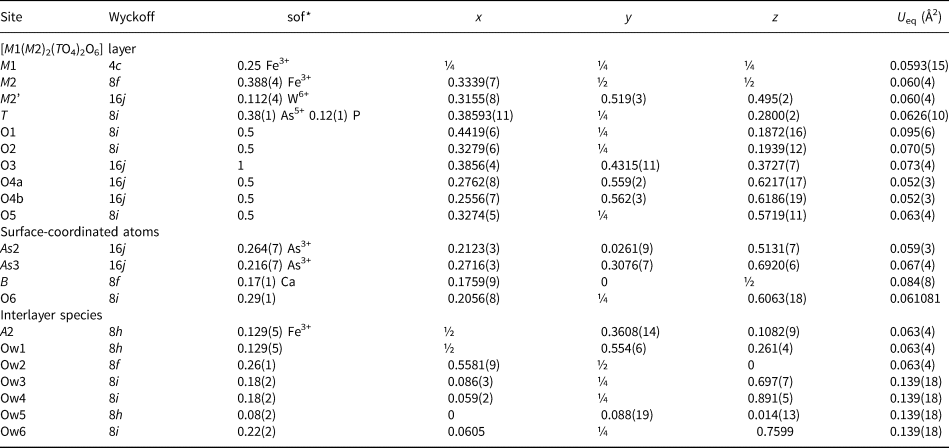
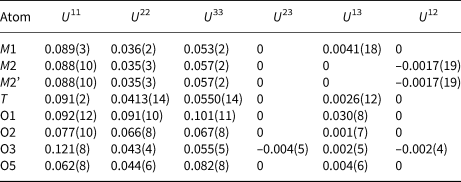
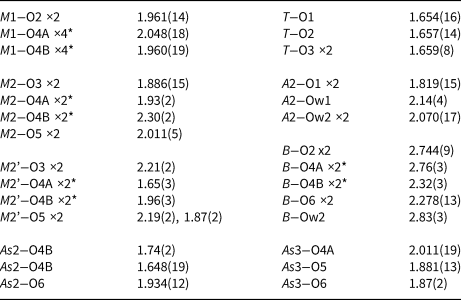
The atomic coordinates for natrowalentaite in space group Imma (Grey et al., Reference Grey, Mumme, Kampf, MacRae and Wilson2019b) were used to start the refinement, with As5+ in place of P5+ at the tetrahedral T site. The M2 and T sites were refined with joint occupancies by W/Fe and As/P, respectively. Refinement of the partially occupied A1 and A1’ sites and Ow (H2O) sites in the interlayer region resulted in their occupancy factors going to zero. Difference-Fourier maps showed a new configuration of interlayer species involving metal atoms, in site A2, coordinating to two apical oxygen atoms, O1, of TO4 in adjacent layers as well as to three interlayer H2O (Ow1 and Ow2). The resulting A2O2(H2O)3 square-pyramids form dimers by edge-sharing as shown in Fig. 4. The mean A2–O bond distance of 1.98 Å and the bond-valence sum for Fe at A2 of 2.94 valence units (Gagné and Hawthorne, Reference Gagné and Hawthorne2015) are consistent with Fe3+ occupying the A2 site. Several partially-occupied sites containing uncoordinated H2O molecules were also located in difference-Fourier maps (Ow3 to Ow6). With anisotropic displacement parameters for the heteropolyhedral layer atoms and isotropic displacement parameters for the partially occupied interlayer species and surface-coordinated cations (see Table 4), the refinement converged to wR obs = 0.078 for 651 observed reflections to a resolution of 0.91 Å. Although the data was collected to a resolution of 0.69 Å, the extremely small and curved nature of the crystal resulted in a marked deterioration of data quality at higher angles. An upper resolution limit of 0.91 Å was chosen based on where the merging R factor for equivalent reflections showed a steep increase. Other details of the refinement are given in Table 3. Sigma weights were used. The high goodness-of-fit (Gof) is not unusual for refinements using JANA, where the weighting scheme is not adjusted to minimise the Gof. The refined atom coordinates and equivalent isotropic displacement parameters are reported in Table 4, anisotropic displacement parameters in Table 5 and polyhedron bond distances are given in Table 6. The crystallographic information files have been deposited with the Principal Editor of Mineralogical Magazine and are available as Supplementary material (see below).
[010] projection of the alcantarillaite structure. Dark blue circles are H2O.

Refined coordinates, equivalent isotropic displacement parameters and site occupation factors (sof) for alcantarillaite.

*sof multiplied by 4 gives the number of atoms per formula unit
Anisotropic displacement parameters for alcantarillaite.

Polyhedral distances in alcantarillaite (Å).

*Split atoms 4A and 4B cannot be both present in same polyhedron.
The displacement parameters reported in Table 4 are quite high, particularly for the water molecule sites. This is a consequence of the very weak diffraction data obtained on the ultrathin crystal, and problems in attempting to refine both displacement parameters and site occupancies for partially occupied sites.
The refined site occupancies for the A2 and B sites in Table 4 showed a discrepancy when compared with assignments based on the electron microprobe analyses. The empirical formula, expressed in structure form and based on these analyses is:
 $$\eqalign{\lsqb {\rm F}{\rm e}^{3 + }_{0.76} \lpar \squ_{0.27}\lpar {{\rm H}_2{\rm O}} \rpar _4\rsqb \lsqb \lpar {\rm C}{\rm a}_{0.44}{\rm K}_{0.11}{\rm N}{\rm a}_{0.05}\squ_{0.66}\rpar {\rm A}{\rm s}^{3 + }_{1.83} \cr\lpar {{\rm F}{\rm e}^{3 + }_{2.54} {\rm A}{\rm l}_{0.03}{\rm W}^{6 + }_{0.43} } \rpar \lpar {\lpar {{\rm A}{\rm s}_{0.65}{\rm P}_{0.35}} \rpar {\rm O}_4} \rpar _2{\rm O}_{6.1}\lpar {{\rm OH}} \rpar _{0.9}\rsqb $$
The site occupancy refinements (Table 4) gave only 0.52 Fe at the A2 site and 0.68 atoms (using Ca electron scattering in the refinement) at the B site. A possible explanation for this discrepancy is that a small fraction of the Fe is present as Fe2+, and it is located at the B site. Transferring 0.24 Fe as Fe2+ from the A2 site to the B site gives the empirical formula
 $$\eqalign{& \lsqb {\rm F}{\rm e}^{3 + }_{0.52} \lpar \squ_{0.48}\lpar {{\rm H}_2{\rm O}} \rpar _4\rsqb \lsqb \lpar {\rm C}{\rm a}_{0.44}{\rm K}_{0.11}{\rm N}{\rm a}_{0.05}{\rm F}{\rm e}^{2 + }_{0.24} \squ_{0.42}\rpar {\rm A}{\rm s}^{3 + }_{1.83} \rsqb \cr& \lsqb {{\rm F}{\rm e}^{3 + }_{2.54} {\rm A}{\rm l}_{0.03}{\rm W}^{6 + }_{0.43} } \rpar \lpar {\lpar {{\rm A}{\rm s}_{0.65}{\rm P}_{0.35}} \rpar {\rm O}_4} \rpar _2{\rm O}_{5.86}\lpar {{\rm OH}} \rpar _{1.14}\rsqb } $$
The occurrences of alcantarillaite are so sparse that it was not possible to quantify the Fe2+ content, for example by Mössbauer spectroscopy. We obtained a positive qualitative test for ferrous iron by adding potassium ferricyanide to an acid solution of dissolved alcantarillaite crystals and observing an intense blue colouration due to the formation of a mixed ferri–ferrocyanide complex. It is worth noting that schneiderhöhnite, a mineral associated with alcantarillaite, is a mixed valence iron arsenite, Fe2+Fe3+3As3+5O13.
Discussion
An [010] projection of the average crystal structure of alcantarillaite in space group Imma is given in Fig. 4. This figure shows the [M1(M2)2(TO4)2(O,OH)6] heteropolyhedral layers with surface-coordinated B-site cations and with interlayer edge-shared dimers of 5-coordinated A2-site cations and H2O molecules. A view along approximately [100] of the interlayer polyhedra (Fig. 5) shows that the 5-coordinated A2-site cations form zig-zag edge-shared chains along [010]. The A2–A2 separations along the chains are alternately 3.07 and 1.64 Å. The latter separation is much too short for both sites to be simultaneously occupied, and so only one of the pairs of A2 sites can be occupied locally. This then gives dimers of edge-shared square-pyramids, with A2–A2 = 3.07 Å. The dimers are locally oriented either close to [011] or to [0 $\bar{1}$1] and which dimer is occupied will probably be related to the occupancies of the M2 and As2 sites in the adjacent layers. The 5-coordinated square–pyramids centred at site A2 represent a major departure from interlayer species in other walentaite-group minerals. Walentaite, natrowalentaite and halilsarpite all contain A1(H2O)6 octahedra and A1’(H2O)4(H2O)4/2 square-antiprisms, which hold the heteropolyhedral layers together by hydrogen-bonding. In contrast, the (A2)2O4(H2O)4 dimers in alcantarillaite bond directly to the heteropolyhedral layers by sharing vertices with TO4 tetrahedra. This direct bonding entails a considerable reduction in the interlayer spacing (= 0.5a) from ~13 Å in walentaite, natrowalentaite and halilsarpite to only 12 Å in alcantarillaite. The reduction in interlayer spacing is associated with a decrease in the number of interlayer H2O molecules from 6 to 4 pfu. As seen in Fig. 4, the structure of alcantarillaite contains eight-sided channels along [010] occupied by H2O molecules and is more correctly described as a 3D framework structure rather than a layer structure.
View approximately along [100] of interlayer 5-coordinated A2 sites.

Alcantarillaite, in common with natrowalentaite, has minor substitution of W6+ for Fe3+ at the M2 site. The W6+ is displaced by 0.47 Å from the 8i position occupied by Fe3+ to the general position 16j, labelled M2’ in Table 4. In this position the W6+ has two short W–O bonds, 1.65 Å (Table 6) characteristic of the tungstenyl group (Roy et al., Reference Roy, Raguz, Assenmacher and Glaum2015). The partial substitution of M 6+ for Fe3+ at M2 is counterbalanced by a decrease in the As3+ content. As shown by the ideal formulae given in the next section, walentaite has no M 6+ at M2, and has 3 As3+ per formula unit, whereas natrowalentaite, halilsarpite and alcantarillaite, all with M 6+ substitution at M2, have only 2 As3+ per formula unit (and corresponding increases in the B-site occupancy).
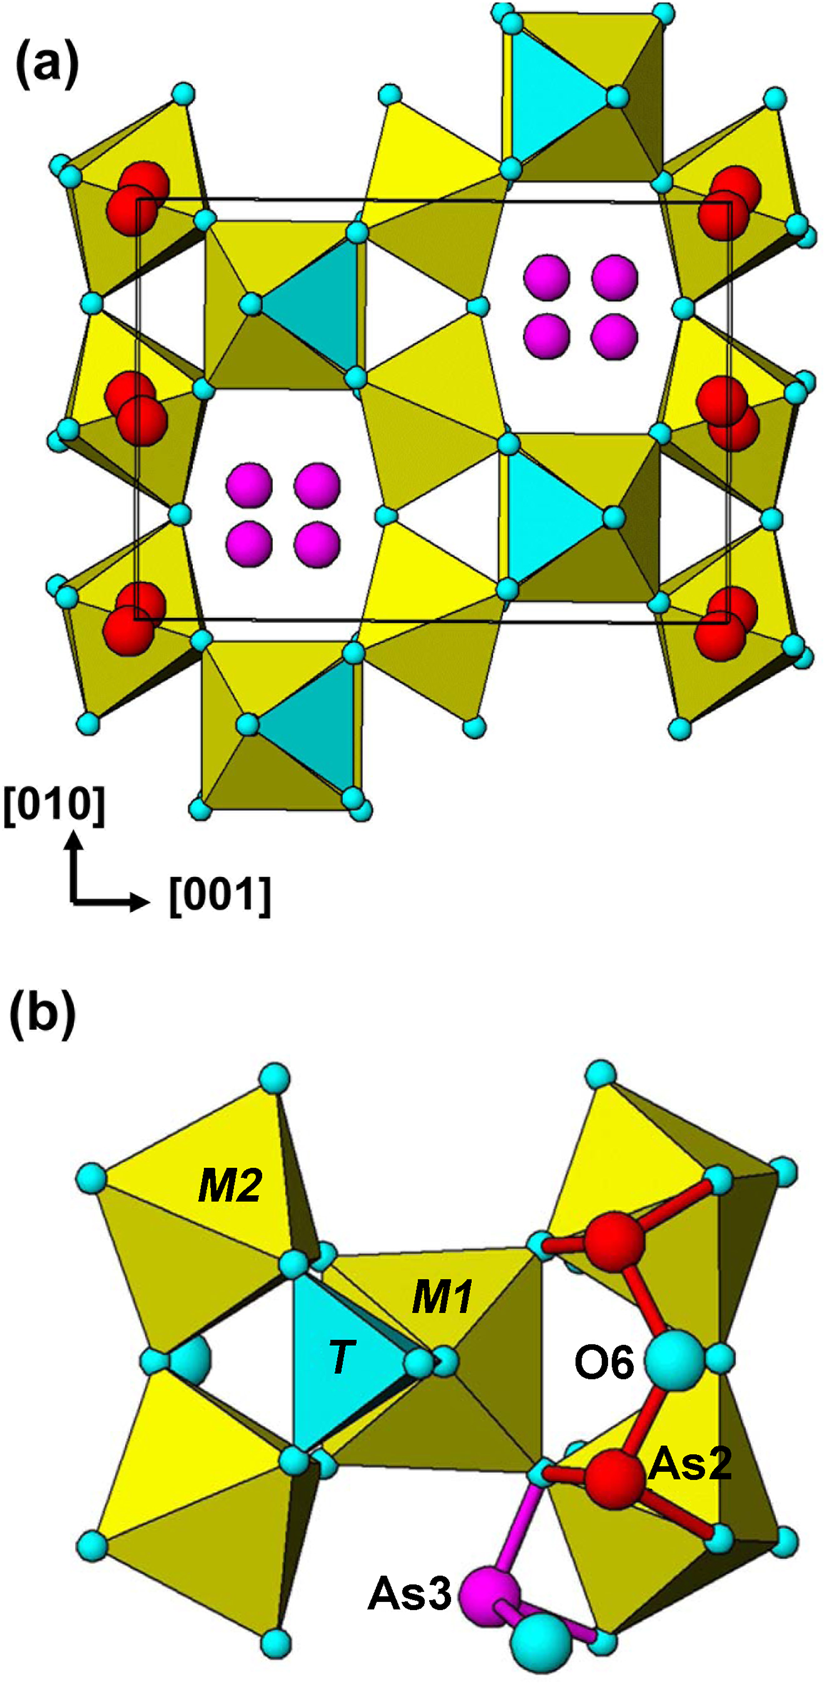
The As2 and As3 surface-coordinated sites, occupied by As3+, are shown in Fig. 6a for the average structure. Both sites are split from special positions. The As2 site is split into doublets, separated by 0.23 Å from the 8f position (x,0,0) and the As2 site is split into quadruplets, separated by 0.92 Å from the 4d position, (¼,¼,¾). We have reported previously (Grey et al., Reference Grey, Mumme and Hochleitner2019a,Reference Grey, Mumme, Kampf, MacRae and Wilsonb, Husdal et al., Reference Husdal, Grey, Friis, DaL Bo, Kampf, MacRae, Mumme, Ljøstad and Shanks2020) that a possible locally ordered configuration is a trimeric cluster, As3(As2)2O6, in which pairs of corner-connected (As2)O3 trigonal pyramids share an edge with (As3)O3. A reviewer has pointed out, however, that the As2–As3 shared-edge separation in alcantarillaite is unreasonably short, 2.65 Å. In addition, the cluster involves all three As3+ cations sharing a common anion, O6, with a formal valency of 3, and it would be expected to be unstable. We have further examined different locally ordered occupancies of the different As2 and As3 sites and have identified an alternative configuration, in space group Imm2, that is a linear trimer of corner-shared trigonal pyramids with formula As3(As2)2O7, shown in Fig. 6b. The As2–As2 and As2–As3 distances are 3.33 and 3.06 Å, respectively. A similar [As3+3O7]5– linear trimer has been reported for the heteropolymolybdate, [As3+3Mo3O15]3– by Martin-Frère et al. (Reference Martin-Frère, Jeannin, Robert and Vaisserman1991). The As3O7 cluster has an extra anion relative to the As3O6 cluster and its presence should be verifiable from refined anion site occupancies in the average Imma structure. Refinements of the As2, As3 and O6 site occupancies in walentaite-group minerals (Grey et al., Reference Grey, Mumme and Hochleitner2019a,b, Husdal et al., Reference Husdal, Grey, Friis, DaL Bo, Kampf, MacRae, Mumme, Ljøstad and Shanks2020), however, are more consistent with an As3O6 cluster composition than an As3O7 cluster. Single-crystal XRD refinements of better-diffracting crystals and/or neutron diffraction refinements are needed to confirm the configurations of locally ordered Asn3+Om clusters.
[100] projection of the structure of walentaite-group minerals showing (a) split As2 and As3 surface-coordinated cation sites and (b) a local ordering of As3+ in the As2 and As3 sites giving an [As3+3O7]5– cluster.

The distribution of surface-coordinated sites is further complicated by the As2 and B sites being separated by only 0.9 Å, so that their occupations are mutually exclusive, giving the configuration (Bx(As2)2–x) in the general formula. The crystal structure comprises numerous possible local configurations of surface-coordinated cations and the Imma structure represents an average of all such local configurations. One consequence of this, verified from single-crystal refinements of the four walentaite group members, is that the As3+–O distances are longer than normally observed for arsenite minerals, as discussed by Grey et al. (Reference Grey, Mumme and Hochleitner2019a).
The interlayer cation sites are also split, with A1 and A1’ separated by only ~1.2 Å in walentaite, natrowalentaite and halilsarpite, and the A2 site in alcantarillaite is split into doublets separated by 0.82 Å from the 4e position (0,¼,z). There is evidence, from the study on walentaite (Grey et al, Reference Grey, Mumme and Hochleitner2019a) that the occupation of the surface-coordinated cation sites and the interlayer sites are correlated, so that locally there are regions (microdomains) of one or the other of the following two configurations:
 $$\lsqb {A1{\lpar {{\rm H}_2{\rm O}} \rpar }_6} \rsqb \lsqb {{\lpar {As2} \rpar }_2\lpar {As3} \rpar M1{\lpar {M2} \rpar }_2{\lpar {T{\rm O}_4} \rpar }_2{\lpar {{\rm O}\comma \;{\rm OH}} \rpar }_7} \rsqb $$
 $$\lsqb {A1^{\prime}{\lpar {{\rm H}_2{\rm O}} \rpar }_6} \rsqb \lsqb {{\lpar {B2} \rpar }_2\lpar {As3} \rpar M1{\lpar {M2} \rpar }_2{\lpar {T{\rm O}_4} \rpar }_2{\lpar {{\rm O}\comma \;{\rm OH}} \rpar }_7} \rsqb $$
In walentaite, the site occupancies are consistent with 80% of configuration 1 and 20% of configuration 2. In the other three minerals there are approximately equal proportions of the two configurations, giving (B 0.5(As2)0.5)2 for the close-positioned sites B/As2.
The walentaite group
The general structural formula for walentaite-group minerals is:
[((A1yA1’1–y), A2)(H2O)n][B x(As2)2–x(As3)M1(M2)2(TO4)2(O,OH)7], where n = 4 for alcantarillaite and n = 6 for the other three minerals. The cation substitutions at the different sites for the walentaite-group minerals are given in Table 7, with the dominant cation listed first. Walentaite and natrowalentaite each have P5+ dominant at the T site whereas halilsarpite and alcantarillaite have dominant As5+ at the T site. On this basis the walentaite group is subdivided into walentaite and halilsarpite subgroups based on the dominant cation at the T site being P5+ or As5+, respectively.
Minerals of the walentaite group, site constituents.

A general chemical formula for the four minerals is [A(H2O)n][BxC3–x]M3(TO4)2(O,OH)7], where A, C and M include the atoms at A1 + A1’+A2, As2 + As3 and M1 + M2 sites respectively. The ideal formulae for the minerals are:
 $$\eqalign{& \hskip-3pt{\rm walentaite}\colon\; \lsqb {\rm Mn}\lpar {{\rm H}_2{\rm O}} \rpar _6\rsqb \lsqb \squ{\rm A}{\rm s}^{3 + }_3 {\rm F}{\rm e}^{3 + }_3 \lpar {{\rm P}{\rm O}_4} \rpar _2{\rm O}_7\rsqb \cr & \hskip-3pt \scale 95% { \hskip-0.1pc{\rm natrowalentaite}\colon\; \lsqb {{\rm F}{\rm e}_{0.5}{\rm N}{\rm a}_{0.5}{\lpar {{\rm H}_2{\rm O}} \rpar }_6} \rsqb \lsqb {{\rm NaA}{\rm s}^{3 + }_2 \lpar {{\rm F}{\rm e}^{3 + }_{2.33} {\rm W}^{6 + }_{0.67} } \rpar {\lpar {{\rm P}{\rm O}_4} \rpar }_2{\rm O}_7} \rsqb} \cr &\hskip-3pt {\rm halilsarpite}\colon \;\lsqb {\rm Mg}\lpar {{\rm H}_2{\rm O}} \rpar _6\rsqb \lsqb {\rm CaA}{\rm s}^{3 + }_2 \lpar {\rm F}{\rm e}^{3 + }_{2.67} {\rm M}{\rm o}^{6 + }_{0.33} \rpar \lpar {{\rm As}{\rm O}_4} \rpar _2{\rm O}_7\rsqb \cr &\hskip-3pt {\rm alcantarillaite}\colon\; \lsqb {\rm F}{\rm e}^{3 + }_{0.5} \squ_{0.5}\lpar {{\rm H}_2{\rm O}} \rpar _4\rsqb \lsqb {{\rm CaA}{\rm s}^{3 + }_2 \lpar {{\rm F}{\rm e}^{3 + }_{2.5} {\rm W}^{6 + }_{0.5} } \rpar {\lpar {{\rm As}{\rm O}_4} \rpar }_2{\rm O}_7} \rsqb } $$
Only for walentaite does the ideal formula correspond to an end-member formula as recommended by the IMA-CNMNC guidelines (Bosi et al., Reference Bosi, Hatert, Halenius, Pasero, Miyawaki and Mills2019). As discussed in the previous section, walentaite has a dominant (80%) configuration 1 component and the end-member formula is based on this component. For the other three minerals there are approximately equal contributions of the two configurations and giving one or the other as an end-member formula would provide information incompatible with the crystal structure. They correspond to mid-member compositions.
Further elucidation of the local-ordered structures of these minerals requires refinements for crystals with higher diffracting quality to get greater precision for the parameters of the atoms in partially occupied, split sites. Finding more abundant occurrences of the sparsely distributed minerals would help by having large-enough quantities for neutron diffraction to better-characterise the anions. Pair-distribution function analysis would also be helpful in distinguishing between different local configurations.
Supplementary material
To view supplementary material for this article, please visit https://doi.org/10.1180/mgm.2020.18
Acknowledgments
We thank Fernando Cámara, Peter Leverett and an anonymous reviewer for their very helpful comments. This research was undertaken in part using the MX2 beamline at the Australian Synchrotron, part of ANSTO, and made use of the Australian Cancer Research Foundation (ACRF) detector.