Implications
High feed prices, low pig prices and high manure processing costs drive margins down for pig producers. As differences between sires could contribute to farm profitability, careful selection of terminal sires is essential. This study shows that the current estimated breeding values (EBVs) for Piétrain sires in Flanders, obtained in test station conditions, remain valid in commercial conditions where different dam breeds are used.
Introduction
While dam genetics is usually fixed at farm level, sire choice is more flexible, especially when applying artificial insemination (AI) with semen provided by AI-stations. Careful selection of the sire may be a simple and efficient way to improve production results, which is particularly important when profit margins are under pressure. Estimated breeding values are commonly used to support decision making. Sires of the Flemish pig book are evaluated by raising 18 to 21 crossbred offspring in test stations under standardized conditions such as a fixed dam breed (Large White × Landrace), standardized (high energy and amino acid level) diets and uniform management practices designed to allow the pigs to reach their full genetic potential. Estimated breeding values for daily gain (DG), daily feed intake (DFI) and carcass quality (CQ) are obtained applying an animal model (Henderson, Reference Henderson1973) on live weight gain on test (20 to 115 kg), average feed intake on test and CQ at slaughter. Carcass quality is expressed on a scale from 0 to 200 which reflects both conformation and lean meat percentage of the carcass. Estimated breeding values are also combined in a total index by multiplying the EBVs with the corresponding economic weight. Various studies have shown that growth performance, carcass and/or meat quality in pigs can be influenced by diet (Wood et al., Reference Wood, Nute, Richardson, Whittington, Southwood, Plastow, Mansbridge, da Costa and Chang2004; Millet and Aluwe, Reference Millet and Aluwe2014; Zhou et al., Reference Zhou, Beltranena and Zijlstra2016), housing strategy (Gonyou and Stricklin, Reference Gonyou and Stricklin1998; Street and Gonyou, Reference Street and Gonyou2008; Brandt et al., Reference Brandt, Werner, Baulain, Brade and Weissmann2009), or dam breed (Bereskin et al., Reference Bereskin, Davey and Peters1976; McLaren et al., Reference McLaren, Buchanan and Johnson1987a; Oliver et al., Reference Oliver, Gou, Gispert, Diestre, Arnau, Noguera and Blasco1994). As a consequence, farmers question whether EBVs obtained on test stations remain representative for commercial farms (Merks, Reference Merks1989; Knap and Su, Reference Knap and Su2008; Wallenbeck et al., Reference Wallenbeck, Rydhmer and Lundeheim2009) and specifically if the EBVs obtained with progeny from one dam breed are valid for other dam breeds as well. Sire breed×dam breed interactions have been reported among Yorkshire, Spotted, Landrace and Duroc breeds (Hutchens et al., Reference Hutchens, Hintz and Johnson1982; McLaren et al., Reference McLaren, Buchanan and Johnson1987a and Reference McLaren, Buchanan and Johnson1987b) and among Minnesota no 1, Piétrain and Yorkshire breeds (McKay et al., Reference McKay, Rempel, Cornelius and Allen1984a and Reference McKay, Rempel, Cornelius and Allen1984b), but no study has explored whether such interactions are observed within a breed, in this case a set of Piétrain sires. In Flanders, the Belgian Piétrain is the predominant terminal sire for production of growing-finishing pigs because of its low feed conversion ratio (FCR) and extreme leanness (Lean et al., Reference Lean, Curran, Duckworth and Holmes1972; Labroue et al., Reference Labroue, Guéblez, Meunier-Salaün and Sellier1999; Department Agriculture and Fisheries, 2016). Although some commercial companies claim that the performance of a particular Piétrain sire depends on the dam breed, this has not been scientifically validated. Therefore, the aim of this study was to assess to what extent the sire, the dam breed and the interaction between both affects the translation of breeding values to practice.
Material and methods
Animals and management
This study compared performances of offspring resulting from crossings of five different Piétrain sires (breeding values computed and published online by the Flemish pig book in 2014) in two dam breeds (i.e. DanBred and Topigs 20, referred to as breed A and breed B). The experiment was blocked in two rounds. In the first round, 25 sows per dam breed were selected and inseminated twice with semen of one of the five selected sires (five dams per sire × dam breed combination). In the second round, the same dams were allocated at random for insemination by the sires while ensuring that for all dams, the sire used in the second round was different from the sire used in the first round. Eight dams were replaced in the second round due to fertility problems or lameness.
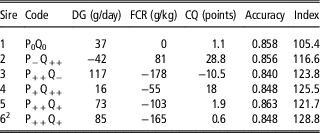
Piétrain sires were selected amongst the available AI sires based on their EBV for DG, FCR and CQ, with a minimal total index of 100 (Table 1). Sire 1 had an average EBV for DG, FCR and CQ. Sire 2 was characterized by a good breeding value for CQ, but a poor breeding value for DG and FCR. Sire 3 was selected for a good breeding value for DG and FCR, but a poor breeding value for CQ, whereas sire 4 was chosen based on a good breeding value for CQ and a moderate breeding value for DG and FCR. Finally, sire 5 was selected for a good breeding value for DG and FCR, and a moderate breeding value for CQ. As this boar was no longer available at the start of the second round, sire 5 was replaced by sire 6, having a comparable EBV. All Piétrain sires used in this study were homozygous stress positive for the halothane locus, whereas both dam breeds were homozygous stress negative. As a result, all progeny were heterozygous for the halothane locus.
Estimated pig breeding values for daily gain (DG), feed conversion ratio (FCR) and carcass quality (CQ) of the selected Piétrain siresFootnote 1 and the corresponding code for growth performance (P, based on DG and FCR) and carcass quality (Q), varying from poor (−), average (0), moderate (+) to good (++)

1 Breeding values computed and published online by the Flemish pig book in 2014.
2 In the second round, sire 5 was replaced by sire 6.
All pigs were born on a commercial pig farm (Agro De Gaai, Deerlijk, Belgium). Since the farm was switching dam breed from A to B, breed A had a lower parity compared to breed B. At the age of 9 weeks, six littermates (three gilts and three barrows of average BW) of three dams per sire × dam breed combination were transferred to the pig experimental facility at Flanders Research Institute for Agriculture, Fisheries and Food (ILVO) (Melle, Belgium) for the growing-finishing phase. This resulted in a total of 354 experimental animals: 180 piglets in round 1 and 174 piglets in round 2 as only two matings of sire 1 in dam breed A were successful. At ILVO, finishing pigs were housed with six full sibs per pen. Finishing pigs were fed ad libitum with a three phase feeding strategy: growing (20 to 40 kg), early finishing (40 to 70 kg) and late finishing (70 to 110 kg) (Supplementary Tables S1 and S2).
Growth performance
All pigs were weighed individually and feed consumption per pen was recorded weekly to determine average DFI, average DG and FCR per feeding phase, and for the total growing-finishing period. Average daily lean meat gain (DLMG) was calculated as (lean meat at slaughter – lean meat at the beginning of the growing-finishing phase) / (number of days between the beginning of the growing-finishing phase and slaughter). The amount of consumed lysine per kilogram lean gain was calculated as total consumed digestible lysine / (lean meat at slaughter – lean meat at the beginning of the growing-finishing phase). Lean meat at slaughter was defined as lean meat percentage × cold carcass weight. Lean meat at the beginning of the growing-finishing phase was assumed to be 45% BW (Susenbeth and Keitel, Reference Susenbeth and Keitel1988). To better understand the observed growth performance results, serum urea and creatinine levels, two parameters of muscle metabolism, were determined additionally.
Carcass quality
At an average live weight of 110 kg, all pigs in the pen were slaughtered in a commercial slaughterhouse by exsanguination after carbon dioxide stunning. As 12 pigs were euthanized or removed due to illness or lameness, 342 pigs remained in the experiment. Animals were fasted 16 h before slaughter. Muscle and fat thickness were measured using the AutoFOM III (Carometec A/S, Smørum, Denmark) and values were converted into lean meat percentage by the equation approved by the regulation 2012/416/EU. Dressing percentage was calculated as cold carcass weight, recorded in the slaughterhouse, divided by the BW recorded immediately before transport to the slaughterhouse and multiplied by 100.
Meat quality
Meat quality parameters were assessed in the first round (n=175). At 45 min postmortem, pH (pH45) was measured in the musculus longissimus thoracis et lumborum (LM) (around the 13th rib of the right carcass side) using a Knick Portamess, Type 911 pH with a Xerolyt puncture-type electrode (Mettler Toledo, Columbus, OH, USA) and a Testo 230 with a NTC-sensor (Testo, Ternat, Belgium). One-day postmortem, a piece of the LM of the right side of the carcass (30 cm around the 13th rib) was sampled at the slaughterhouse. Samples were trimmed for intermuscular and subcutaneous fat and sliced (2.5 cm thickness).
On one slice, the ultimate pH (pHu) was measured 24 h postmortem using a Knick Portamess, Type 911 pH with a Xerolyt puncture-type electrode. A second slice was used to assess drip loss, based on the method described by Honikel (Reference Honikel1987). The weight of the slice (approximately 150 g) was measured, and the slice was then placed in a plastic bag and suspended for 48 h at 4°C using a nylon cord. After 48 h, the slice was weighed again after wiping the sample dry, and the proportionate weight loss was calculated. Color was determined on a third slice in duplicate after 15 min blooming time with a reflection spectrophotometer (HunterLab Miniscan, Reston, VA, USA), giving the color coordinates L (lightness), a (redness) and b (yellowness). Average values were used for further statistical analysis.
Before the other analyses (intramuscular fat (IMF) content and shear force), slices were vacuum packed and stored at −18°C. The amount of IMF was calculated based on the total amount of lipids (slice with all intermuscular and subcutaneous fat removed) as determined using the modified Bligh and Dyer method (Bligh and Dyer, Reference Bligh and Dyer1959). Tenderness was evaluated by shear force determination. A slice was heated in a plastic bag at 75°C for 60 min in a hot water bath and cooled in a bath of cold tap water. Cooking loss was recorded as weight loss during cooking of this slice. The cooked slice rested for 24 h at 4°C. Shear force of the cooked samples was determined with a triangular Warner–Bratzler shear force measurement device (Boccard et al., Reference Boccard, Buchter, Casteels, Cosentino, Dransfield, Hood, Joseph, MacDougall, Rhodes, Schön, Tinbergen and Touraille1981). Ten cylindrical samples (diameter 1.27 cm) were taken parallel to the fiber direction and were sheared, during which the shear force was recorded. The lowest and highest values of each sample were excluded to determine the average shear force.
Metabolic parameters
Blood samples were collected from 166 pigs in the second round, the day after the average weight in the pen reached at least 105 kg. Blood samples were taken via venipuncture of the jugular vein and were collected in a 10 ml serum tube with a silicone-coated interior (Terumo Europe, Leuven, Belgium). Serum was obtained by centrifugation at 1499 rpm for 10 min at 4°C and stored at −80°C until analysis. Urea and creatinine concentrations were determined by using the commercial Cobas Ureal kit and Cobas CreJ kit, respectively (both kits made by Roche, Basel, Switzerland). The limits of detection were 3.0 mg/dl for urea and 0.17 mg/dl for creatinine.
Statistical analysis
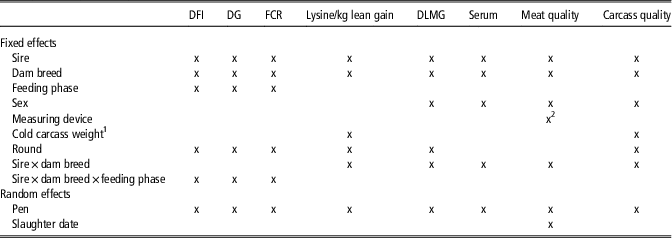
Statistical analysis was performed using R (R Core Team, 2017) with general linear mixed-effect models (nlme package). Performance parameters (DG, DFI and FCR) were analyzed using a longitudinal model. The pen was considered as the experimental unit. For individually assessed parameters (DLMG, serum concentrations, meat and CQ traits), pen was included as random factor to correct for repeated measures within the same pen. Round was included as fixed factor to model the differences between weaning rounds, except for serum concentrations and meat quality parameters as these parameters were only measured in one round. All fixed and random effects that were included in the initial models to analyze the different parameters, are shown in Table 2. For final models, interaction terms with P-values above 0.1 were excluded. Differences in main effects were considered significant if P<0.05 based on the Type III Anova table (car package). A Tukey’s posthoc test was used to compare treatment means (lsmeans package).
Initial models used in the analysis of pig daily feed intake (DFI), daily gain (DG), feed conversion ratio (FCR), lysine/kg lean gain, daily lean meat gain (DLMG), serum, meat and carcass quality

For final models, interaction terms with P-values above 0.1 were excluded.
1 Continuous variable.
2 For pH only.
A posthoc power calculation with 10 000 simulations was performed (simr package), based on the observed values in this study. Assuming a difference of 75 g in DG, 0.3 in FCR and 3% in lean meat percentage, a power of 71%, 85% and 88% for the effect of sire×dam breed was calculated, respectively.
Correlation coefficients (Pearson correlation) were calculated between IMF and lean meat percentage, fat thickness and muscle thickness, in both barrows and gilts. Results were considered significant if P<0.05.
Results
Performance
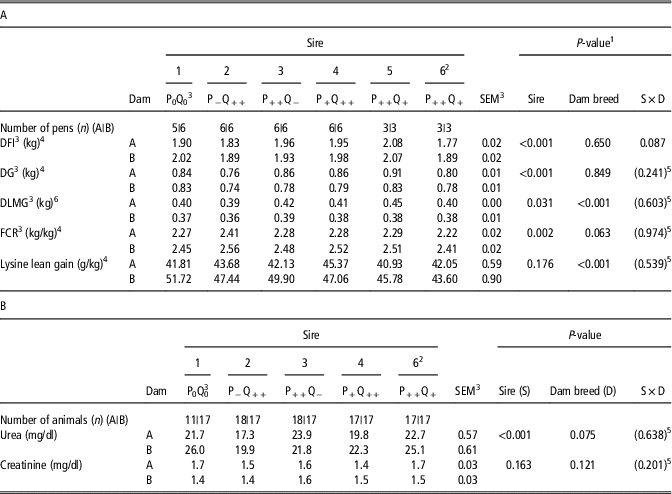
For average DFI, sire and dam breed tended to interact when considering the trajectory 20 to 110 kg (P=0.087) (Table 3, Supplementary Tables S3, S4 and S5). Offspring of sire 3, sire 4 and sire 5 in dam breed A ate more compared to offspring of sire 2, whereas no differences between sires were observed for dam breed B. Overall, sire significantly affected DG: sire 5 offspring grew faster than offspring of sire 2 (P<0.001). There was no effect of dam breed on DG. Average DLMG was significantly affected by the sire (P=0.031), yet no differences between individual sires could be determined with Tukey’s posthoc tests. Dam breed also had a significant effect (P<0.001), with offspring of breed A having a higher DLMG compared to offspring of breed B. Feed conversion ratio tended to be affected by dam breed (lower for breed A in phase 2 and phase 3) (P=0.063), and was significantly reduced in sire 1 and sire 5 pigs compared to sire 2 pigs (P=0.002), independent of dam breed. The amount of kilogram lysine needed per kilogram lean gain was significantly higher for offspring of breed B compared to breed A (P<0.001), but did not differ significantly between offspring of different sires.
Effect of pig sire (S) and dam breed (D) on growth performance (20 to 110 kg) (A), and urea and creatinine levels (B) in their offspring (means)

1 Performance parameters (DFI, DG and FCR) were analyzed using a longitudinal model that included feeding phase as a fixed factor.
2 In the second round, sire 5 was replaced by sire 6.
3 P=growth performance; Q=carcass quality; −=poor; 0=average; += moderate; ++=good; DFI=daily feed intake,; DG=daily gain; FCR=feed conversion ratio; DLMG=daily lean meat gain, SEM=SEM of all sires within one dam breed.
4 Measured at pen level.
5 Interaction was not included in statistical model if P>0.1, P-values of the excluded interactions in initial models are shown in brackets.
6 Measured at animal level (n × 6).
Metabolic parameters
Serum urea concentrations were increased in offspring of sire 1, sire 3 and sire 6 compared to sire 2 (P<0.001, Table 3, Supplementary Tables S4 and S5), and tended to be affected by dam breed (higher for breed B) (P=0.075). Sire or dam breed did not affect serum creatinine levels.
Carcass quality
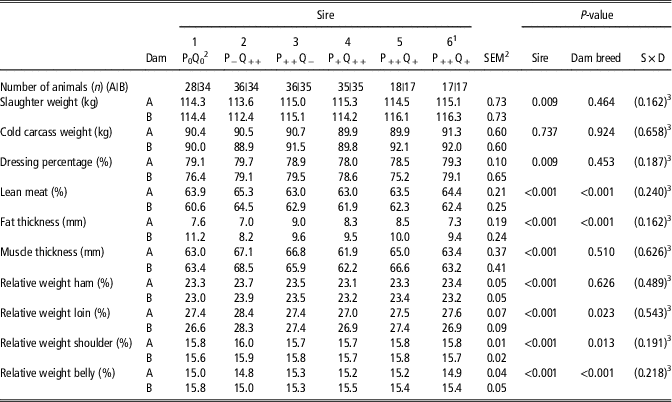
None of the CQ parameters was affected by a sire×dam breed interaction (Table 4, Supplementary Tables S4 and S5). Sire had a significant effect on all carcass traits. Sire 2 pigs had the highest dressing percentage compared to sire 4 pigs (P=0.009). In addition, offspring of sire 2 had the highest carcass leanness (P<0.001) due to having the highest muscle thickness (P<0.001) and the lowest fat thickness (P<0.001). The lowest lean meat percentage was observed with sire 1, sire 4, sire 5 and sire 6 (P<0.001), the lowest muscle thickness with sire 4 (P<0.001), and the highest fat thickness with sire 1 and sire 3 (P<0.001). The relative weight of the ham was highest with sire 2, intermediate with sire 3, and lowest with sire 1 and 4 (P<0.001). Compared to all other sires, sire 2 led to the highest relative weight of the loin (P<0.001) and shoulder (P<0.001). Sire 2 pigs also had the lowest relative weight of the belly compared to sire 1, sire 3 and sire 4 pigs (P<0.001).
Effect of pig sire (S) and dam breed (D) on carcass quality of their offspring (means)

1 In the second round, sire 5 was replaced by sire 6.
2 P=growth performance; Q=carcass quality; −=poor; 0=average;+= moderate; ++=good; SEM=SEM of all sires within one dam breed.
3 Interaction was not included in statistical model if P>0.1, P-values of the excluded interactions in initial models are shown in brackets.
Dam breed influenced multiple carcass parameters (Table 4, Supplementary Table S4). Compared to breed B, offspring of breed A showed a higher lean meat percentage (P<0.001), and a higher relative weight of the loin (P=0.023) and shoulder (P=0.013). In addition, a significantly lower fat thickness (P<0.001) and lower relative weight of the belly (P<0.001) was observed in offspring of breed A. Dressing percentage, muscle thickness and relative weight of the ham did not differ between dam breeds.
Meat quality
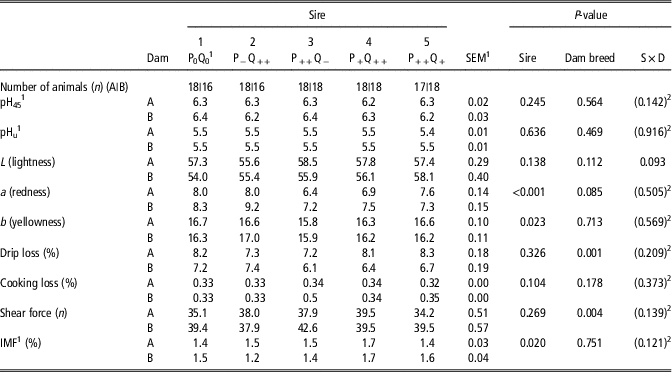
None of the meat quality parameters was affected by sire×dam breed interactions (Table 5, Supplementary Tables S4 and S5). Pork of sire 3 pigs was significantly less red than pork from offspring of sire 1 and sire 2 (P<0.001), and less yellow than offspring of sire 2 (P=0.023). Compared to sire 4 pigs, a significant lower IMF percentage was observed for sire 2 pigs (P=0.020). Intramuscular fat correlated negatively with lean meat percentage, with a correlation coefficient of r=−0.42 (P<0.001) and r=−0.48 (P<0.001) for barrows and gilts, respectively. Intramuscular fat correlated positively with fat thickness, with a correlation coefficient of r=0.40 (P<0.001) and r=0.42 (P<0.001), respectively. Intramuscular fat and muscle thickness did not correlate significantly. The pH measured at 45 min postmortem (pH45), pHu, drip loss and shear force did not vary among sires. Breed A dams tended to induce less red pork (P=0.085), and resulted in a significant higher drip loss (P=0.001) and lower shear force (P=0.004). In contrast, pH45, pHu, yellowness, cooking loss and IMF percentage were not affected by dam breed. For lightness of the meat, sire and dam breed tended to interact (P=0.093) (Table 5, Supplementary Tables S4 and S5). In dams of breed B, sire 1 induced significantly darker meat compared to sire 5, while no differences between individual sires were observed for dams of breed A.
Effect of pig sire (S) and dam breed (D) on meat quality of their offspring (means)

1 P=growth performance; Q=carcass quality; −=poor; 0=average; += moderate; ++=good; pH45=pH 45 min postmortem; pHu=ultimate pH; IMF=intramuscular fat; SEM=SEM of all sires within one dam breed.
2 Interaction was not included in statistical model if P>0.1, P-values of the excluded interactions in initial models are shown in brackets.
Discussion
Effect of dam breed
Dam breed affected diverse growth performance and carcass or meat quality parameters. Offspring of breed A tended to have a better FCR and had a significantly better lean meat percentage and lower fat thickness compared to breed B, while pork of breed A had lower shear force values, but also less water holding capacity. In line with our results, dam breed was shown to affect average DG, carcass and meat characteristics, further illustrating that dam breed effects in pigs extend beyond reproductive traits (Bereskin et al., Reference Bereskin, Davey and Peters1976; Oliver et al., Reference Oliver, Gou, Gispert, Diestre, Arnau, Noguera and Blasco1994) because of the 50% contribution of genes from the dam to the fattening pig.
Effect of sire
Sires were chosen based on their EBV for DG, FCR and CQ, based on offspring performance. According to these breeding values, sire 2 used in this study should theoretically perform worst in terms of DG and FCR and best for CQ. This was confirmed by our results: offspring of sire 2 had the lowest DG, the highest FCR, but the highest lean meat percentage. The higher FCR of sire 2 pigs can be explained by their reduced DFI, slower growth and reduced (but not significantly different) DLMG, resulting in higher maintenance requirements. As a result, a lower IMF content, a lower fat thickness and a higher muscle thickness was observed, leading overall to a higher lean meat percentage (Patience et al., Reference Patience, Rossoni-Serão and Gutiérrez2015). The lower serum urea levels indicate that nitrogen was used more efficiently, which seems logical given the high lean meat percentage (van Milgen and Dourmad, Reference van Milgen and Dourmad2015).
As expected, cold carcass weight did not differ among the selected sires. However, offspring of sire 2 were characterized by the highest relative weight of the ham, loin and shoulder, but the lowest relative weight of the belly. This agrees with the findings of Tanghe et al. (Reference Tanghe, Millet, Hellebuyck, Van Meensel, Buys, De Smet and Janssens2015) who showed that the relative weight of the ham, loin and shoulder is negatively correlated with the relative weight of the belly and positively correlated with each other. Moreover, lean meat percentage was reported to be positively correlated with the relative weight of the ham, loin and shoulder, but negatively correlated with the relative weight of the belly (Tanghe et al., Reference Tanghe, Millet, Hellebuyck, Van Meensel, Buys, De Smet and Janssens2015), which is in line with our observations.
In contrast to sire 2, sire 3 had the best EBV for DG and FCR, but the worst for CQ. Indeed, offspring of sire 3 had the highest fat thickness and the highest relative weight of the belly. This agrees with the negative correlation between lean meat percentage and relative weight of the belly as described by Tanghe et al. (Reference Tanghe, Millet, Hellebuyck, Van Meensel, Buys, De Smet and Janssens2015). The predicted effect on FCR and DG for sire 3 pigs was less clear. Other sires could as well show a less pronounced ranking than predicted, however, no big outliers were present and most sires performed as expected.
Interaction between sire and dam breed
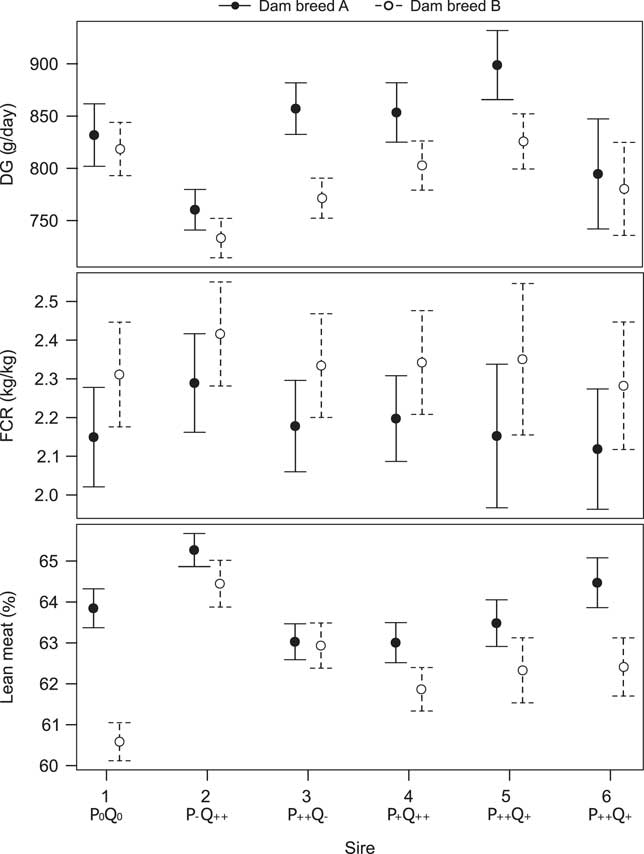
Trends to significant interactions between sire and dam breed were observed for average DFI between 20 and 110 kg, and pork lightness. However, in our experimental setup, no significant sire×dam breed interactions were reported. In general, offspring of all sires behaved similarly in dam breed A compared to breed B and EBVs remained valid over the two commercial dam breeds used in this study (Figure 1). Analogous with our results, high correlations between test station and on-farm performance for growth rate and/or back fat were reported (Van Diepen and Kennedy, Reference Van Diepen and Kennedy1989; Bidanel and Ducos, Reference Bidanel and Ducos1996). In addition, in a study comparing the performance of sires between conventional and organic production systems, no major shift of the ranking order was observed (Brandt et al., Reference Brandt, Werner, Baulain, Brade and Weissmann2009). These results further support that EBVs can be a useful and reliable tool across different environments.
Average daily gain (DG), feed conversion ratio (FCR) and lean meat percentage for the different pig sire by dam breed crossings. Sire codes for growth performance (P, based on DG and FCR) and carcass quality (Q), varying from poor (−), average (0), moderate (+) to good (++) are indicated. Bars represent SEM.

Because selection for leanness of Piétrain sires has resulted in reduced feed intake capacity (Lean et al., Reference Lean, Curran, Duckworth and Holmes1972; Labroue et al., Reference Labroue, Guéblez, Meunier-Salaün and Sellier1999), differences in growth performance and CQ traits of their offspring might be limited (but still economically important) and similar when crossed with different dam breeds. As the maximum deviation between the EBV for DG of the selected sires was about 150 g/day, a difference of 75 g/day in DG was chosen to be relevant, since the sire is only responsible for half of the additive genetic value of the piglets. Next, in the European SEUROP-classification system of meat quality, different classes (S to P) are given per decrease in lean meat percentage of 5% (S, E, U, R, O, P for respectively >60%, 55% to 60%, 50% to 55%, 45% to 50%, 40% to 45% and <40%). Therefore, a difference in lean meat percentage of 3% was selected as economically relevant. For FCR, the maximal deviation between the EBVs was about 260 g/kg, or 0.13 g/g explained by the sire. A difference of 0.1 in FCR was therefore considered as economical relevant. In our experiment setup with 354 experimental animals studied, an acceptable power could be reached for a difference of 75 g in DG, 3% in lean meat percentage, and 0.3 in FCR. No acceptable power for a difference of 0.1 in FCR could be calculated. Considering FCR, our experimental setup can be regarded as underpowered. An increased number of animals would have allowed a higher power for smaller, but still economical relevant differences. However, numerically there is no indication for an interaction between sire and dam breed: in both dam breeds, sire 2 scores worst and sire 6 scores best in terms of FCR.
For diverging breeds, sire breed×dam breed interactions have been reported. For instance, among Yorkshire, Spotted, Landrace and Duroc breeds, sire breed×dam breed interactions have been described for DG (McLaren et al., Reference McLaren, Buchanan and Johnson1987a), for weight of ham, loin and loin muscle area (McLaren et al., Reference McLaren, Buchanan and Johnson1987b), and for age and weight at puberty (Hutchens et al., Reference Hutchens, Hintz and Johnson1982). In addition, among Minnesota no 1, Piétrain and Yorkshire breeds, sire breed×dam breed interactions were observed for carcass length, loin eye area, biceps brachii, biceps femoris, ham and loin percentage, and for loin, shoulder, ham, boned ham, semitendinosus, semimembranosus, femur and humerus weight (McKay et al., Reference McKay, Rempel, Cornelius and Allen1984a). Further, sire breed×dam breed interactions have been reported for large intestine length and for kidney, heart, spleen and leaf fat weight (McKay et al., Reference McKay, Rempel, Cornelius and Allen1984b). While specific crossings between different breeds can be beneficial for certain traits, our study could not confirm that within a set of Piétrain sires, terminal boars would rank differently depending on the commercial dam breed.
In conclusion, the present study confirmed the existence of (large) differences in performance between offspring of different Piétrain sires and different dam breeds, which may have a major impact on farm profitability. However, the results obtained with our experimental setup indicate that the main effects of the sire and the dam breed seem to be of greater importance than their interaction. The current breeding value estimation of Piétrain sires thus remains representative among different dam breeds, further illustrating the importance of EBVs for more sustainable pig husbandry.
Acknowledgements
This research was funded by a grant of the Agency for Innovation by Science and Technology (IWT100871). The authors thank the technicians and animal caretakers of ILVO for their practical support and Miriam Levenson for English language editing.
Declaration of interest
The authors declare that there is no conflicts of interest.
Ethics statement
This study was approved by the Ethics Commission of Flanders Research Institute for Agriculture, Fisheries and Food (ILVO; EC-2015-249).
Software and data repository resources
None of the data were deposited in an official repository.
Supplementary material
To view supplementary material for this article, please visit https://doi.org/10.1017/S1751731119000429