


INTRODUCTION
The effectiveness of no-take reserves in protecting mobile marine species will vary inversely in relation to the scale of movement of the species in question and the size of the protected area (Attwood & Bennett Reference Attwood and Bennett1994; Kramer & Chapman Reference Kramer and Chapman1999; Claudet et al. Reference Claudet, Osenberg, Benedetti-Cecchi, Domenici, Garcia-Charton, Perez-Ruzafa and Planes2008) and species that undertake extensive migrations are unlikely to receive much protection from reserves unless critical locations where individuals aggregate are within reserves, such as spawning aggregation sites (Domeier & Colin Reference Domeier and Colin1997). Even within a single species, fish behaviours may include multiple modes of behaviour (Parsons et al. Reference Parsons, Babcock, Hankin, Willis, Aitken, O'Dor and Jackson2003), and there is a growing appreciation of the importance of within-species variation in movement in relation to reserve effectiveness.
In addition to migrations (seasonal and ongtogenetic), these behaviours may include genetically determined differences in individual boldness that affect susceptibility to fishing (Biro & Post Reference Biro and Post2008; Cooke et al. Reference Cooke, Suski, Ostrand, Wahl and Philipp2007), as well as multiple modes of habitat use, such as unimodal or bimodal activity centres (Egli & Babcock Reference Egli and Babcock2004; Parsons et al. Reference Parsons, Morrison and Slater2010). Both these sources of variation may play an important role influencing the ability of marine reserves to protect populations, suggesting that effectively incorporating behaviour into models of marine reserves may not be simple, since there is no single ‘average’ behaviour (Attwood & Bennett Reference Attwood and Bennett1994; Dingle Reference Dingle1996; Beentjes & Francis Reference Beentjes and Francis1999; Egli & Babcock Reference Egli and Babcock2004). Individual-based models (IBMs) may be a particularly useful tool for incorporating this variation and understanding its consequences (DeAngelis & Mooij Reference DeAngelis and Mooij2005), and IBMs have previously been applied to marine reserves in a limited number of cases (Attwood & Bennet Reference Attwood and Bennett1995).
Numerical simulation models of fish populations are regularly used to understand the general nature of the response of fished populations to protection from exploitation by marine reserves (for example Polacheck Reference Polacheck1990; DeMartini Reference DeMartini1993; Attwood & Bennett Reference Attwood and Bennett1995; Sladek-Nowlis & Roberts Reference Sladek Nowlis and Roberts1999; Parrish Reference Parrish1999; Gerber et al. Reference Gerber, Botsford, Hastings, Possingham, Gaines, Palumbi and Andelman2003; Moffitt et al. Reference Moffitt, Botsford, Kaplan and O'Farrell2009). Modelling approaches have the merit of enabling a range of scenarios to be examined in a very short period, for example in planning optimal size of no-take reserves. However, many such models are constructed with limited data relating to the movement of fish across reserve boundaries, which poses a significant risk to their utility as planning tools since such models are known to be sensitive to variation in movement (Polachek Reference Polacheck1990; DeMartini Reference DeMartini1993; Kramer & Chapman Reference Kramer and Chapman1999; Gerber et al. Reference Gerber, Kareiva and Bascompte2002). Some models of highly mobile fish populations have suggested that they may decline to near extinction, despite the existence of large protected areas (Hussein et al. Reference Hussein, Verdoit-Jarraya, Pastor, Ibrahim, Saragoni, Pelletier, Mahévas and Lenfant2011).
More recently, variation in the direction of cross-boundary movement within species has been included in models of marine reserve effects (Gerber et al. Reference Gerber, Heppell, Ballantyne and Sala2005), but little effort has been devoted to modelling the significance of within-population variation in movement behaviour, other than in an ontogenetic context (see Gerber et al. Reference Gerber, Heppell, Ballantyne and Sala2005), although studies in other systems show that such variation can lead to unexpected and important population level phenomena, such as unexpectedly high rates of variance in the spread of populations (Melbourne & Hastings Reference Melbourne and Hastings2009). There is growing empirical evidence from both laboratory and field studies that such variation exists and that it may have important implications for marine reserve effectiveness (White et al. Reference White, Botsford, Baskett, Barnett, Barr and Hastings2011).
In order to examine these questions in further detail, we focused on snapper (Pagrus auratus) in marine reserves in north-eastern New Zealand. Snapper are relatively well studied in this system and one of the most ecologically and commercially important marine fish in New Zealand, also occurring in many other parts of the Indo-Pacific from Japan to Western Australia. Most snapper in north-eastern New Zealand were assumed to follow a seasonal summer migration into shallow water (Cassie Reference Cassie1956; Crossland Reference Crossland1976). Evidence using both elastomer tagging and acoustic tracking indicates that this migration is followed by only some fish in the population, while others may be resident on reefs for up to several years (Willis et al. Reference Willis, Parsons and Babcock2001; Parsons et al. Reference Parsons, Babcock, Hankin, Willis, Aitken, O'Dor and Jackson2003, Reference Parsons, Morrison, McKenzie, Hartill, Bian and Francis2011). Further acoustic tagging work in and around the Leigh marine reserve has shown that, in addition to this highly site-attached behaviour, some snapper move more widely throughout the reserve while resident on reefs (Egli & Babcock Reference Egli and Babcock2004; Parsons et al. Reference Parsons, Morrison and Slater2010), making excursions on the scale of several kilometres. Some of these fish have been shown to leave the reserve and return to it after extended periods (Egli & Babcock Reference Egli and Babcock2004), with various degrees of temporary residency in the reserve.
One consequence of restricted movement patterns by part of the population is that the relative abundance of snapper inside coastal marine reserves is much higher than in adjacent fished areas (Willis et al. Reference Willis, Millar and Babcock2003). The observations that many fish are year-round residents and that there are seasonal fluctuations in coastal marine reserves (Willis et al. Reference Willis, Millar and Babcock2003) are more consistent with an alternative theory of polymorphic snapper behaviour, in which a proportion of P. auratus are year-round residents on reefs. Broader-scale mark-recapture studies in the same region also support the existence of multiple behavioural modes in snapper (Parsons et al. Reference Parsons, Morrison, McKenzie, Hartill, Bian and Francis2011). Similarly, in Shark Bay (Western Australia), two resident and genetically distinct stocks of P. auratus are found inside the larger harbour, whereas the oceanic stocks outside Shark Bay display clear seasonal migration (Moran et al. Reference Moran, Burton and Jenke2003).
The growing knowledge of snapper behaviour provides an opportunity to construct a realistic numerical simulation model of snapper populations and their response to protection from fishing. Because the model parameters are based on actual observations of the species, there is a reasonable probability that the behaviour of populations simulated in the model will bear a robust resemblance to natural populations in protected areas. Furthermore, because we have an extensive biannual data set that provides measures of population size structure and relative density of populations inside and outside several reserves (Egli & Babcock Reference Egli and Babcock2004), we have a means of validating the model. This crucial aspect of modelling is usually impeded by lack of empirical monitoring of the responses of populations to marine reserves (White et al. Reference White, Botsford, Baskett, Barnett, Barr and Hastings2011).
In this paper, we describe a stochastic spatially-explicit simulation model of the movement of individual snapper in populations centred on marine reserves. From this model, we estimated post-recruitment survivorship, mortality and lifetime fecundity of snapper. The model was restricted in geographical extent to the immediate vicinity of the Leigh and Tawharanui reserves, and did not include variable recruitment processes or broader stock dynamics. We analysed the behaviour of this model specifically to consider the extent to which snapper that recruit in a marine reserve were protected from the adjacent fishery. This is consistent with current New Zealand Department of Conservation management practices for marine reserves, where reserves are managed for biodiversity and conservation outcomes and not as part of a management strategy for optimizing stocks of fished species (Department of Conservation & Ministry of Fisheries 2005). In our calculations, we used individual movement data derived from acoustically tagged and tracked fish (Egli & Babcock Reference Egli and Babcock2004) to estimate activity-range size and variation in movement types. Seasonal survey data provided an independent estimate of the timing and magnitude of changes in population density on coastal reefs.
METHODS
To simulate snapper populations in existing and hypothetical marine reserves an individual-based modelling approach was used to assess yield-per-recruit (Attwood & Bennett Reference Attwood and Bennett1995). Populations of fish were seeded into cells within model domains that included a marine reserve and areas open to fishing, or into completely unfished domains, to allow estimates of an unfished population. Factors such as growth, fecundity and mortality parameters were based on accepted values from the literature. Because the model targeted particular areas where there were existing data for parameterization and validation, snapper were modelled as open populations in which the spawner-biomass that determined recruitment was a function of much larger processes that were beyond the scope of this investigation. The behaviour of each fish and the location of its centre of activity determined the proportion of time individuals spent in fished and protected zones and consequently their mortality rates. Different empirically-derived behaviours observed in snapper were included in the model in order to account for cross-boundary movements between fished and unfished areas. We assessed population parameters at the end of each 50-year model run.
Description of individual-based model
We based the domains used for the simulations on two sections of New Zealand's coastline that each contain a marine reserve, namely Leigh (32.83 km2) and Tawharanui (28.12 km2). The domains were divided into 100 × 100 m cells (0.01 km2). The sizes of the reserve areas within each of these domains were 4.9 km2 and 3.1 km2, respectively. We chose the overall size of the model domain to be proportional to reserve size, since varying the proportions of fished and unfished areas between the two areas would automatically result in differing proportional distributions of the population in the fished and unfished areas. We coded each cell to denote whether it represented land or sea, and indicate whether the cell was within the reserve (where no fishing occurred). The grid of cells was used to represent the use of space by individual snapper, and their susceptibility to the fishery on a probabilistic basis.
We randomly assigned snapper recruits (age 1+) to cells that represented sea. We arbitrarily set the total number of recruits sufficient to ensure that each cell received c. 50 recruits at the start of the period to be modelled, a number large enough to reduce random biases (noise) in the distribution of recruits across the grid without imposing unnecessary computational difficulties. We made no attempt to mirror habitat preference when distributing fish, primarily because habitat use has not been studied sufficiently to allow for its quantification. The longevity of each snapper was modelled stochastically based on its use of cells and the probability of it dying in each cell. We used a random number generator (RAN0) to decide if the fish survived the month according to the calculated mortality risk. If the fish survived the month, then its trial continued into the following month, and so forth for 50 years of simulation. The number of fish surviving each year (or age-group) was counted to yield an age-distribution.
We calculated the mortality rate during any month by summing across all cells, the product of the probability of the fish occupying that cell and the probability of it dying in that cell integrated across each time step (Attwood & Bennett Reference Attwood and Bennett1995). For those cells inside the reserve, we set the rate of mortality (Z) to equal the natural mortality rate M (Davies et al. Reference Davies, Gilbert and McKenzie1999). For those cells outside the reserve, we set the rate of mortality to equal the sum of the natural mortality rate and fishing mortality rate for fish resident on coastal reefs (F = 2; Willis & Millar Reference Willis and Millar2005). We derived the distribution of the probability of cell occupation and seasonal migration from telemetry and census data. Mortality of fish during the migrating phase was the same whether they originated in reserves or fished areas, and was set at M plus the overall fishing mortality rate for offshore areas (F = 0.1; Davies et al. Reference Davies, Gilbert and McKenzie1999).
Using telemetry data in the model
We based the simulated movements of snapper on those observed in an empirical study (Egli & Babcock Reference Egli and Babcock2004) that used acoustic telemetry data. All fish were caught inside Leigh marine reserve and released at the site of capture after surgery. No tracking was carried out at Tawharanui and we assumed that the general trends in size of activity centres were similar to those at Leigh. Details of the tagging and tracking procedures and the results of the tracking are available in Egli and Babcock (Reference Egli and Babcock2004). We estimated the probability of a fish occupying any particular cell within a month from telemetry data derived from fish tagged and tracked in the Leigh marine reserve using an array of seven receivers with a combined signal-receiving range of 5.4 km2 (Egli & Babcock Reference Egli and Babcock2004). From this array, we inferred the positions of fifteen fish ranging in size from 25–64 cm fork length by the weighted hourly sums of the recorded signals at each receiver position. We considered all these fish to be resident fish and present for long enough to allow activity-ranges and movement probabilities to be calculated. We summarized the data for each of these fifteen resident fish by month into a two-dimensional grid of probabilities, by calculating the proportion of time each fish spent in each 100 m × 100 m cell.
The activity-ranges for individual fish were never symmetrical in shape. The cell most frequently used (called the home-cell) was often offset from the centre of the range. It would therefore be incorrect, for the purpose of this model, to represent the activity-range size as a circular shape of the correct area. Such a procedure would underestimate the absolute distance that fish might travel in their activity-ranges, because fish had oblong-shaped activity-ranges. Because there did not appear to be any trend for fish to be found predominantly on the seaward or shoreward side of the home-cell, we assumed that the activity-range of a fish could elongate in any direction from the home-cell. We calculated the distance (d) between the centre of any cell (at address x, y) and the home-cell (centre of the activity-range at address xc, yc) trigonometrically. We then converted the two-dimensional grid of probabilities into one dimension by summing for all cells that were at distances away from the home-cell (Appendix 1, see supplementary material at Journals.cambridge.org/ENC). For groups of cells spaced equally from the home-cell, the probability of occupation decreased with increasing distance (d), while the cumulative probability of occupation increased asymptotically, to the point at which all recorded positions were encompassed. This yielded a series of multinomial probabilities across 231 increments, describing the likelihood of a fish occupying a position at a given distance from the home-cell.
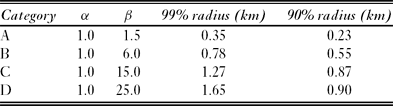
We used these curves to model the use of space by fish. In particular, we used them to define the values of d that encompassed 90% and 99% of the fishes’ movements within the period under investigation. We extracted one-week blocks of data for each month from the continuous telemetry records to estimate these limits for each fish-month combination. We defined four classes of curve (A–D) that encompassed the range of observed activity-range patterns, . For each category, we defined a two-parameter gamma function (Taylor Reference Taylor1980) that conformed to the shape of the observed curves in that category, by using the mid-class values for the 99% radii (Table 1). We randomly assigned recruits to one of these activity patterns in proportion to the frequency the patterns were observed in the tagged fish. The chance of assigning any particular activity-range did not differ between migrants and non-migrants, and the activity-range size did not vary during the year.
The parameters of the gamma functions used to define the multinomial distributions for each activity-range category.
We assumed each model fish had a circular probability-density distribution centred on the cell to which it was recruited to evaluate its risk of exposure to the fishery. The probability density distribution was larger than the original activity-ranges from which it was calculated, because it was radially symmetrical, but the proportion of time spent at any given distance from the home-cell was the same. It was important to conserve the distance component, rather than the actual size of the activity-range, when evaluating the risk of exposure to the fishery beyond reserve borders.
The proportion of time spent in the cell to which a model fish recruited (home-cell) was higher than in any other cell. We calculated the probability of that fish occupying other cells from the multinomial probability distribution. We divided such probabilities by either four or eight, depending on the number of cells in the radius-group used to calculate the probabilities for each individual cell; the vector of multinomial probabilities was thus converted back to a two-dimensional grid. In cases where some cells in a group overlapped land, we divided the multinomial probability among only sea cells. In this way, the model fish filled the available space without any distortion of the distances that it moved within the activity-range.
Migration
There appeared to be two distinct modes of behaviour that were independent of fish size. One group was present throughout the duration of the tracking while others were present in the array < 67% of the time. Such behaviour was predicted, because the number of snapper on inshore reefs varied seasonally due to partial off-reef migration (Willis et al. Reference Willis, Millar and Babcock2003; Egli & Babcock Reference Egli and Babcock2004). We calculated the ratio of migratory to resident fish using the proportion of the monitoring period during which individual fish were present in the receiver array (Egli & Babcock Reference Egli and Babcock2004). Therefore, the model made allowance for a proportion of fish (60%), deemed to be migrants, to leave the inshore reefs for the months April to September, and then to return between the months of October and January. During this period, the migrants (whether from reserves or fished areas) were at risk of capture by the offshore fishery. In the absence of information to the contrary, we assumed that migrants returned to the same home-cell each spring. In fact, many tracked fish that left the tracking array did subsequently return to it, usually to the same activity centre and sometimes after periods of up to several months (Egli & Babcock Reference Egli and Babcock2004).
We used bimonthly census data using baited underwater video taken at Leigh between April 2001 and December 2002 (Egli & Babcock Reference Egli and Babcock2004) as an independent means of quantifying the amplitude of seasonal movement of snapper off reefs. These data showed a pattern of lowest relative abundance (expressed as the maximum number of snapper (MaxN) present at one time during a 30 min video deployment; Willis et al. Reference Willis, Millar and Babcock2000) in October 2001 (MaxN = 7.08 ±1.6 SE) and a maximum in February 2002 (MaxN = 19.79 ±2.26 SE), implying a ratio of 64% migrants, remarkably similar to the proportion of tracked fish found to leave offshore reefs. We fitted a sine curve to the seasonal abundances, adjusted to lie between 0 and 1, with the maximum in spring and minimum in autumn, to simulate the probability of a migrant fish being present on the nearshore reefs.
Summarizing model results
The model assumes that snapper recruitment is constant over space and time. This is not the case in nature (see for example Kingett & Choat Reference Kingett and Choat1981; Francis Reference Francis1993), however, it is a simplifying assumption that is unlikely to be affected by marine reserve status. Densities of 0+ snapper are similar both inside and outside the Leigh Marine Reserve, with no significant trends detected across a range of habitat types (Ross Reference Ross2003). Because of the limited geographical scope of the model, the spawner-biomass that determined recruitment was a function of much larger processes that were beyond the scope of this investigation. The model therefore presents results on a per-recruit basis (i.e. an open population), in much the same way as yield per recruit and spawner-biomass per recruit models are used to analyse fishing strategies.
Because recruitment in the model did not vary over time, and because fishing and natural mortality were also constant over time, we could calculate the density of fish from the projection of a single cohort (Attwood & Bennett Reference Attwood and Bennett1995). If the number of fish recruiting to cell (i, j) is R (i, j), and the number of those surviving at age (t) years is S (i, j, t), then the density per recruit (D/R) for cell (i, j) is:
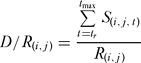
where tr is the age at recruitment, and tmax is the maximum age attainable by snapper. A variant of this indicator was summed over the interval tm :tmax to include only mature fish.
The density of fish in the reserve was simply the average of all D/R (i, j) values over those cells included in the reserve. Likewise, the density of fish in the exploited area was the average of all D/R (i, j) values over the exploited cells. One measure of the effectiveness of a marine reserve for preserving exploited populations is a simple comparison of fish density across a marine reserve boundary. The average D/R in the reserve was thus compared against the average D/R for the exploited area. Assuming uniform recruitment, that ratio can be compared to field measurements.
The ratio of density between the reserve and the adjacent exploited area provides a measure of relative protection, but not absolute protection effectiveness since both reserve and non-reserve fish are affected by fishing. For this reason, a comparison of density per recruit against the density per recruit in the hypothetical situation of no fishing anywhere was necessary. We used D/RK to describe the D/R in the complete absence of fishing. We calculated D/RK by summing the cohort strengths when only natural mortality applied, and then dividing that sum by the original recruitment strength. The mean D/R for all reserve cells was then expressed as a percentage of D/RK , yielding a value that could range from 0 (no protection) to 100% (maximum possible protection).
D/R values reflect only numbers of fish and carry no information about the structure of the stock locally. Egg production (EP) is a useful measure of protection, because it includes age-structure and provides a direct measure of the capacity of the fish to contribute to future recruitment. Again, this parameter is expressed as a per-recruit figure:
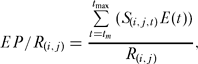
where tm is the age at 50% onset of maturity, and E(t) is the mass of eggs produced by a fish of age t. This latter function was constructed from an age-mass relationship and an egg-mass relationship (see later). Egg production per recruit was expressed as a percentage of the maximum possible egg production per recruit achieved in the total absence of fishing (F = 0).
We used the number of fish surviving at the end of each year since recruitment to construct an age-distribution for fish in the reserve, and another for fish in exploited areas. The numbers-at-age were log-transformed and then regressed against age to yield a slope (Pauly Reference Pauly1984). The value of the slope was taken as a measure of instantaneous mortality rate, with units y−1. We could also use these age distributions to produce an estimate of yield (numbers and biomass) to the local fishery, by subtracting data for fished and reserve populations from the projected population for an unfished population.
In summary, we measured the protective value of the reserve using four variables:
-
(1) Ratio of density per recruit inside the reserve to outside, (a) for all fish and (b) for mature fish only;
-
(2) Percentage of the maximum density per recruit inside the reserve (mature fish only);
-
(3) Percentage of the maximum egg-production per recruit inside the reserve;
-
(4) The mortality rate of fish recruiting into the reserve (calculated over the exploited ages only).
Parameter values
We derived estimates of critical ages and rates from published sources. We assumed a two-tier natural mortality rate (M) of 0.075 y−1 for fish < 20 years old and 0.05 y−1 for fish > 20 years old (the latter being at lower risk; Davies et al. Reference Davies, Gilbert and McKenzie1999). We assumed fishing mortality (F) was 2.0 y−1 on inshore reefs (Willis & Millar Reference Willis and Millar2005) and 0.1 y−1 in offshore areas (Davies et al. Reference Davies, Gilbert and McKenzie1999). Age at recruitment (tr ) was at one year (Francis Reference Francis1994), and time to first capture (tc ; Davies et al. Reference Davies, Gilbert and McKenzie1999) and time of 50% maturity in the population (tm ; Francis & Pankhurst Reference Francis and Pankhurst1988) were both at five years. Maximum age (tmax ) was set at fifty years (Gilbert & Sullivan Reference Gilbert and Sullivan1994).
With respect to fishing mortality, inshore reefs and offshore areas varied by an order of magnitude (Willis & Millar Reference Willis and Millar2005). We derived the growth functions used to estimate size, weight and fecundity from the literature (Appendix 2, see supplementary material at Journals.cambridge.org/ENC; Taylor & Willis Reference Taylor and Willis1998; Zeldis & Francis Reference Zeldis and Francis1998; Millar et al. Reference Millar, McArdle and Harley1999).
Reserve design alternatives
The existing reserves at Leigh and Tawharanui were used as test cases, but then each of these was also modified to provide smaller and larger alternatives (Fig. 1, Table 2). When adjusting reserve sizes, we enlarged the size of the total model domain proportionally to ensure that the reserve did not dominate the non-protected part of the domain. We tested various domain sizes to ensure that the results obtained were not an artefact of a domain size that was too small.
The Leigh and Tawharanui reserves (middle). The maps represent the configuration of cells in the model, with two alternative designs (smaller above and larger below) for existing reserve configurations. Lightly shaded areas are no-take reserves, dark shaded areas are land, including Motu Hawere (Goat Island) which is present in the centre of the Leigh Marine Reserve.

Reserve dimensions. For Leigh and Tawharanui reserves, the length and width refer to the maximum east-west dimension and the maximum north-south cross-section, respectively. H1–H7 = hypothetical rectangular reserves.

These alternatives provided a rather limited range of reserve sizes, and so we created a hypothetical rectangular design, to provide for a range of larger reserve sizes (Table 2). These reserves had three open boundaries (two short and one long) and one closed (representing the shore). For these simulations, the size of the total domain was at least twice that of the reserve area.
RESULTS
Activity-range size
Activity-range sizes varied considerably between individual snapper (Fig. 2). The acoustic tracking data were used to apportion individual fish into four categories of activity-range size: category A, 99% radius less than 500 m (31% of records); category B, 99% radius between 500 m and 1000 m (52%); category C, 99% radius between 1000 m and 1500 m (11%); and category D, 99% radius between 1500 m and 2000 m (6%). On average, the telemetry data showed that the 90% radius was about 60% of the 99% radius, and we thus selected the gamma functions to reflect this shape. The probability of a model fish occupying any particular cell group was calculated from these curves.
Activity-range data of individual fish selected as examples to show the four different patterns of space use. The two-dimensional matrix of probabilities of occupying cells on the grid were collapsed into one dimension by lumping together cells that were equidistant from the home-cell (cell group 1). The distance of each group from the home-cell can be gauged from the stippled lines, which show the position of four radii. Four different gamma functions (A–D, see Table 1) were used to represent the observed snapper activity-range sizes in the model.

Leigh and Tawharanui: existing reserves
On a per-recruit basis, our model predicted the density of snapper to be 1.9 times greater in both reserves than in adjacent fished areas (Table 3). When including only mature fish (≥ 5 y) in the comparisons, the ratios were substantially higher, being 16.4 at Leigh and 16.3 at Tawharanui. In both cases, however, the density per recruit of mature fish was only just in excess of 40% of the maximum possible density per recruit, namely the density per recruit of mature fish in the absence of a fishery. The potential effectiveness of these current reserves as a tool to restore snapper populations in reserves to a near-unexploited state was more apparent when age-structure was taken into account. The age structure of the snapper population in the Leigh reserve for example was predicted to be more similar to that of a fished population than an unfished one although the reserve population still had substantial numbers of individuals between ten and twenty years old, while very few were present in the fished population. (Fig. 3). Our calculations of egg-production capacity of modelled populations indicated the protected fish collectively produced only around one-third of the predicted maximum capacity of a totally unfished population (Table 3). When assessing mortality rates from age-structure, the protected fish had a total mortality (Z) value of c. 0.12 y−1 in both reserves. Under absolute protection, the Z value should lie between 0.05 y−1 and 0.075 y−1. The model thus indicates a substantial loss from the reserves to fishing on adjacent reefs and wintering grounds through migration.
Predicted measure of snapper protection expressed on a per-recruit basis for the two existing marine reserves (Leigh and Tawharanui), and for two alternative designs (small and large) for each reserve as comparison. D/R = density per recruit, EP/R = egg production per recruit, K = estimates for unfished population and Z = total mortality among reserve fish.

Comparative age-structures of fish population and catches produced by the individual-based model for the Leigh reserve, the adjacent exploited reefs and the no fishing (F = 0) scenario.

Leigh and Tawharanui: alternative designs
Predictably, reserve size had a positive influence on the measures of protection (per recruit), apart from the obvious effect of including more area and hence more fish. The alternative reserve sizes differed from the original by between 30% and 50%, but there was little change in any of the measures of protection (Table 3).
The hypothetical reserves showed that success of protection ‘per recruit’ increased asymptotically with reserve size (Fig. 4), although even the largest reserve did not achieve close to 100% protection. The loss to egg production through fishing mortality of migratory fish was in the region of 43%. This was a greater impact than for density because the relative importance of fish to overall egg production increased as they grew larger and older. The accumulated depletion of these fish through fishing therefore had a disproportionate effect. A good trade-off between reserve area and success appeared to be at around 40 km2 (H3, Table 4). A reserve area of this size produced half of the maximum possible egg-production per recruit, which was only slightly lower than that in a reserve nine times its size. Below 40 km2, egg-production per recruit diminished sharply (Fig. 4).
Measures of reserve success for the seven hypothetical rectangular reserves (dimensions as in Table 2). D/R = density per recruit, EP/R = egg production per recruit, K = estimates for unfished population and Z = total mortality among reserve fish.

(a) Comparison of the model predictions of reserve effectiveness across a range of reserve sizes. Two measures of effectiveness are used, namely the proportion of the maximum density per recruit (filled symbols), and the proportion of the maximum egg-production per recruit (open symbols). (b) Ratio of fish abundance in reserve versus non-reserve areas based on predicted density per recruit values. Ratio for all fish (filled symbols), ratio for mature fish (open symbols). Leigh is represented by triangles, Tawharanui by squares and hypothetical reserves H1–H7 by circles.

A predictable effect of reserve shape is that changing reserve width (offshore extent) had more effect than changing its length (longshore extent). For example, the increase in the measures of success from H4 to H5 was larger than the increase from H3 to H4, despite the equal jump in reserve area (Table 4).
Seasonal variation in density
The probabilities that were used in the model to time the departure and arrival of migratory fish were symmetrical around the month of March (month of maximum density on reefs). Fish density in the reserve was also reduced by fishing pressure on the reefs and offshore during the year. The combination of these processes resulted in an asymmetrical density distribution over the year (Fig. 5). The model used a migratory component of 60% in the population, but the maximum seasonal density variation on the reefs was calculated by the model at 76%.
Variation in density per recruit in the Leigh reserve over a 12-month cycle.

Sensitivity to key parameters
Variations in the fishing and natural components of mortality over their approximate ranges of uncertainty affected the model outcome in different ways (Table 5). An increase in the fishing mortality rate from F = 1 to F = 3 exacerbated the difference in the density per recruit between the reserve and the exploited area, increasing it more than fourfold, and at the same time reduced the density per recruit in the reserve. As a consequence of this the overall proportion of the modelled population relative to an unfished condition (D/R) / (D/RK ) declined from 0.49 to 0.38. Variations in natural mortality had the opposite effect on relative abundance between protected and fished areas. Low natural mortality rates exaggerated the impact of fishing mortality (reserve:fished). The sensitivity of the ratio of the density per recruit in the reserve compared with that for an unfished population was again low, and varied little throughout the range of mortalities examined, whether natural or due to fishing.
Sensitivity to varying sources of mortality. Predicted measures of snapper protection, expressed on a per-recruit basis (D/R = density per recruit, and K indicates density for unfished population) in Leigh marine reserve. Three values for fishing mortality rate in adjacent reefs were assessed (F = 1.0 y−1, 2.0 y−1 and 3.0 y−1), where F = 2.0 y−1 was the standard value used in simulations. Three values for the natural mortality rate in adjacent reefs were used (M = 0.075 y−1 for t < 20 y and M = 0.05 y−1 for t ≥ 20 y) corresponding to the standard values in our simulations, as well as M = 0.1 y−1 as a higher value in the range of the fishing mortality rates used in the model.

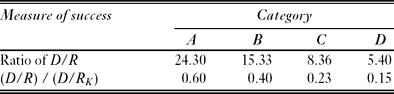
The uncertainty in the relative proportion of different movement patterns would appear to have a stronger bearing on the model result than did variations in mortality rates (Table 6). Differences in the density per recruit between reserve and the exploited areas varied fivefold across the range of different behaviour patterns, and the overall proportion of the modelled population relative to an unfished condition varied fourfold, in contrast to the low sensitivity of this measure in particular to variations in mortality (Table 5). The likelihood of fish changing their activity-range requirements during the year was not modelled explicitly, but the outcome of such seasonal variation should lie within the range of those we examined (Table 6).
Sensitivity to variation in movement patterns. Predicted measures of protection of snapper expressed on a per-recruit basis (D/R = density per recruit, and K indicates density for unfished population) in Leigh marine reserve, when all fish were modelled using a single activity-range category (as defined in Table 1).
DISCUSSION
Despite the apparently straightforward nature of the relationship between the size of marine reserves, scales of animal movements and reserve effectiveness, empirical studies of this relationship continue to pose a challenge. Analyses of empirical data have variously come to the conflicting conclusions that size does not matter (Halpern Reference Halpern2003), or that it does (Claudet et al. Reference Claudet, Osenberg, Benedetti-Cecchi, Domenici, Garcia-Charton, Perez-Ruzafa and Planes2008). More recently, meta-analyses of the same question (Lester et al. Reference Lester, Halpern, Grorud-Colvert, Lubchenco, Ruttenberg, Gaines, Airamé and Warner2009) concluded that there was no general relationship between the size of marine reserves and the magnitude of species’ responses within them, either in terms of their size or abundance, but raised a number of caveats. Four factors may influence the ability to detect broad trends in reserve size and effectiveness; few data from large reserves are available, there are few data from wide-ranging species, the level of fishing pressure outside reserves varies, and species or context specific factors exist (Lester et al. Reference Lester, Halpern, Grorud-Colvert, Lubchenco, Ruttenberg, Gaines, Airamé and Warner2009). Studies restricted to specific regions have tended to confirm that reserve size is an important factor, supporting the importance of context dependent factors (Edgar & Barrett Reference Edgar and Barrett1997; Claudet et al. Reference Claudet, Osenberg, Benedetti-Cecchi, Domenici, Garcia-Charton, Perez-Ruzafa and Planes2008).
The approach we have used has significant potential to improve understanding of marine reserve effectiveness, since it incorporates each of the remaining factors: namely reserve size, range of individual movement and variations in fishing pressure. Furthermore, the vast majority of the data employed in model parameterization were obtained from the local environment and validated against measured trends in the system, allowing questions regarding the effectiveness of these specific reserves to be addressed (White et al. Reference White, Botsford, Baskett, Barnett, Barr and Hastings2011). This is important because more general models, while they provide very useful insights, may suffer from the same shortcomings of lack of context specificity, which empirical studies have shown to have a major bearing on the reserve outcomes (Barrett et al. Reference Barrett, Edgar, Buxton and Haddon2007; Shears et al. Reference Shears, Babcock and Salomon2008).
The model we used has been shown to accurately reproduce relative differences between fished and unfished areas. This has been achieved through incorporating within-population individual variation in movement behaviour and size of activity centres, as we found the model was highly sensitive to these factors.
Model validation
The predicted ratios of legal-sized fish inside and outside the marine reserves at Leigh and Tawharanui were 16.5 and 16.3, values that correspond reasonably closely with observed values at those locations (16.0 [9.3 – 27.795% CI] and 8.8 [4.2 – 18.895% CI], respectively; see Willis et al. Reference Willis, Millar and Babcock2003). The relatively low ratio observed at Tawharanui may be the result of higher levels of poaching at Tawharanui, where enforcement of no-take regulations is more difficult than for Leigh (R.C. Babcock personal observations 1993–2002). Alternatively, there may also be site-specific differences in fish behaviour, which we were not able to measure at Tawharanui. For total snapper numbers, the predicted ratios were c. 1.9 for both locations, in contrast to observed ratios of 2.5 [1.8–3.395% CI] at Leigh and 2.1 [1.4–3.295% CI] at Tawharanui (Willis et al. Reference Willis, Millar and Babcock2003). Predicted values were thus within the margin of error of BUV estimates of legal snapper abundance at these sites, as well as total snapper abundance. Estimates of relative abundance of legal-sized snapper at Hahei, another marine reserve in north-eastern New Zealand, were very similar to the modelled values, at c. 16.5 (Willis et al. Reference Willis, Millar and Babcock2003). Consequently, our modelled snapper populations appear to be consistent with the actual dynamics of snapper populations in small reserves that include coastal reefs and their interactions with the fisheries in adjacent fished areas. In achieving this, the model used information on individual variations in activity ranges, as well as reproducing the seasonal dynamics of coastal snapper populations. Other models of protected and fished invertebrate populations have explicitly incorporated spatial configuration of reserves and species-specific movement patterns to produce models of population responses to reserves that appear to effectively approximate real-world situations (Acosta Reference Acosta2002).
The model was sensitive to variation in the proportions of fish that displayed restricted versus expanded activity-ranges, as well as the proportion of migratory fish. If all fish were resident with a restricted activity-range, then the Leigh reserve should be capable of maintaining a density per recruit of 60% of the maximum value, whereas the density in exploited areas would be 24 times less. Conversely, reserve effectiveness diminished abruptly when fish adopted any of the more expanded activity-ranges. Reality lies somewhere within this continuum (Egli & Babcock Reference Egli and Babcock2004; Parsons et al. Reference Parsons, Morrison and Slater2010), and can only be approximated by incorporating estimates of activity-range behaviour. Ideally, the approach used should take into account selective mortality (Parsons et al. Reference Parsons, Morrison and Slater2010), where wider ranging fish are removed from part of the population centred on a marine reserve more rapidly than those that are more sedentary. We adopted this approach in our model. The proportion of snapper with sedentary versus wide ranging behaviours appears to vary across different habitats, with higher mobility common among fish tagged at mid-shelf sites on open sandy bottoms (Parsons et al. Reference Parsons, Morrison, McKenzie, Hartill, Bian and Francis2011). This suggests that, in such habitats, larger reserves would be needed to achieve levels of protection equivalent to those currently seen in small coastal reserves with high proportions of reef habitat.
The possibility of activity-range relocation (for example see Parsons et al. Reference Parsons, Babcock, Hankin, Willis, Aitken, O'Dor and Jackson2003) could also produce a very wide range of relative abundance estimates (Table 6). To protect migratory fish effectively, reserves would either have to be much larger than Leigh and Tawharanui, or take the form of combined coastal and offshore reserves, specifically for this purpose. If migratory fish do not return to their original activity-range, as we assumed in this model, the importance of offshore reserves becomes even more evident, since coastal reserves will perform more poorly than the current model predicts.
Although the parameter values used in the model produced estimates that approximated empirical values reasonably closely, increased knowledge of snapper behaviour is desirable. Consequently, effort should be focused on increasing the degree of certainty regarding ratios of fish with different activity-range classes, better establishing how many of these undergo seasonal migrations, and fish destinations. It is also important to understand how these vary among habitats. This is consistent with the findings of both models (DeMartini Reference DeMartini1993; Acosta Reference Acosta2002) and empirical studies (Acosta Reference Acosta2002; Russ et al. Reference Russ, Alcala, Maypa, Calumpong and White2004). Our snapper model differs from these previous models in that a single population encompasses the range of behaviours previously explored as multiple independent single-species scenarios. It is unlikely that the dynamics of the spatial and temporal interactions of snapper populations within reserves would have been adequately captured by a model that did not include several behavioural modes, as variations in per-recruit estimates of snapper protection in reserves were more sensitive to assumptions about individual behaviour than they were to variations in sources of mortality (Tables 5, 6).
Marine reserve size
Despite the impressive observed and predicted snapper density differences across existing boundaries, model projections suggest that reserves of the size of Leigh and Tawharanui are not fully effective in protecting the snapper populations within them. Based on our modelling, the current unfished populations in the reserves at Leigh and Tawharanui marine reserves were estimated at just over 40% of unfished biomass (Table 3). Doubling the size of existing reserves would provide little improvement on this situation, and reserves approximately an order of magnitude larger than the existing marine reserves at Leigh and Tawharanui are probably required to approach the maximum potential level of protection. While 100% protection is only likely in sessile organisms, populations may more closely resemble their unfished state in very large reserves. Based on the model projections, asymptotic values of snapper relative abundance are approached at reserve sizes of c. 40 km2. There are presently no reserves on the coast of New Zealand's North or South Islands that come close to this size. While reserve width had a strong influence on predicted effectiveness this effect may be a spurious result of the model ignoring habitat preference. If inshore reefs are critical habitat then an additional offshore dimension is unlikely to be beneficial to the extent indicated, unless it includes habitats used in offshore winter migrations. However, the present movement data lacks the spatial extent and behavioural resolution to examine this phenomenon.
Large reserves are required to achieve relatively high levels of protection because there is a substantial migratory component and many fish cross the reserve boundaries and are caught. Even for the largest sized reserves we simulated, the density per recruit of fish in reserves was only 68% of that in the total absence of fishing. Reserves restricted to coastal locations cannot contain these migrations, which are thought to take place over distances > 10 km. Therefore, migratory fish lost to the fishery, which amount to a reduction of about 30% in density per recruit, are independent of reserve size for coastal reserves. This is likely to change significantly if reserves incorporated overwintering grounds in deeper water closer to the shelf edge or in relation to the proportion of migrating fish in a reserve population.
Even in very large reserves, the rate of capture of relatively mobile snapper crossing reserve boundaries is likely to be substantial, and they are likely to make a significant contribution to the fishery. The curve of relative abundance per recruit versus age for the Leigh Marine Reserve resembles that of an exploited population more closely than it does that of a totally unfished population (Fig. 3). Therefore, substantial numbers of fish whose activity-range core areas are based within the reserve are being caught in the fishery. The use of ultrasonic tracking has revealed cross-boundary movement of fish in other marine reserves, particularly if their activity-ranges are located near the reserve boundary (Zeller & Russ Reference Zeller and Russ1998) and/or reserve boundaries cross continuous habitats (Eristhee & Oxenford Reference Eristhee and Oxenford2001).
The models suggest that, for egg production within reserves, the importance of reserve size is even more pronounced due to changes in population structure as well as abundance. High relative levels of egg production in unfished populations (Fig. 3) are the result of large individual fish, which become increasingly scarce as fishing mortality increases (Gerber et al. Reference Gerber, Botsford, Hastings, Possingham, Gaines, Palumbi and Andelman2003). Reserves can make a substantial improvement to egg-production capacity and, if eggs and larvae are widely dispersed, then it may make sense to have a large reserve to improve spawner biomass at a regional level. Opposition from fishers may effectively prevent this, but, if increasing egg production of snapper were an objective, reserves > 100 km2 should be implemented.
While this paper has concentrated on the implications of fish movement and reserve size for conserving fish populations, models such as we have employed have the potential to provide further information. They could, for example, be used to estimate catch rates and size composition in a geographically correct model. Empirical studies have demonstrated increases in yield that could be attributed to the presence of marine reserves in some fisheries (see Roberts et al. Reference Roberts, Bohnsack, Gell, Hawkins and Goodridge2001; Russ et al. Reference Russ, Alcala, Maypa, Calumpong and White2004), but this finding is by no means universal (see Kelly et al. Reference Kelly, Scott and MacDiarmid2002). The majority of models also predict that reserves will increase local yield (biomass) of the fishery, but only under conditions of overfishing (see for example Dahlgren & Sobel Reference Dahlgren and Sobel2000; Sladek Nowlis Reference Sladek Nowlis2000; Gerber et al. Reference Gerber, Kareiva and Bascompte2002). A similar prediction could be deduced from our results (Fig. 3), but would need to be rigorously tested in a model that includes recruitment variability over time and fishing patterns around reserves, including effort displacement.
The measured ratios of snapper relative abundance between reserve and fished areas could only be reproduced by the model when high rates of mortality (F = 2) were assumed, corroborating Willis and Millar's (Reference Willis and Millar2005) conclusion that on coastal reefs snapper mortality is indeed high. Some uncertainty remains around estimates of fishing mortality on these reefs; for example Parsons et al. (Reference Parsons, Morrison, McKenzie, Hartill, Bian and Francis2011) estimated exploitation rates on reefs in the Leigh-Tawharanui region to be c. 10% over two years, based on conventional mark-recapture methods. This is approximately equivalent to a fishing mortality rate of F = 0.05, a far lower value than those which we used in our modelling. Natural mortality was estimated to be c. M = 0.045 in both our model and snapper stock assessments (Gilbert et al. Reference Gilbert, McKenzie, Davies and Field2000), and it is thus difficult to see how such large differences in relative density between reserves and fished areas could be measured, or modelled, if the differences between natural mortality and fishing mortality were as low as estimated by Parsons et al. (Reference Parsons, Morrison, McKenzie, Hartill, Bian and Francis2011). With a value of F of around 0.05, the difference in abundance of mature snapper between reserve and fished areas would be approximately fourfold, less than a quarter of those observed at Leigh and Tawharanui (Willis et al. Reference Willis, Millar and Babcock2003). This discrepancy may be explained by differences in the scale of movement observations and models used.
Given the low levels of movement shown in reef-resident snapper (Parsons et al. Reference Parsons, Babcock, Hankin, Willis, Aitken, O'Dor and Jackson2003; Egli & Babcock Reference Egli and Babcock2004), variations in behaviour and mortality are likely to occur, on the scale of hundreds of metres. Parsons et al. (Reference Parsons, Morrison, McKenzie, Hartill, Bian and Francis2011) conducted their study across scales of kilometres to tens of kilometres and used a long lining tagging method, less focused on reefs; this potentially explains their differing results.
CONCLUSION
While the details of the Leigh and Tawharanui model may be habitat specific, the general modelling approach could be implemented at larger spatial scales or in different habitats, in conjunction with appropriate movement and mortality parameters. Such approaches should be used to understand the effects of reserves on fisheries and processes such as spillover, as well as the implications of reserves for fisheries management where spatial management approaches are employed. Models explicitly incorporating individual behaviour may also help illuminate why marine reserves respond in differing ways to protection from fishing, and thus improve the use of protected areas as conservation tools. Finally, if reserves are to be used as a fisheries independent means of estimating fisheries impacts (Babcock & MacCall Reference Babcock and MacCall2011), a combination of modelling tools and empirical studies may be vital, enabling decisions based not only on data, but also on an understanding of the processes that underpinning these results (White et al. Reference White, Botsford, Baskett, Barnett, Barr and Hastings2011).
ACKNOWLEDGEMENTS
We thank Bruce Hartill and NIWA for the generous loan of acoustic receivers. Trevor Willis and Darren Parsons helped set the stage for the tracking work used to set the parameters of this model. Mat Vanderklift made constructive comments on the manuscript, and the constructive and detailed comments of four anonymous reviewers were extremely valuable. This study was made possible by funding from the Department of Conservation, contract NRO/07.



