Public health emergencies (PHEs) including pandemic diseases, natural disasters, and human-made catastrophes have caused considerable mortality and economic and social destructions.Reference Burkle and Frederick1,Reference Lei, Li and Xiao2 The term “public health emergency preparedness” (PHEP) had been used earlier, but the clear definition of it was first developed in 2007, which referred to the capability of the public health systems to prevent, protect against, quickly respond to, and recover from PHEs.Reference Nelson, Lurie and Wasserman3 The advance PHEP plays important roles in mitigating the adverse impacts of catastrophes,Reference Liang, Guan and Wu4 and strengthening PHEP is a primary task of PHEs management and also an essential element for effective response and recovery.Reference Moore5,Reference Levac, Toal-Sullivan and O’Sullivan6 Components of PHEP systems range from governmental agencies, the health-care delivery system, homeland security, communities, employers and business, academia, the media, to individuals.Reference Savoia, Massin-Short and Rodday7
Since the 9/11 and anthrax attacks in 2001, the United States (US) had accelerated efforts for preparedness for bioterrorismReference Barker8,Reference Dias, Reyes-Gonzalez and Veloso9 ; spurred by consequent severe acute respiratory syndrome (SARS) and Hurricane Katrina, the focus of PHEP was expanded to all hazards.Reference Katz, Attal-Juncqua and Fischer10 The outbreak of pandemic influenza A (H1N1) triggered the world’s attention to influenza,Reference Kunin, Engelhard and Thomas11 the “Whole-of-Society” approach was proposed by the World Health Organization (WHO) in 2009, and 38 documents were released by other international organizations to propel influenza preparedness for member countries.Reference Liang, Guan and Wu4 In 2013, the European Union (EU) adopted Decision 1082 to strengthen PHE planning and response to protect populations from a wide range of threats.Reference Stoto, Nelson and Savoia12 Over the past decades, frequent PHEs had stressed the increasing importance on PHEP, along with policies and funding aimed at improving PHEH, significant progresses in both practice and academia have been achieved in many countries.Reference Wang, Wei and Xiang13-Reference Murthy, Molinari and LeBlanc17
Bibliometrics analysis is used to quantitatively and qualitatively assess the historical evolutions and trends of publications in a certain field,Reference Ellegaard and Wallin18 which can also be used to evaluate scientific performance of individual authors or institutionsReference Abramo and D’Angelo19 and discover the main topics and frontiers.Reference Agarwal, Durairajanayagam and Tatagari20 Global scholars have published a substantial number of papers on PHEP,Reference Ramsbottom, O’Brien and Ciotti21-Reference Westcott, Ronan and Bambrick23 and previous reviews had characterized the knowledge growth and gaps in this field.Reference Savoia, Massin-Short and Rodday7,Reference Ramsbottom, O’Brien and Ciotti21,Reference Khan, Fazli and Henry24-Reference Cohen, Feder-Bubis and Bar-Dayan27 However, to the best of our knowledge, no bibliometric analysis of PHEP is available to date. Therefore, in this study, a bibliometric analysis on PHEP was performed to access the output trend, the contributions of certain countries, institutions, authors, journals, and identify research hotspots in this field. Findings of this study could provide an overview of global research patterns on PHEP.
METHODS
Data Source and Search Strategy
Data involving PHEP documents were retrieved from the Web of Science Core Collection (WoSCC) of Thomson Reuters on March 10, 2020. Because the first document was published in 1997, the timespan was set from 1997 to 2019. The search strategy was as follows: TS = (public NEAR health AND emergenc * AND preparedness) AND Languages: (English) AND document type: (Article OR Review).
For document screening, 2 authors independently reviewed the title and abstract of each searched document to include the documents as following: (1) preparedness for all kinds of emergencies, based on the definition provided by the WHO28 and Emergency Events Database (EM-DAT) of the International Disasters Database29; (2) original articles or reviews focused on PHEP, either empirical or nonempirical, such as survey, framework, policy analysis, or literature review. The exclusion criteria were the following: (1) documents about personal health protection, but not relevant to public health; (2) documents focused on medical emergencies, such as obstetric emergencies; (3) biological or medical studies not related to preparedness, such as etiology and immunology studies. In case of a lack of consensus, the third author resolved the disagreement. All data were downloaded in plain text format for further analysis.
Data Analysis and Visualization
Five types of analyses were conducted using Microsoft Excel and VOSviewer1.6.8 software to generate following indicators: (1) publication statistics to assess research activity; (2) co-authorship analysis to explore collaboration among countries, institutes and authors; (3) citation analysis to evaluate publication impact; (4) co-citation analysis to identify the knowledge foundationReference González-Alcaide, Calafat and Becoña30; (5) co-occurrence analysis of author keywords to explore hotspots. The publication output for each country or institution was based on the affiliation of all authors participating in a certain document, thus, overlaps would exist. Publication’s impact was evaluated by the value of citations per document, along with an impact factor of Journal Citation Report 2018 (Clarivate analytics, US).
The networks visualization was mapped by VOSviewer1.6.8.Reference Van Eck and Waltman31 In the networks, nodes represent countries, institutions, authors, journals, or keywords; links between the nodes represent the relationships of collaboration, co-citation, or co-occurrence. The nodes’ size represents the number of documents; the links’ thickness along with the distance between any 2 nodes represents the relationship strength; different colors represent different clusters or time periods.
RESULTS
Annual Trend of Publications and Citations
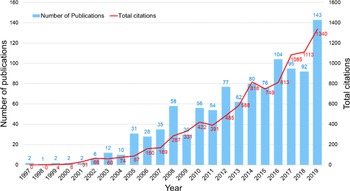
A total of 1168 documents were searched according to the search strategy; after screening, a total of 1058 documents were included. Figure 1 shows a growth trend of annal publications and total citations between 1997 and 2019. The publication output increased since 2002, with the biggest production of 143 (13.52%) documents in 2019, and 55.77% documents were published after 2013. The included documents received 9256 total citations, with an average of 8.75 citations per document and H-index of 37, which means 37 documents had been cited at least 37 times.Reference Hirsch32
Annual Trend of Publications and Total Citations on PHEP (1997–2019).

Country Distribution
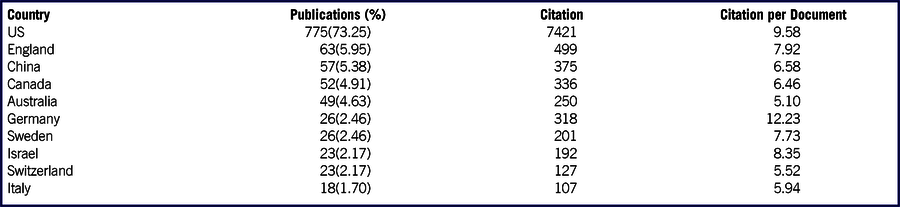
Authors from 92 countries contributed to the documents, with an average of 11.5 publications per country. The top 10 active countries were shown in Table 1. Authors from the United States participated in the most publications (775; 73.25%); followed by those from England and Canada. However, Germany had the highest citations per document of 12.23, followed by the United States (9.58) and Israel (8.35).
Top 10 Active Countries

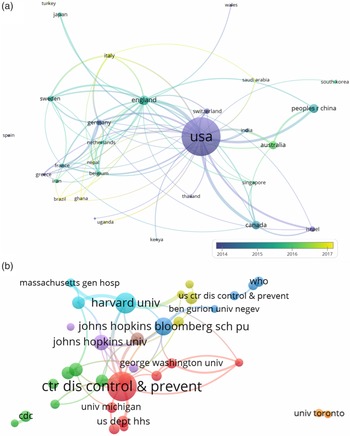
Figure 2A shows 30 countries had contributed at least 5 publications. The United States had the most collaborations with other 29 countries, and the strongest collaboration was between the United States and England (link strength = 20). What’s more, Saudi Arabia, Italy, Brazil, Ghana, Uganda, and Nepal were the recently active countries.
Collaboration Networks of Countries (A, n = 30) and Institutions (B, n = 35).

Institution Distribution
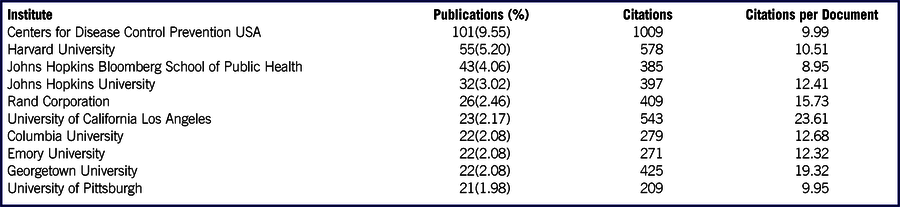
A total of 1587 institutions contributed to the documents, with an average of 1.5 institutions per document. The top 10 active institutions are shown in Table 2, all these institutions are from the United States. The US Centers for Disease Control Prevention (CDC) ranked the first, with 101 (9.55%) publications, followed by the Harvard University and Johns Hopkins Bloomberg School of Public Health. However, University of California Los Angeles and Georgetown University owned the highest value of citations per document of 23.61 and 19.32, respectively. Figure 2B shows 35 institutions had contributed at least 10 publications, the US CDC collaborated with the most institutions (23).
Top 10 Active Institutions

Authorship Distribution
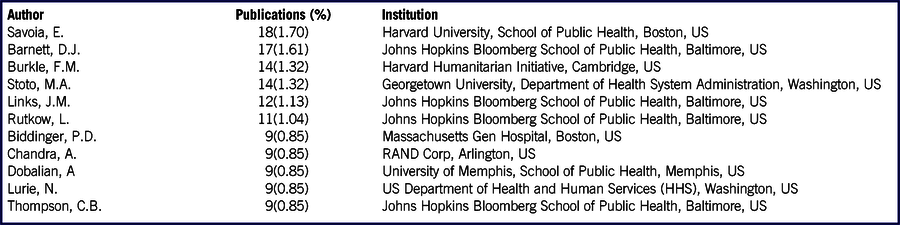
A total of 4605 authors participating in the documents; every document has 4.35 authors on average. Table 3 shows 11 active authors with at least 8 publications. The most productive author was E. Savoia, with 18 (1.70%) publications, followed by D.J. Barnett and F.M. Burkle.
Top 11 Active Authors

Top Cited Documents
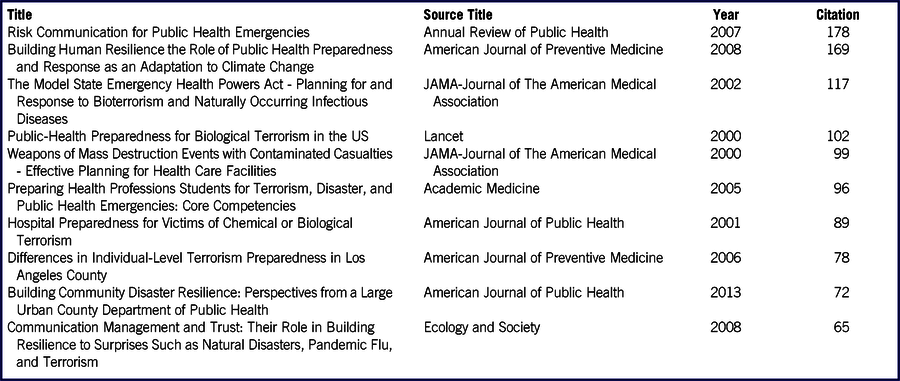
Table 4 shows the top 10 cited documents, in aspects of emergencies, (bio)terrorism, infectious diseases, natural disasters, climate change, and weapons contamination were covered. In aspects of emergency management, communication, resilience building, and education were contained; in terms of practitioners, professionals, hospital, individual, and community were included.
Top 10 Cited Documents

Top Active Journals
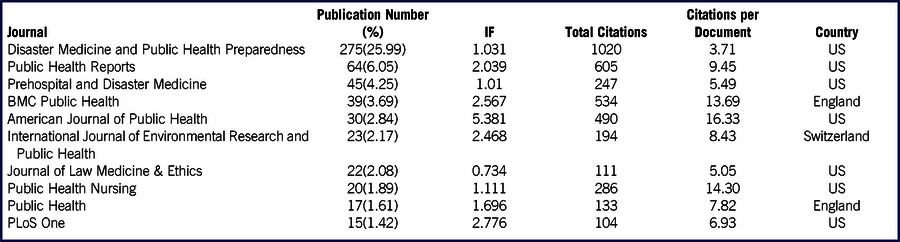
The 1058 documents were published on 243 journals, the top 10 active journals contributed 559 (52.84%) documents (Table 5). Disaster Medicine and Public Health Preparedness published the most documents (275; 25.99%), followed by Public Health Reports and Prehospital and Disaster Medicine. In terms of publication impact, the IF values ranked from 0.734 to 5.381, with the average IF value of 2.08. The journal had the highest citations per document was American Journal of Preventive Medicine (46.11), followed by Academic Medicine (36) and Health Affairs (24.86), the latter 2 journals were not in the Table 5.
Top 10 Active Journals

Co-citation Analysis
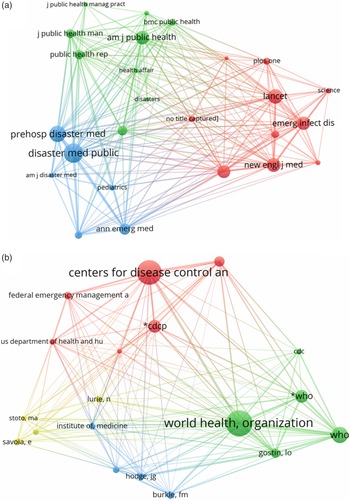
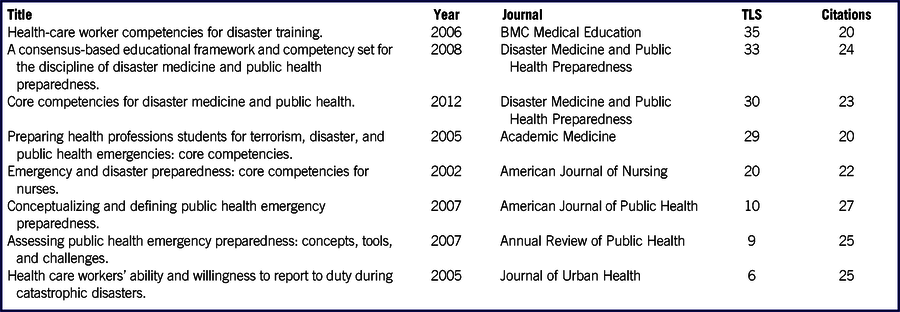
Disaster Medicine and Public Health Preparedness was the most co-cited journal, with the TLS of 10246 and citations of 672, followed by Public Health Reports and Lancet (Figure 3A). The top 2 co-cited journals coincided with the top active journals. In aspect of authors, institutions as authors were included, the WHO was the most co-cited, followed by the US CDC and HHS (Figure 3B). Table 6 lists the documents which were co-cited over 20 times, these documents covered the professionals’ compacities, basic concepts, methodology, and education framework in this field.
Co-citation Networks of Journals (A, n = 33) and Authors (B, n = 19).

Top 8 Co-cited Documents

Author Keywords Burst
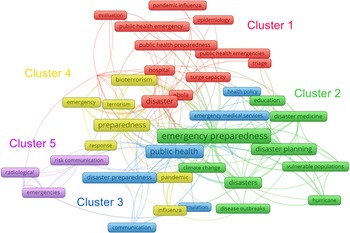
A total of 1854 author keywords were found. The terms “emergency preparedness,” “public health,” and “preparedness” were the most central keywords. Forty-six author keywords with minimum occurrences of 10 were shown in Figure 4, terms were classified into 5 clusters shown as different colors. Cluster 1 was epidemics-related, including “pandemic influenza,” “epidemiology,” and “Ebola”; Cluster 2 was disaster-related, including “disaster planning,” “hurricane,” and “vulnerable populations”; Cluster 3 was policy-related, including “emergency medical services,” “health policy,” and “communication”; Cluster 4 was terrorism-related, including “terrorism” and “bioterrorism”; Cluster 5 showed no obvious classification, including “radiological” and “risk communication”. Terms “disaster medicine,” “vulnerable populations,” “Ebola,” and “hurricane” appeared after 2016, reflecting the latest hotspots.
Co-occurrence Network of Author Keywords (n = 46).

DISCUSSION
There has been an obvious increasing trend of publication output and citations since 2002 (Figure 1), reflecting rising research activity in PHEP. The included documents received 9256 citations in total and the H-index of 37, the output and impact of PHEP publications was lower compared with researches on PHEs.Reference Barker8,Reference Yi, Yang and Sheng33-Reference Hao, Liu and Li36 Although understanding of PHEs serves the purpose of further preparedness, moreover, citations could not completely measure the practical impacts of these PHEP researches, the findings suggested the deficiency of attention on PHEP research to some extent.
Ninety-two countries contributed to the publications. Saudi Arabia, Italy, Brazil, Ghana, Uganda, and Nepal started to increase the publications recently, indicating these countries had started to put more attention on the PHEP researches and knowledge sharing, after experiencing several epidemics in recent years.37 It is notable that 73.25% of the output and all the active institutions and authors came from the United States (Tables 1-4). What’s more, the most co-cited institutions were the WHO and the US CDC and HHS. Since the 9/11 and anthrax attacks in 2001, the United States had led the world in the exploration of PHEP policies and had invested large funds, which could partly explain its leading position in this field.Reference Dias, Reyes-Gonzalez and Veloso9,Reference Katz, Attal-Juncqua and Fischer10,Reference Murthy, Molinari and LeBlanc17 Whereas, publication output from other countries was far less than the United States.
Developing countries, where medical care systems are already weak, will be in a potential vicious circle confronting complex emergencies.28,Reference Aliyu38 China, the United States, the Philippines, Indonesia, and India are the 5 countries most hit by natural disastersReference Guha-Sapir, Hoyois and Wallemacq39; African countries are buffeted by frequent and widespread threats.Reference Aliyu38-Reference Talisuna, Okiro and Yahaya41
Disappointingly, vulnerable countries/regions, including China, Bangladesh, Congo, Guinea, India, Indonesia, Kenya, Kiribati, Liberia, Nepal, Nigeria, Pakistan, the Philippines, Saudi Arabia, South Africa, Uganda, Yemen, together contributed only 120 (11.34%) publications. Figure 2 shows that the international collaboration level was limited, compared with others.Reference Hauser-Davis, Lopes and Mota42,Reference Gao, Shi and Ma43 In this case, there is a call for improving PHEP researches and international collaboration for most countries, especially developing countries under various threats.Reference Zhou, Zhang and Zhang35,37,Reference Mutters, Malek and Agnandji44 Countries that lack experts in this field should cultivate more professionals and develop related education as well.Reference Sweileh45 In addition to the lack of attention and underdevelopment of economy, medical, and professional education, another potential reason for the deficiency of publications might be the language barriers for some non-English speaking countries.
Co-citation is defined as the frequency with which pairs of documents, authors, or journals are cited jointly, which is used to identify the main intellectual foundation and evolution of a discipline.Reference González-Alcaide, Calafat and Becoña30,Reference Small46 The top 5 co-cited documents were focused on delineating competencies required for health-care workers, and proposing training and education frameworksReference Hsu, Thomas and Bass47-Reference Gebbie and Qureshi52 (Table 6). The sixth and seventh co-cited documents provided the concepts, measurement, and methodology of PHEPReference Nelson, Lurie and Wasserman3,Reference Nelson, Lurie and Wasserman53 ; the eighth co-cited document was a survey about health-care workers’ ability and willingness to report to duty during different disasters.Reference Qureshi, Gershon and Sherman54 The findings illustrated the professionals’ capacity building, education, and conceptions constructed the core knowledge foundation of PHEP in the past decade, which is similar with previous studies.Reference Savoia, Massin-Short and Rodday7,Reference Khan, Fazli and Henry24
Co-occurrences of key words are based on the frequencies of any 2 key words occur together, frequently co-occurrence key words give a general idea of research hotspots.Reference Dhital and Rupakheti55 Combined the results of author keywords burst and the top cited documents (Figure 4; Table 4), epidemics, natural disasters and (bio)terrorism, in other words, PHEP for all hazards were discussed. Besides education, communication was the ever-lasting hot topic. The most cited document published in 2007 was a review providing the definition, origins, and practical application of crisis risk communication.Reference Glik56 Communication plays a central role in PHEs management, incorporating a broad set of functions, including encouragement, informing, education, coordination, facilitating, and learning.Reference Seeger, Pechta and Price57 The recent hotspots “disaster medicine” and “hurricane” reflected the enhanced emphasis on hurricanes and other disasters, as a result of expensive lessons.Reference Guha-Sapir, Hoyois and Below58,59 “Vulnerable populations” include children, women, the elderly, and the poor are getting more attention, due to their nature and difficulty in obtaining resources in PHEs.Reference Dostal60
STRENGTHS AND LIMITATIONS
To the best of our knowledge, the current study is the first bibliometric study about PHEP. The documents involved have been screened manually so as to make sure the documents were appropriate to the theme. However, this study has a few limitations inherent in the bibliometric methodology. First, only 1 database was used, because data from more than 1 database cannot be combined and analyzed, which led to the omission of some documents. Second, due to the wide range of objectives covered by PHEP, it was unrealistic to enter all relevant search terms; the search strategy we used might result in some omissions. What needs to be explained is that, because the term “disaster” tends to refer to natural disaster in a narrow sense, which is included within PHEs, we did not search “disaster” separately, and the bibliometric researches on disaster medicine had been made previously.Reference Aliyu38,Reference Guha-Sapir, Hoyois and Wallemacq39,Reference Xu, Chen and Wang48 Third, we used the formal term “preparedness” for searching, but it was inevitable that some documents related to the theme used unformal topic words, such as “planning,” which might lead to some literature being wrongly excluded. Last, publication language was confined in English, which may miss some valuable documents.
CONCLUSIONS
This study provides a comprehensive overview of global research pattens on PHEP during the last 2 decades. First, significant progress had been made over the years; however, research activity and international collaboration still needs to improve for most countries. Second, professionals’ capacity building, education, and conceptions constructed the primary intellectual foundation of PHEP; epidemics, disasters, terrorism, education, and communication were the focuses; “vulnerable populations,” “disaster medicine,” and “hurricane” were the recent hotspots in this domain. Third, this study might encourage policy-makers to make meaningful changes for PHEP researches. Last, this study could assist researchers to choose an appropriate institution for collaboration or journals for publication.
Author Contributions
Tong Lin contributed with study design, data analysis, and wrote the article. Yuqin Qiu and Wenya Peng did the data acquisition and screening. Lisheng Peng provided critical revisions. All authors approved the final manuscript.
Conflict of Interest Statement
The authors declared no potential conflicts of interest with respect to the research, authorship, and/or publication of this study.