INTRODUCTION
Located in north-eastern Tunisia, the Gulf of Hammamet is a large gulf with a wide continental shelf whose bottom extends offshore in the north-east toward the Sicilian shelf. However, despite both the oceanographic and economic importance of this gulf, no study describing either the hydrographic properties or the distribution of phytoplankton and ciliates has been conducted in this area, with the exception of a few studies dealing with the geology of the Hammamet basin (Ben Romdhane et al., Reference Ben Romdhane, Brahim, Ouali and Mercier2002; Patriat et al., Reference Patriat, Ellouz, Dey, Gaulier and Ben Kilani2003). This pelagic distribution results from complex relationships with hydrodynamic and chemical variables, and from trophic interactions in the food web. Numerous studies have shown that ciliates constitute a highly diverse community capable of preying on various food resources including pico- and nanoplankton, thereby conveying organic matter to the classical grazing food chain (Premke & Arndt, Reference Premke and Arndt2000; Calbet & Saiz, Reference Calbet and Saiz2005). A significant coupling is therefore often observed between these small phytoplankton size fractions and both ciliates and heterotrophic flagellates, especially in oligotrophic systems, like the Mediterranean Sea (Herut et al., Reference Herut, Zohary, Krom, Fauzi, Mantoura, Pitta, Psarra, Rassoulzadegan, Tanaka and Thingstad2005; Kress et al., Reference Kress, Thingstad, Pitta, Psarra, Tanaka, Zohary, Groom, Herut, Mantoura, Polychronaki, Rassoulzadegan and Spyres2005; Decembrini et al., Reference Decembrini, Caroppo and Azzaro2009), or oligotrophic lakes (Aleya, Reference Aleya1991; Amblard et al., Reference Amblard, Bourdier, Sime-Ngando, Rachiq and Carrias1994) or newly flooded reservoirs (Patterson et al., Reference Patterson, West, Lawthom and Nickell1997; Jugnia et al., Reference Jugnia, Tadonléké, Simi-Ngando and Devaux2000). We therefore investigated the species composition, abundances and biomass of phytoplankton assemblages and ciliates along the offshore coast gradient and throughout the water column in the Gulf of Hammamet, and their relationships to physical and chemical factors. We hypothesized that phytoplankton species should exhibit interspecific differences in how they respond to both the environmental variability and potential planktonic predators such as ciliates. To test this hypothesis, samples were collected from 6 coast-to-offshore stations at 3 depths (surface, middle of water column and near bottom) for stations <100 m deep, and at 5 depths (surface, –10 m, –20 m, thermocline and near bottom) for stations >100 m deep. Such studies are well documented in the south-east of Tunisia (Hannachi et al., Reference Hannachi, Drira, Bel Hassen, Hamza, Ayadi, Bouain and Aleya2009; Drira et al., Reference Drira, Bel Hassen, Hamza, Rebai, Bouaïn, Ayadi and Aleya2010) but are very scarce in northern Tunisia. To our knowledge, this is the first study reporting preliminary results on phytoplankton and ciliates in relation to environmental variables in the Gulf of Hammamet.
MATERIALS AND METHODS
Study site
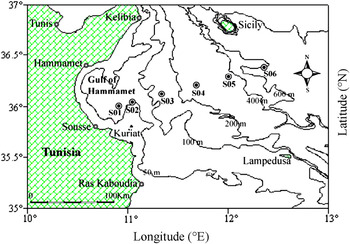
The Gulf of Hammamet is located in the east of the Tunisian Atlas Front and is part of the Tunisian eastern offshore (Figure 1). The Gulf of Hammamet is suspected to be influenced by the Atlantic current in the western Mediterranean (Poulain & Zambianchi, Reference Poulain and Zambianchi2007; Bel Hassen et al., Reference Bel Hassen, Drira, Hamza, Ayadi, Akrout, Messaoudi, Issaoui, Aleya and Bouain2009). The climate is humid (average precipitation: 750 mm years−1) and sunny with westerly Mistral winds with a frequency of 10%. It shelters 12 harbours and is the subject of increased anthropogenic interference (Ben Romdhane et al., Reference Ben Romdhane, Brahim, Ouali and Mercier2002). The study area (between 35°N and 37°N) extends from Kelibia to Ras Kaboudia.
Geographical map focusing on ciliate and phytoplankton sampling stations in the Gulf of Hammamet.

Sampling
This study was conducted on-board the RV ‘Hannibal’ between 28 and 31 July 2006, a period suspected to coincide with strong water stratification. To track, both the horizontal and vertical change in physico-chemical factors, and phytoplankton and ciliate abundance, samples (two replicates) were obtained from 6 stations at different depths depending on station location, along a longitudinal transect between the Tunisian coast and the Strait of Sicily (Figure 1). Temperature, salinity, dissolved oxygen and water density profiles were collected in each station with a conductivity–temperature–depth profiler (CTD: SBE 9, Sea-Bird Electronics, USA) equipped with a 12 l Niskin bottle rosette sampler lowered from the surface to the near bottom. For stations less than 100 m in depth, water samples were collected at three depths (surface, middle of water column which corresponds to 25 m, and near the bottom). For stations above 100 m in depth, samples were obtained from 5 depths (surface, –10 m, –20 m, thermocline and near the bottom). The stations are labelled herein as S01, S02, S03, S04, S05 and S06 and were located at 45, 31.5, 72, 103.5, 134.5 and 169 km respectively from the coast. A distance of about 114 km separates Station S06 from the Strait of Sicily.
Nutrients, phytoplankton and ciliate analysis
Samples for nutrients (nitrite: NO2−, nitrate: NO3−, ammonium: NH4+ and orthophosphate: PO43-) were stored at –20°C before analysis with a Bran and Luebbe type 3 analyser. For phytoplankton and ciliates enumeration, samples (1000 ml) fixed with a Lugol (4%) iodine solution (Bourrelly, Reference Bourrelly1985) were concentrated via sedimentation in 1000 ml graduated cylinders according to the method detailed in Dolan & Marassé (Reference Dolan and Marrasé1995) which was previously used in our investigation in the Gulf of Gabès (Hannachi et al., Reference Hannachi, Drira, Bel Hassen, Hamza, Ayadi, Bouain and Aleya2009). After settling for 4 to 8 days, the top 950 ml of the sample was slowly siphoned off with small bore (0.5 cm diameter) tubing. The concentrates (50 ml) were counted under an inverted microscope after settling for 24 to 48 hours using Utermöhl's method (Reference Utermöhl1958). Identification of algal taxa was made according to various keys (Tregouboff & Rose, Reference Tregouboff and Rose1957; Huber-Pestalozzi, Reference Huber-Pestalozzi1968; Dodge, Reference Dodge1985; Balech, Reference Balech1988; Tomas et al., Reference Tomas, Hasle, Syvertsen, Steidinger, Tanger, Throndsen, Heimdal and Tomas1996). Tintinnids were identified using lorica morphology and species description according to Kofoid & Campbell (Reference Kofoid and Campbell1929, Reference Kofoid and Campbell1939), Campbell (Reference Campbell1942) and Balech (Reference Balech1959). Naked ciliates were identified by consulting the works of Lynn & Small (Reference Lynn and Small1997), Petz (Reference Petz and Boltovsky1999), Alder (Reference Alder and Boltovsky1999) and Strüder-Kypke & Montagnes (Reference Strüder-Kypke and Montagnes2002). Biovolumes were calculated from length and width measurements on more than 100 individuals for the abundant taxa and on the few present individuals for rare taxa, assuming simple geometrical shapes and converted to carbon biomass (Lohmann, Reference Lohmann1908; Vadrucci et al., Reference Vadrucci, Cabrini and Basset2007). We used the conversion factor for phytoplankton proposed by Menden-Deuer & Lessard (Reference Menden-Deuer and Lessard2000), with 1 µm3 = 0.216 × 10⁻⁶ µg C l−1 for all phytoplankton taxa, and 1 µm3 = 0.288 × 10⁻⁶ µg C l−1 for diatoms. We used the conversion factor for the ciliate species proposed by Putt & Stoecker (Reference Putt and Stoecker1989): 1 pg C = 1 µm3 × 0.19.
The level of community structure was assessed with Shannon & Weaver's (Reference Shannon and Weaver1949) H′ diversity index.
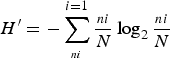
ni/N: is the frequency of species i in the sample N: number of species in the community We also calculated the evenness (J) proposed by Pielou (Reference Pielou1975); to prevent weighting of the H index by rare species, it is expressed as: J = H′/log2 S, where Hmax= log2S S: number of species in the community The phytoplankton dominance index D was calculated with the formula D = (n1 + n2)/N, which expresses the relative contribution of the two most abundant species (n1 + n2) to the total standing stock and N as the total cell abundance. The Simpson index was calculated with the formula 1–D = 1–Σ (Ni × N−1)2. Ni represents the frequency of species i in the sample and N is the number of species in the community.
Statistical analyses
Means and standard deviations (SDs) are reported when appropriate. The potential relationships between variables were tested by using Pearson's correlation coefficient. Canonical correspondence analysis (CCA) was applied to physical (temperature, salinity sigma-t and dissolved oxygen), chemical (NO3−, NO2−, NH4+, PO43- and Si(OH)4) and biological parameters (total phytoplankton, diatoms, dinoflagellates and total ciliates densities) assessed over 26 observations.
RESULTS
Physico-chemical parameters
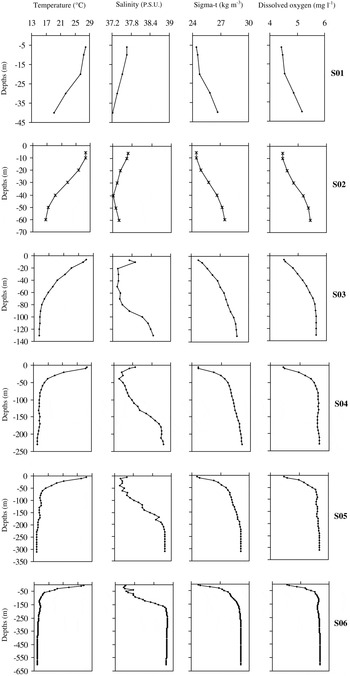
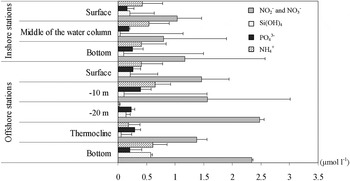
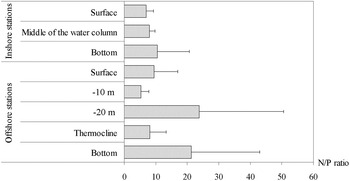
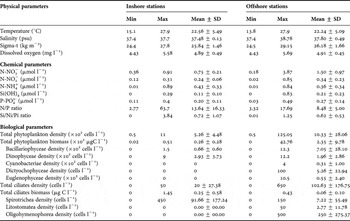
The physico-chemical variables recorded in the 6 stations are summarized in Table 2. The water temperature showed a general decrease from the surface to the bottom water (Figure 2). A clear thermocline was established at 30 m separating the cold bottom layer (13°C) from the warmer upper water mass (maximum of 27°C). The vertical salinity profiles showed a decreasing gradient toward the offshore. In both the coastal and open sea areas, sigma-t and temperature showed similar patterns. In the upper 100 m, sigma-t was inversely correlated to temperature (r = –0.98; N = 10; P < 0.05) (Figure 2) while in the deeper layers, sigma-t was positively correlated to salinity (r = 0.62; N = 2; P < 0.05). Average dissolved oxygen concentration did not show marked changes between depths and stations. Nitrate, nitrite and ammonia showed a similar profile, increasing from the inner to the outer shelf (Table 2). On the contrary, silicate and orthophosphate concentrations showed a significant decrease from the coastal to the open sea areas. Overall, the concentrations of all nutrients increased significantly from the surface to the bottom of the coastal area (Figure 3). However, no significant correlation was detected in the open sea between nutrient concentrations in surface and the bottom samples. The N/P ratio showed a gradual increase from the inner (8.48 ± 5.00) to the outer shelf (13.64 ± 16.13) (Table 2; Figure 4). The N/P ratio in the inner locations decreased from the surface (6.93 ± 2.31) to the bottom (10.51 ± 10.16), while in the offshore locations, the N/P ratio increased from the surface (9.45 ± 7.59) to the bottom (21.33 ± 21.74) (Figure 4). The Si/Ni/Pi showed a gradual increase from the inner (0.62 ± 0.53) to the outer shelf (0.72 ± 1.07) (Table 2).
Vertical distribution of water temperature, salinity, sigma-t and dissolved oxygen in the different sampling stations.

Vertical distribution (mean ± SD) of nutrient compounds (silicate, nitrite + nitrate, ammonium and orthophosphate) in the different sampling stations.

Vertical distribution (mean ± SD) of N/P ratio in the different sampling stations.

Phytoplankton standing stocks and horizontal and vertical variations
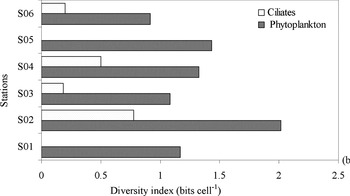
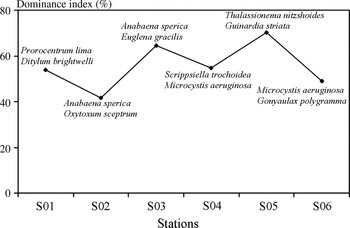
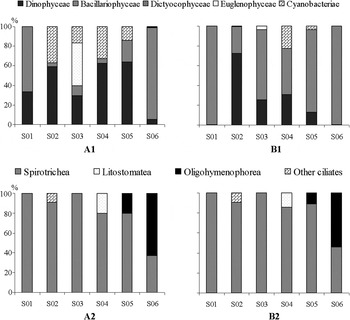
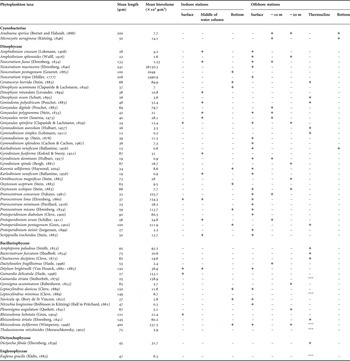
The phytoplankton community consisted of 58 taxa (Table 1) belonging to 32 genera and 5 groups: Euglenophyceae, Cyanobacteriae, Dictyochophyceae, Dinophyceae and Bacillariophyceae. The last two groups were the most diversified with 37 and 17 species respectively (Table 1). The genus Gymnodinium was dominant among dinoflagellates (5 species), followed by Protoperidinium, Gonyaulax, Prorocentrum and Neoceratium (4 species for each genus) (Table 2). In terms of vertical occurrence, the majority of dinoflagellates were found in the euphotic layer of both the inshore and the open sea areas (between 10 m and 30 m) while only 3 taxa (Neoceratium pentagonum, Dinophysis acuminata and Oxytoxum sceptrum) were found in the bottom samples of the inshore area (mean depth of 50 m). Three dinoflagellates (Gymnodinium simplex, Gymnodinium aureolum and Dinophysis ovum) were only recorded at the thermocline in the open sea stations (Table 1). Four known toxic dinoflagellates species (Karenia selliformis, Prorocentrum lima, Dinophysis acuminata and Gymnodinium veneficum) were found during this study. The two first species were recorded in both the neritic and open sea areas (300 cells l−1 and 150 cells l−1, respectively), while D. acuminata and G. veneficum were offshore species (50 cells l−1 and 300 cells l−1). Diatoms were represented by 17 taxa among which Guinardia delicatula and Rhizosolenia hebetata were exclusively detected in the coastal stations. Ten other species were exclusively identified in the open sea area and the remaining taxa were spread in both areas. The dominance of diatoms in Station 04 coincided with the highest silicate concentration (r = 0.92; N = 4; P < 0.05). In terms of vertical occurrence, Guinardia delicatula, Rhizosolenia hebetata and Nitzschia longissima were found at the surface, and Dactyliosolen fragillisimus, Ditylum brightwelli and Gyrosigma acuminatum between 10 m and 20 m, while no diatoms were recorded in the bottom samples of all the offshore stations. Seven diatoms (Amphiprora paludosa, Bacteriastrum furcatum, Chaetoceros decipiens, Guinardia striata, Leptocylindrus danicus, Rhizosolenia striata and Thalassionema nitzshioides) were found exclusively at the thermocline of the offshore area (Table 1). Dictyochophyceae (Dictyocha fibula) and Euglenophyceae (Euglena gracilis) were found only in offshore samples, while Cyanobacteriae (Anabaena spherica and Microcystis aeruginosa) developed in both the inshore and offshore stations (Table 1). Overall, the phytoplankton community was more diversified in the coastal area (mean H′ = 1.59 ± 1.14, mean J = 0.81 ± 024) than in the open sea (mean H′ = 1.18 ± 1.13, mean J = 0.86 ± 0.03) (Figure 5). However, the maximum (3.13 bits cell−1) was recorded at the surface of offshore Station 04 linked to the simultaneous presence of 11 dinoflagellate taxa (Amphidinium crassum, Amphidinium sphenoides, Gyrodinium dominans, Karenia selliformis, Karlodinium veneficum, Prorocentrum concavum, Gonyaulax polygramma, Oxytoxum sceptrum, Oxytoxum scolopax, cryptic Scrippsiella trochoidea and Neoceratium fusus) and 2 diatoms (Leptocylindrus danicus and Navicula sp.). The mean dominance index (D) was higher in open sea station 05 (mean D = 0.47 ± 0.08, mean S = 0.52 ± 0.08) (Figure 6), due to the simultaneous presence of T. nitzshioides and G. striata. The phytoplankton abundance ranged between 0.5 × 10² and 125.05 × 10² cells l−1 during this survey, increasing from the inshore (5.26 × 10² ± 4.48 × 10²) to the offshore (10.33 × 10² ± 28.06 × 10²) (Table 2), with the highest abundance recorded at the thermocline of offshore Station 06. The phytoplankton biomass ranged between 0.00 and 42.76 × 10² µg C l−1 with the highest biomass recorded at the thermocline of offshore Station 06. Phytoplankton biomass increased from the coastal area (26.17 ± 28.54) to the open sea (235.45 ± 978.72) (Table 2). Diatoms formed the numerically dominant component of the phytoplankton community in all sampled stations (61% of total abundance), followed by dinoflagellates (24%), Cyanobacteriae (10%), Euglenophyceae (4%) and Dictyochophyceae (1%). Inshore Station 01 was numerically dominated by Cyanobacteriae (67%) while inshore Station 02 was dominated by Dinophyceae (59%) (Figure 7A1). However, in terms of biomass, these stations were dominated by dinoflagellates (99% and 73%, respectively) (Figure 7B1). In offshore Stations 04 and 05, Dinophyceae were the main contributors to the total phytoplankton abundance (62% and 65%, respectively) while Euglenophyceae and Bacillariophyceae dominated the phytoplankton assemblage in Stations 03 and 06 (Figure 7A1). In terms of biomass, diatoms were the main contributors to total phytoplankton biomass throughout the sampled stations (Figure 7B1), with the exception of Station 03, where Dinophyceae showed the highest relative contribution to total biomass (72%).
Spatial distribution of the diversity index of phytoplankton and ciliate communities in the different sampling stations.

Spatial distribution of the dominance index of phytoplankton with the two most abundant species.

Relative contribution of different groups to phytoplankton abundance (A1) and biomass (B1) and to ciliate abundance (A2) and biomass (B2) in the different sampling stations.

List of the main phytoplankton species found in the coastal and open sea areas of the Gulf of Hammamet during stratification (-, not detected; + 50-1000 cells l−1; *** > 1000 cells l−1).

Min (minimum), max (maximum) and mean ± SD of physico-chemical and biological parameters in the Gulf of Hammamet.

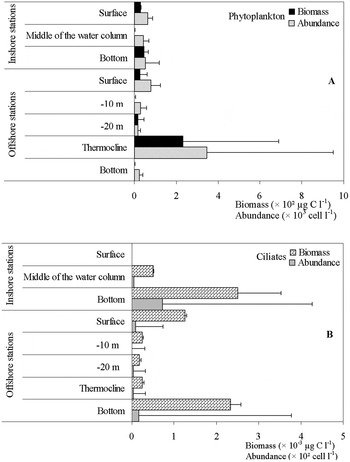
In terms of vertical distribution, phytoplankton abundance decreased from the surface (625 ± 671.75) to the bottom (525 ± 671.75) in the coastal stations (Figure 8A). Nevertheless, no significant difference was recorded between phytoplankton abundance and biomass of the surface, middle and bottom. However, the highest total phytoplankton biomass was recorded from deep water samples (46.88 ± 20.17). In the open sea stations, phytopankton abundance and biomass showed similar vertical trends decreasing from the less salty surface water (795 ± 441.92 and 26.71 ± 32.96) to the deeper salty and colder water (2.33 × 10² ± 1.75 × 10² and 0.83 ± 1.32) (Figure 8A). The highest abundance (34.63 × 10² ± 60.53 × 10²) and biomass (2.32 × 10² ± 4.58 × 10²) were recorded at the thermocline in the open sea, relatable to the bloom of diatoms (12.30 × 10³ cells l−1) at the thermocline of Station 06. We should note that Dictyocha fibula was exclusively recorded at the thermocline.
Spatial distribution of abundance and biomass (mean ± SD) of total phytoplankton (A) and ciliates (B) in the different sampling stations.

Ciliate standing stocks and horizontal and vertical variations
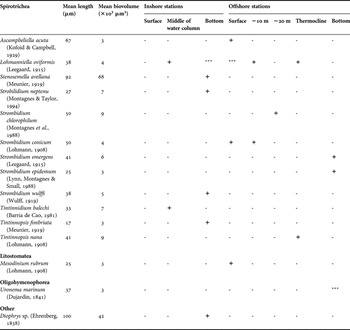
A total of 15 taxa belonging to 10 genera and 4 classes (Spirotrichea, Oligohymenophorea, Litostomatea and ‘other ciliates’) were recorded during the entire survey period (Table 2). The ciliate community was numerically dominated by Spirotrichea (69% of total abundance and 82% of total biomass) among which Choreotrichia (Tintinnida and Choreotrichida) represented 58% and 80% of total Spirotrichea abundance and biomass, respectively. Among Choreotrichia, Choreotrichida contributed to 50% and 24% of the total ciliate abundance in the coastal and open sea areas, respectively, while Tintinnida contribution reached only 25% and 10%, respectively. However, in terms of biomass, these loricate ciliates contributed to 68% of the total ciliate biomass in the open sea area and only 13% in the coastal area. They were represented by only 4 genera: Tintinnopsis, Tintinnidium, Ascampbeliella and Stenosemella. This last taxon had the largest lorica (92 µm), while Tintinnopsis fimbriata had the smallest (10 µm). Oligotrichous ciliates were largely dominated by the genus Strombidium and contributed to 32% and 19% of the Spirotrichea abundance and biomass, respectively. Oligohymenophorea and Litostomatea were found exclusively in offshore samples, representing 27% and only 2%, respectively. Spirotrichea dominated the ciliate community throughout the sampled stations, except in offshore Station 06, where Oligohymenophorea were the most abundant (60% of total abundance) (Figure 7A2) and contributed to 70% of total biomass (Figure 7B2). The protozoa community was numerically dominated by the small ciliate Lohmanniella oviformis (6 × 10² cells l−1), which accounted for 44% and 24% of total ciliate abundance in the inshore and open sea areas, respectively. Uronema marinum (5.50 × 10² cells l−1) in the open sea contributed to 37% of total ciliate abundance. The diversity of the ciliate community decreased from the coastal area (0.77 bits cell−1) to the open sea (0.19 bits cell−1) (Figure 5). No significant difference was recorded between the Shannon diversity index of the coast and the open sea areas. The maximum (2.32 bits cell−1) was recorded at the bottom of inshore Station 02, and was linked to the presence of Strombidium wulffi, Strobilidium neptenu, L. oviformis, Stenosemella avellana, T. fimbriata and Diophrys sp. The abundance of ciliate assemblages varied from 0.00 to 6.5 × 10² cells l−1 (85.41 ± 160.48) and total ciliate biomass ranged between 0.00 and 1.45 µg C l−1 during this study. The ciliate abundance recorded in offshore samples (1.02 × 10² ± 1.76 × 10²) was higher than in inshore samples (20 ± 27) (Table 3) relatable to the presence of members of Oligohymenophorea and Litostomatea in open sea samples only. The biomass showed an opposite trend, decreasing from the coastal area (0.25 ± 0.58) to the open sea (0.06 ± 0.10) (Table 3). In terms of vertical distribution, ciliate abundance and biomass showed similar vertical trends, increasing from the surface to the bottom. However, no significant difference was detected between the vertical distribution of the ciliate abundance and biomass (Figure 8B). In the inshore stations, no species were found in surface samples and the highest ciliate abundance was recorded in deep samples (250 ± 353). In the offshore stations, ciliate abundance decreased from the surface (125 ± 64) to 30 m deep (25 ± 28), but reached maximum density in bottom samples (233 ± 361), coinciding with the maximum ciliate biomass (0.15 ± 0.24). The highest abundance (6.50 × 10² cells l−1) was registered at a mean depth of 625 m at offshore station 06. The prevalence of ciliates in deep samples coincided with the lowest temperature (average 13°C) and the highest salinity (average 38 psu) recorded at the bottom. The ciliate abundance and the salinity showed a similar profile in the Station 06. In the inshore stations, the highest diversity index (2.32 bits cell−1) (J = 1) was found at the bottom of Station 02 while that of the offshore stations (1.5 bits cell−1) (J = 1) was recorded at the upper layer of Station 04.
List of the main phytoplankton species found in the coastal and open sea areas in the Gulf of Hammamet during stratification (-, not detected; + 50–1000 cells l−1; *** > 1000 cells l−1).

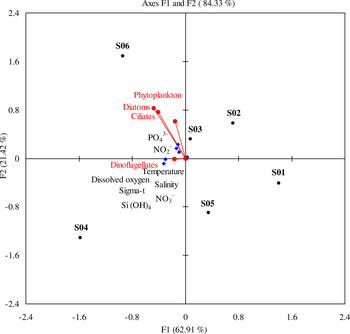
The relationship between the phytoplankton and ciliates with the environmental variables is illustrated in Figure 9. The two component axes explain 84% of total variance. The first component axis selected explained 62% of the total variability. This axis negatively selected the phytoplankton, diatoms and ciliates together with nitrite and orthophosphate. The second axis explains 21% of total variance and negatively selects dinoflagellates with temperature, salinity, sigma-t, dissolved oxygen, silicate and nitrate. Generally, diatom abundances and total phytoplankton abundance dominated in Station 06.
Canonical correspondence analysis made on the biological parameters and different environmental factors in different stations during the summer cruise.

DISCUSSION
This study is the first contribution providing information about phytoplankton and ciliate species composition and their summer spatial distribution coupled with environmental parameters in the Gulf of Hammamet.
Physico-chemical variables
The water column was well stratified with a thermocline established close to 30 m. The low orthophosphate concentration may be the result of the continuous consumption of phosphate by the growing phytoplankton communities during summer (Drira et al., Reference Drira, Bel Hassen, Hamza, Rebai, Bouaïn, Ayadi and Aleya2009). Phosphate was also reported to be a limiting element for phytoplankton growth in the western (Thingstad et al., Reference Thingstad, Zweifel and Rassoulzadegan1998; Marty et al., Reference Marty, Chiaverini, Pizay and Avril2002) and the eastern Mediterranean Sea (Krom et al., Reference Krom, Brenner, Kress and Gordon1991; Drira et al., Reference Drira, Bel Hassen, Hamza, Rebai, Bouaïn, Ayadi and Aleya2009). The N/P ratio increased from the coastal area (8.48 ± 5.00) to the open sea area (13.64 ± 16.13), contrasting with the results we found in the Gulf of Gabès with N/P higher along the coast (45.02 ± 15.29) than in the open sea (38.66 ± 9.80) (Drira et al., Reference Drira, Bel Hassen, Hamza, Rebai, Bouaïn, Ayadi and Aleya2009). In both areas, the N/P ratio was lower than the N/P Redfield ratio (<16), indicating that N was a limiting factor at times for summer phytoplankton development and contrasting with results from the Mediterranean which currently report only a phosphate depletion (Herut et al., Reference Herut, Zohary, Krom, Fauzi, Mantoura, Pitta, Psarra, Rassoulzadegan, Tanaka and Thingstad2005; Drira et al., Reference Drira, Bel Hassen, Hamza, Rebai, Bouaïn, Ayadi and Aleya2009; Hannachi et al., Reference Hannachi, Drira, Bel Hassen, Hamza, Ayadi, Bouain and Aleya2009; Siokou-Frangou et al., Reference Siokou-Frangou, Christaki, Mazzocchi, Montresor, Ribera d'Alcala, Vaque and Zingone2010). The deeper layers of the open sea area of the Gulf of Hammamet presents the higher N/P ration values which corroborate results for the Mediterranean Sea (Siokou-Frangou et al., Reference Siokou-Frangou, Christaki, Mazzocchi, Montresor, Ribera d'Alcala, Vaque and Zingone2010).
Phytoplankton community
In this study the phytoplankton community was dominated by diatoms in the offshore area of the Gulf of Hammamet leading to silicate shortage which likely resulted from consumption by growing diatoms. These observations suggest the possibility that the stability of the water column during our survey and the availability of inorganic P may be among the most important factors governing phytoplankton dynamics in the Gulf of Hammamet. This may be supported by the prevalence of large diatoms with high sinking rates (Guinardia striata, Leptocylindrus minimus, Rhizosolenia striata, R. styliformis and Thalassionema nitzshioides) especially in the thermocline and among small size phytoplankton (both diatoms and motile dinoflagellates) near the surface and in the middle of the water column (Table 2). The presence of Thalassionema nitzshioides and Rhizosolenia styliformis in the thermocline (20°C) of Station 06 conforms to their optimal growth factors determined from laboratory experiments (Resende et al., Reference Resende, Azeiteiro, Gonçalves and Pereira2007) and competitive advantage for phosphate assimilation in P-depleted waters (Reynolds, Reference Reynolds1997).
The number of taxa sharing the phytoplankton biomass increased over stratification as shown by increases in the evenness index (J = 0.86, 0.85, 0.83 and 0.90 at Stations 03, 04, 05 and 06, respectively), supporting the idea that high diversity is related to the physical heterogeneity of the water column (Aleya, Reference Aleya1991; Reynolds, Reference Reynolds1998). By contrast, increases in the evenness index in mixed Station 01 might be the result of the wide spectrum of existing conditions which are favourable for the coexistence of a high number of species. Similar findings were recently reported from the phytoplankton vertical distribution over transition from mixed to stable water conditions in the Gulf of Gabès (Bel Hassen et al., Reference Bel Hassen, Drira, Hamza, Ayadi, Akrout, Messaoudi, Issaoui, Aleya and Bouain2009). Dinoflagellates concentration declined in the bottom layer where salinity was high, except at 100 m where we unexpectedly found increases in dinoflagellates abundance. We infer that these taxa were delivered to this layer through a vein of the Modified Atlantic Water (MAW), while the deeper waters were occupied by the typically saltier Mediterranean Mixed Water in which true Mediterranean species developed. Our assumption may be supported by the results of previous studies showing that the Atlantic current in the western Mediterranean enters the Strait of Sicily and splits into two branches: one flowing to the south-eastern Mediterranean and the second flowing to the south and directly affecting circulation at the mouth of the Gulf of Gabès (Grancini & Michelato, Reference Grancini and Michelato1987). The upper layer of the sea was formed by the MAW and the bottom by salty water either in the Strait of Sicily (Sammari & Brahim, Reference Sammari and Brahim1996) or in the Gulf of Gabès (Bel Hassen et al., Reference Bel Hassen, Drira, Hamza, Ayadi, Akrout, Messaoudi, Issaoui, Aleya and Bouain2009). This southbound MAW branch may even be subjected to seasonal MAW variability (Manzella et al., Reference Manzella, Gasparini and Astraldi1988) and salinity minima are generally considered as characteristics of the MAW (Astraldi et al., Reference Astraldi, Gasparini, Vetrano and Vignudelli2002). Therefore, it seems that the prevailing hydrographic conditions were also implicated in the environmental forcing of the phytoplankton dynamics in the Gulf of Hammamet. Among the dinoflagellates recorded in this study, the heterotrophic genus Protoperidinium was the most abundant. This genus is usually coupled with warm and stratified waters (Siokou-Frangou et al., Reference Siokou-Frangou, Christaki, Mazzocchi, Montresor, Ribera d'Alcala, Vaque and Zingone2010). Although we did not conduct grazing experiments the spatial distribution of abundances of Protoperidinium spp. and diatoms suggest that Protoperidinium consumed a larger number of diatoms, especially Dactyliosolen fragillisimus for P. ovum (r = 1, P < 0.01, N = 4), in Station 04, Navicula sp. for P. pentagonum (r = 1.0, P < 0.01, N = 4), in Station 02, and Nitzschia longissima for P. steinii (r = 0.61, P < 0.01, N = 4), in Station 06. Our assumption may also be supported by the results reported from other aquatic environments where a substantial amount of the diatom biomass was preferentially cleared by members of the Protoperidinium genus (Drira et al., Reference Drira, Bel Hassen, Hamza, Rebai, Bouaïn, Ayadi and Aleya2010) as well as from laboratory experiments (Fileman et al., Reference Fileman, Smith and Harris2007). On the other hand, toxic Karenia selliformis was found in coastal bottom samples and in surface samples in open sea during this study, without detection of any deaths. This result is suspect as the presence of K. selliformis in the coastal waters of the Gulf of Gabès has been documented in this area since 1994 (Hamza & El Abed, Reference Hamza and El Abed1994; Drira et al., Reference Drira, Hamza, Bel Hassen, Ayadi, Bouaïn and Aleya2008). Moreover, Dictyocha fibula was found exclusively in the offshore of the Gulf of Hammamet. This confirms previous investigations in the Mediterranean Sea demonstrating that this silicoflagellate proliferates best at the open sea area (Siokou-Frangou et al., Reference Siokou-Frangou, Christaki, Mazzocchi, Montresor, Ribera d'Alcala, Vaque and Zingone2010).
Ciliated community
The ciliate community was numerically dominated by aloricate ciliates during this study, contrasting with the results we found in the Gulf of Gabès where loricate ciliates largely dominated the protozoa community (Hannachi et al., Reference Hannachi, Drira, Bel Hassen, Hamza, Ayadi, Bouain and Aleya2009; Kchaou et al., Reference Kchaou, Elloumi, Drira, Hamza, Ayadi, Bouain and Aleya2009). However, the tintinnids found in the Gulf of Hammamet dominated in terms of biomass in relation to their relatively high biovolume which ranged between 3 and 68 × 103 µm3 (10.66 ± 18.18 103). We should note that many authors argued that protozoa cell size could increase or decrease during preservation (Zinabu & Bott, Reference Zinabu and Bott2000), however, we minimized cell loss in our study by using Lugol iodine solution instead of a formaldehyde solution as suggested in previous studies (Aleya et al., Reference Aleya, Hartmann and Devaux1992; Karayanni et al., Reference Karayanni, Christaki, Wambeke and Dalby2004; Hannachi et al., Reference Hannachi, Drira, Bel Hassen, Hamza, Ayadi, Bouain and Aleya2009). Among the tintinnids found in this survey, Ascampbeliella acuta was found in open sea samples, probably feeding on its exclusively offshore potential preys, the small phytoflagellates Dictyocha fibula (45 µm) and chiefly Euglena gracilis (47 µm) (Table 1). Our assumption conformed to the idea that abundances of loricate ciliates are relatable in marine systems to the availability of small diatoms and phytoflagellates (Godhantaraman & Krishnamurthy, Reference Godhantaraman and Krishnamurthy1997; Drira et al., Reference Drira, Bel Hassen, Hamza, Rebai, Bouaïn, Ayadi and Aleya2010). This also conforms to the idea that tintinnid diversity was most likely linked to food resources (Dolan et al., Reference Dolan, Claustre, Carlotti, Plounevez and Moutin2002, Reference Dolan, Lemée, Gasparini, Mousseau and Heyndrick2006). Overall, either tintinnid diversity or total ciliate diversity recorded in the Gulf of Hammamet were lower than those reported in the Gulf of Gabès (Hannachi et al., Reference Hannachi, Drira, Bel Hassen, Hamza, Ayadi, Bouain and Aleya2009), and most likely in relation to food availability (Drira et al., Reference Drira, Bel Hassen, Hamza, Rebai, Bouaïn, Ayadi and Aleya2010). As previously mentioned, the protozoa community was numerically dominated by two mixotrophic naked ciliates L. oviformis (38 µm) and U. marinum (37 µm) (Table 3), which are both smaller than their counterparts recorded in other marine studies (60 µm) (Turley et al., Reference Turley, Newell and Robins1986; James & Hall, Reference James and Hall1995). According to these authors and others (Aleya et al., Reference Aleya, Hartmann and Devaux1992), the ciliate volume is relatable to population density, decreasing when the population density reaches maximum, as we observed for both L. oviformis and U. marinum which flourished in this survey. We previously reported on U. marinum which was able to thrive not only in both the offshore of the Gulf of Gabès (38 µm, salinity 38 psu; Hannachi et al., Reference Hannachi, Drira, Bel Hassen, Hamza, Ayadi, Bouain and Aleya2009) and along its coast in a nearshore salty station (25 µm, salinity 48 psu; Kchaou et al., Reference Kchaou, Elloumi, Drira, Hamza, Ayadi, Bouain and Aleya2009) but also in the man-made Sfax solar salterns (25 µm, salinity 150–300 psu; Elloumi et al., Reference Elloumi, Carrias, Ayadi, Sime-Ngando, Boukhris and Bouain2006, Reference Elloumi, Guermazi, Ayadi, Bouaïn and Aleya2009). The adaptation of small Uronema to a large range of salinity may be linked to its opportunistic strategy and the availability of nanoplankton prey. On the other hand, it is known that choreotrichs, to which L. oviformis belongs, have an optimum prey size approximately equal to 15% of their length (Kivi & Setala, Reference Kivi and Setala1995; Johansson et al., Reference Johansson, Gorokhirra and Larsson2004). In this study, choreotrichous species were small in length and were most likely feeding on nanoplankton prey (<20 µm). However, the size of the phytoplankton during this stratified period always exceeded 20 µm (Table 1). Accordingly, it appears that these ciliates were unable to feed on colonial diatoms and large dinoflagellates. We propose that these small ciliates were consuming bacteria and nanoalgae prey. First, our assumption may be supported by the absence of relationships between phytoplankton and ciliates, indicating the importance of particles other than large phytoplankton during water stratification in the Gulf of Hammamet. Second, it is well known that the ciliates such as those found in this survey, in addition to being potential bacterivores of the plankton, are able to feed on nanoalgae (Simek et al., 1994). Finally, in a recent study conducted on phytoplankton dynamics in the Gulf of Gabès, we showed through the distribution of taxonomic pigments (Bel Hassen et al., Reference Bel Hassen, Drira, Hamza, Ayadi, Akrout, Messaoudi, Issaoui, Aleya and Bouain2009) that pico- and nanoplankton communities were the main contributors to microplankton biomass, accounting for 87% of total chlorophyll-a over stratification, supporting the idea that in aquatic systems, the hydrological regime toward well-stratified water induces variations in the phytoplankton size-structure (Reynolds, Reference Reynolds1997; Stemmann et al., Reference Stemmann, Gorsky, Marty, Picheral and Miquel2002; Allen et al., Reference Allen, Siddorn, Blackford and Gilbert2004). It therefore appears that in the present study, the density of nanoplanktonic microorganisms was undoubtedly underestimated by the inverted microscopy technique as classically reported in other studies (Aleya et al., Reference Aleya, Devaux, El Magouri, Marvalin and Amblard1988; Wright & Jeffrey, Reference Wright, Jeffrey and Volkman2006).
CONCLUSION
This study showed first results on the species composition and spatial distribution of abundances and biomass of the phytoplankton and ciliate communities in the under-sampled Gulf of Hammamet. This could be useful for optimizing sampling designs in future studies at the entrance to the Strait of Sicily within the framework of SESAME (Southern European Seas Assessing and Modelling Ecosystem changes). Apparently, the small planktonic ciliates found in the Gulf of Hammamet are an important component of the food web and seem to be potential major predators of nanoplankton, favouring the microbial loop as currently reported in oligotrophic ecosystems. Our experiments in progress on plankton-pigment signatures from samples collected in this gulf (Hannachi et al., unpublished) would confirm these results.
ACKNOWLEDGEMENTS
This study was conducted by Imen Hannachi in the framework of her PhD thesis (University of Franche-Comte, CNRS 6249, France-University of Sfax, Tunisia). This work was supported by two projects: POEMM (LR02INSTM04) and SESAME (Southern European Seas Assessing and Modelling Ecosystem changes). The authors also extend their thanks to the crew of the RV ‘Hannibal’ and Captain A. Guezdawi.