Life Cycle Assessment (LCA) is a powerful method that allows simultaneous assessment of several environmental impacts associated with a product, from energy use to global warming; in its broadest meaning, it incorporates into the analysis all processes involved in product manufacturing, from raw material extraction to possible waste treatments (de Boer, Reference de Boer2003). The application of LCA method is time-consuming, implies the use of a number of not directly measured data and requires some assumptions that give inherent uncertainty to inter-comparisons (Yan et al. Reference Yan, Humphreys and Holden2011).
The agriculture and livestock sectors are important contributors to global emissions of greenhouse gases (GHG), in particular methane (CH4) and nitrous oxide (N2O). Global GHG emissions from the agricultural sector are estimated as 10–12% of total emissions (Kristensen et al. Reference Kristensen, Mogensen, Knudsen and Hermansen2011); milk production contributes 2·8% of total global anthropogenic emissions, 95% of which is related to primary production (Opio et al. Reference Opio, Gerber and Steinfeld2011). Global warming impact of ruminant livestock farms is particularly high due to CH4 emissions from enteric fermentation and manure storage and handling, and due to the intensive nitrogen (N) cycle leading to direct and indirect N2O emissions (Olesen et al. Reference Olesen, Schelde, Weiske, Weisbjerg, Asman and Djurhuus2006). According to Casey & Holden (Reference Casey and Holden2005) enteric fermentation and manure management are responsible for 60% of global warming potential related to milk production.
Agriculture contributes considerably to the release of N compounds to the atmosphere, as NH3, NOx and N2O. Especially for ammonia, agriculture and animal husbandry are by far the main sources. N volatilisations occurs during and after production, storage and application of organic (slurry and manure) and mineral fertilisers (Brentrup et al. Reference Brentrup, Küsters, Lammel and Kuhlmann2000). N emissions cause acid deposition and intensive acidification of water and soil; a study on German dairy farms showed that acidification impact is almost exclusively caused by ammonia emission from cattle keeping (Haas et al. Reference Haas, Wetterich and Köpke2001).
Eutrophication is an indicator of nutrient enrichment in surface water (van Calker et al. Reference van Calker, Berentsen, de Boer, Giesen and Huirne2004), that is considered the direct cause of the increased plant and microbial growth with consequent consumption of the oxygen dissolved in the water. Contribution of on-farm activities to eutrophication derives mainly from nitrate leaching, phosphate run-off and ammonia volatilisation; in particular ammonia emissions occur during application of fertilisers in the production of on-farm feeds and from manure excreted in the stable, during storage and grazing. In conventional dairy farming systems on-farm feed production contributed 90% and animals contributed 9% to on-farm eutrophication potential. Off-farm eutrophication derived mainly from nitrate leaching, phosphate run-off and ammonia volatilised during application of fertilisers in the production of purchased concentrates and roughages (Thomassen et al. Reference Thomassen, van Calker, Smits, Iepema and de Boer2008).
Use of natural resources as land, fossil fuels and water represents an important environmental impact category in LCA studies (de Boer, Reference de Boer2003). Land use includes both the area needed for fodder production on the farm and the one needed for cultivation of purchased fodder (Müller-Lindenlauf et al. Reference Müller-Lindenlauf, Deittert and Köpke2010). Land use is generally higher in organic dairy farms than in the conventional ones, due to decreased crop yields per ha (Thomassen et al. Reference Thomassen, van Calker, Smits, Iepema and de Boer2008; Kristensen et al. Reference Kristensen, Mogensen, Knudsen and Hermansen2011). Combustion of fossil fuels gives an important contribution to CO2 emission in the atmosphere from livestock farms. Fossil fuels are primarily used in cultivation of feed, both on-farm and outside the farm, for manure application, transport of animals, processing and transport of feed. Electricity is mainly used in dairy farm for milking and milk cooling (Flysjö et al. Reference Flysjö, Henriksson, Cederberg, Ledgard and Englund2011).
In Northern Italy favourable climate and infrastructural conditions determined during the last decades a significant concentration of livestock farms with intensive utilisation of natural resources (i.e. land, air and water). The Po valley represents altogether only 18% of the utilised agricultural area of the country, but accounts for 49% of Italian cattle population, 62% of pigs and 63% of poultry. The high intensity of land use in animal production farms combined with the high soil vulnerability created nitrogen pollution problems in ground and surface water (de Roest, Reference De Roest2000). Many research studies have been conducted in Italy to identify strategies aimed at reducing nitrogen water pollution (Xiccato et al. Reference Xiccato, Schiavon, Gallo, Bailoni and Bittante2005; Penati et al. Reference Penati, Berentsen, Tamburini, Sandrucci and de Boer2011), however, only a very limited number of studies considered the integral environmental performances of Italian dairy farming on a global scale and in a cradle-to-farm-gate perspective (Penati et al. Reference Penati, Sandrucci, Tamburini and de Boer2010; Fantin et al. Reference Fantin, Buttol, Pergreffi and Masoni2011).
The purpose of this study was to evaluate, with LCA methodology, the environmental impact of milk production in a sample of intensive Italian dairy farms located in the Po valley and to identify, among different farming strategies, those associated with the best environmental performances.
Materials and methods
Life Cycle Assessment
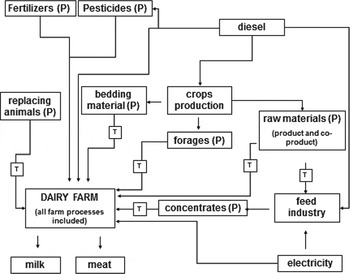
The study analysed a group of 41 intensive dairy farms located in the Po valley (Lombardy, Italy), all members of the same cooperative industry which produces cattle feed for the farmers. For each farm a detailed ‘cradle-to-farm-gate’ LCA was performed. The system boundaries included all the processes related to on-farm activities (i.e. forage and crop production, manure and livestock management) and to all external inputs from off-farm processes (i.e. production of fertilisers, pesticides, forages and raw feed materials, compound feeds, energy and fuels, litter materials and replacing animals) (Fig. 1). Transportation of the inputs was also included (Thomassen et al. Reference Thomassen, van Calker, Smits, Iepema and de Boer2008). The amounts of external inputs and the amounts of on-farm products (forages, grains, milk, meat) were specific for each farm. All the data are referred to year 2009.
System boundaries from cradle to farm gate: all the processes related to dairy farm activities and all the processes related to production and transportation of purchased inputs are included. T: transportation P: purchased.

The functional unit (FU), i.e. the reference unit to which all the environmental impacts were related, was 1 kg fat and protein corrected milk (FPCM, 4·0% of fat and 3·3% of protein content) leaving the farm gate. The allocation of environmental impact of all co-products entering the farm gate as input was based on economic value. An economic allocation was also applied for milk and meat (mainly bull calves and cull cows) produced in the farms. The prices for milk and meat were specific for each farm. All the farms in the study were highly specialised in milk production: the average percentage of economic allocation between milk and meat was 94·2 and 5·8%, respectively. Other products sold by the farms (e.g. fodder, grains or manure) were not taken into account, as they were almost completely reused in the farm.
Environmental impact categories considered in this analysis were: land use (m2); non-renewable energy use (MJ eq.); climate change (kg CO2 eq. 100-year horizon); acidification (g SO2 eq.); eutrophication ( ${\rm g}\;{\rm PO}_{\rm 4}^{{\rm 3} -} {\rm eq}.$).
Data sources
Personal interviews with the farmers were performed to collect detailed information about farm management: crop production for cattle feeding, livestock and manure management, purchased inputs (feed, fertilisers, pesticides, electricity and fossil fuels). Moreover, the farmers communicated the total amount of milk and the number of animals sold per year. The total amount of meat sold (both surplus male calves and other animals for slaughter) was estimated considering the standard live weight of each category of animals (DEFRA, 2010).
Emissions to the atmosphere and the soil at farm level were estimated including emissions generated by enteric fermentation of livestock, manure handling and storage, application of manure and artificial fertilisers to the soils and combustion of fossil fuels. Methane (CH4) emissions from enteric fermentations were predicted on the basis of dry matter intake using the equation proposed by Ellis et al. (Reference Ellis, Kebreab, Odongo, McBride, Okine and France2007). Methane emissions and direct emission of nitrous oxide (N2O) from manure storages were estimated according to IPCC (2006a). Indirect emissions of N2O resulting from volatile nitrogen losses, that occur mainly in the forms of NH3 and NOx, were considered negligible (Castanheira et al. Reference Castanheira, Dias, Arroja and Amaro2010). According to Castanheira et al. (Reference Castanheira, Dias, Arroja and Amaro2010) and Zehetmeier et al. (Reference Zehetmeier, Baudracco, Hoffmann and Heißenhuber2012), nitrogen volatilisation from barns and manure storages was considered to be in the form of ammonia (NH3). Application of manure and artificial fertilisers on soils for feed production generates emissions to the atmosphere of nitrogen as ammonia (NH3) and nitrous oxide (N2O) and emissions to ground water of nitrates (NO3) and phosphate ( ${\rm PO}_{\rm 4}^{{\rm 3} -} $). NH3 emissions of fertilisers were calculated using the emission factor (0·084 kg NH3/kg N applied) proposed by EEA (2009). N2O losses from application of fertilisers were estimated according to IPCC (2006b). Nitrogen leaching and runoff as NO3 was calculated for all crops (excluding lucerne, grassland and sugarbeet) using a factor of 0·3 kg N/kg N applied (IPCC, 2006b). For lucerne, grassland and sugarbeet produced in Italy nitrogen leaching was predicted using the following factors: 0·087, 0·015 and 0·13 kg N leached per kg N input, respectively (Penati, Reference Penati2009). Phosphate losses were estimated from the amount of phosphorus lost in dissolved form into surface water (run-off) and leached, as proposed by Nemecek & Kägi (Reference Nemecek and Kägi2007), and converted in
 ${\rm PO}_{\rm 4}^{{\rm 3} -} $. Emissions from fuel combustion were estimated on the basis of fuel consumption of each farm including fuel used in crop operations (i.e. ploughing, harrowing, fertilising, chopping), using the emission factors suggested by Nemecek & Kägi (Reference Nemecek and Kägi2007).
The cooperative feed factory provided all the data concerning compound feed production: precise composition of compound feeds, origin of raw materials and distances covered by road and overseas transportation. The average energy consumption for processing 1 tonne of feed (about 12% water content) at the factory gate was considered equal to 53·5 kWh and 140 MJ from heat according to Nielsen (Reference Nielsen2003).
Some farms in the sample bought replacement animals from other dairy farms, mainly from Italy and Northern Germany; two different simplified Life Cycle Assessments were performed for rearing heifers (0–24 months) in Italian and German farms. Emissions from digestion, housing, feed production and animal transport were considered.
Data related to off-farm crop production, chemical fertilisers, pesticides, energy and fuel production were derived from Ecoinvent database (2007).
Life Cycle Assessment was carried out with the assistance of a commercial LCA software package, SimaPro 7.3.2 PhD (PRé Consultants, 2011).
Statistical analysis
Statistical analysis was performed using SAS 9.1 software (SAS, 2001). Five different factors were identified using PROC FACTOR analysis (SAS, 2001). According to Kristensen et al. (Reference Kristensen, Mogensen, Knudsen and Hermansen2011) for each factor pattern the variables that had the highest loading values (⩾0·58 in absolute value) were used to identify the farming strategy corresponding to each factor. A GLM (SAS, 2001) analysis was performed to evaluate the effect of farming strategies on impact categories of LCA. The percentage of variation for impact categories explained by each factor was calculated as the ratio between mean square and the sum of squares of the model. The 41 dairy farms in the sample were classified using a distribution analysis (quantiles) (SAS, 2001) on the basis of the values of estimated factor scores (computed as a linear combination of the standardised values of the variables that are factored) for each factor pattern. A GLM analysis was performed taking into account the upper quartile (the 75th percentile) and the lower quartile (the 25th percentile) of the estimated factor scores.
Results and discussion
The farms had characteristics of high intensity both in terms of cropping systems and animal production. They had on average 140±81 adult cows and 45·4 ha of farm land. Average stocking density, expressed as Livestock Units (LU) per hectare (DEFRA, 2010), was high (5·45±2·69) and milk production per cow was on average 10·3±1·2 t FPCM per year. As a consequence, production intensity, expressed as t FPCM per hectare, was very high (30·8±15·1) compared with the results from other European studies: 13·1 t/ha and 14·4 t/ha in two recent Italian studies (Penati et al. Reference Penati, Sandrucci, Tamburini and de Boer2010; Fantin et al. Reference Fantin, Buttol, Pergreffi and Masoni2011); 10·6 t/ha in a Dutch analysis (Thomassen et al. Reference Thomassen, van Calker, Smits, Iepema and de Boer2008). Maize was grown both for silage and for grain in all the farms and occupied, on average, 25·1 and 6·9% of farm land, respectively. On average, 51·3±5·21% of the total dry matter (DM) of cow rations consisted of forages, with 32·9±6·68% of maize silage. Feed self-sufficiency of the farms, was generally low: 58·6±15·7% of total DM consumed. Dairy efficiency was 1·3±0·14 kg FPCM per kg DM intake, whereas efficiency of nitrogen utilisation for milk production as percentage of nitrogen ingested was 27·3%.
Climate change
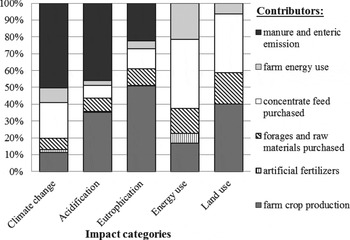
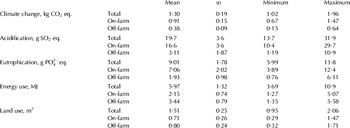
Total GHG emission for milk production at the farm gate was 1·30±0·19 kg CO2 eq. per kg FPCM (Table 1). Most of greenhouse gases were produced on-farm (77%). The average global warming potential per kg of milk was the same as reported by Haas et al. (Reference Haas, Wetterich and Köpke2001) for intensive dairy farms in Germany and by Fantin et al. (Reference Fantin, Buttol, Pergreffi and Masoni2011) for the farm phase of dairy chain in Italy. Moreover it was very similar to the results obtained by authors from other European countries (Casey & Holden, Reference Casey and Holden2005; Thomassen et al. Reference Thomassen, van Calker, Smits, Iepema and de Boer2008; Kristensen et al. Reference Kristensen, Mogensen, Knudsen and Hermansen2011). The main components of climate change impact (Fig. 2) were: emissions from barns, manure storage and handling (50·1%) and emissions for production and transportation of purchased concentrate feeds (21·2%). The contribution to the climate change potential of the three greenhouse gases considered was on average 59·0% for CH4, 35·6% for CO2 and 19·7% for N2O.
Percentage contribution of inputs and activities on impact categories. Manure and enteric emission includes manure management and enteric emission of the animals. Farm crop production includes all inputs and activities for on-farm crop production including manure spreading.

Average environmental impacts from the production of 1 kg of Fat Protein Corrected Milk at farm gate in 41 Italian dairy farms. Each impact is presented as total impact, impact from on-farm activities and impact from off-farm activities (production and transportation of inputs)

Acidification
Average emission of gases causing acidification (expressed as SO2 equivalents) to produce 1 kg FPCM was 19·7±3·6 g. This result was mainly due to on-farm gas production (84·3%). In particular the main contributors were emissions from barns and manure storage and handling (45·9%) and emissions for feed production on-farm (35·2%), as shown in Fig. 2. Acidification potential was mainly due to ammonia emission in the air (90·4±1·74%). The average emission of acidifying gases was similar to the results reported by Castanheira et al. (Reference Castanheira, Dias, Arroja and Amaro2010) and by Cederberg & Mattsson (Reference Cederberg and Mattsson2000). Fantin et al. (Reference Fantin, Buttol, Pergreffi and Masoni2011) estimated a contribution of the farm phase in Italian dairy chain to acidification potential of nearly 20 g SO2 eq. per kg milk. In contrast, Thomassen et al. (Reference Thomassen, van Calker, Smits, Iepema and de Boer2008) reported much lower acidification potential both in conventional and in organic dairy farms.
Eutrophication
The production of 1 kg FPCM caused the loss of 9·01±1·78 g on average of phosphate equivalents. Fantin et al. (Reference Fantin, Buttol, Pergreffi and Masoni2011) reported that the farm operation phase contributes to eutrophication with 7·8 g  ${\rm PO}_{\rm 4}^{{\rm 3} -} {\rm eq}.$ per kg milk. Eutrophication resulted mainly from on-farm activities (78%). In particular, as shown in Fig. 2, it was mainly due to the application to the soils of artificial fertilisers and manure for feed production at the farm (50·7%), followed by ammonia emission from barns and during manure storage and handling (22·4%). According to this, the main contribution to eutrophication was given by nitrate leaching (43·8±5·63%) in the water and ammonia emission (43·7±4·23%) to the air. The balance of nitrogen at farm level, as a difference between input and output, identified an average surplus of 539±256 kg N/ha.
Energy use
Farms from this study needed on average 5·97±1·32 MJ from non-renewable energy sources to produce 1 kg FPCM. Energy consumption was mainly due to off-farm activities (58%). Main components of energy use impact (Fig. 2) were: production and transportation of concentrate feeds purchased off-farm (38·9%), energy use on-farm (20·5%) and feed production on-farm (16%). Energy use on-farm was mainly related to milking, milk cooling, manure handling, feed mixing and distributing. Non-renewable energy use was similar to the results reported by Thomassen et al. (Reference Thomassen, van Calker, Smits, Iepema and de Boer2008) for conventional dairy farms. In a German study, Haas et al. (Reference Haas, Wetterich and Köpke2001) obtained lower energy consumptions both in intensive and in extensive dairy farms.
Land use
Sample farms occupied 1·51 m2 of land to produce 1 kg FPCM, on average. Land use was quite equally split between on-farm and off-farm activities. Land use impact components (Fig. 2) were: land use for feed production at the farm (40·0%), land use for production of purchased feeds (34·9% concentrate and 18·8% forages) and land use for energy production off-farm (6·4%).
Land use was between the values reported by Thomassen et al. (Reference Thomassen, van Calker, Smits, Iepema and de Boer2008) for conventional and organic Dutch dairy farms.
Definition of farming strategies
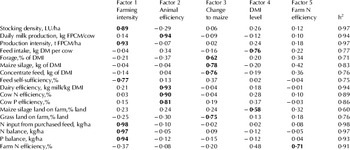
The results of the factor analysis are shown in Table 2. The model clearly separated the variation into factors: all the variables kept in the model with a loading value higher than 0·58 (in absolute value) appeared in only one of the factors. For each factor, separately, the variable correlations (bold values) were used to label the farming strategy. The first factor was defined as ‘Farming intensity’; it was characterised by highly positive loading values in terms of stocking density (LU/ha), production intensity (t FPCM/ha) and input of nitrogen from purchased feeds (kg/ha). Moreover, this factor had highly positive values for both nitrogen and phosphorus balances (kg/ha), but a negative value for the percentage of feed self-sufficiency. The second factor was named ‘Animal efficiency’ because it was characterised by highly positive values for daily milk production (kg FPCM/cow) and dairy efficiency (kg FPCM/kg DMI); nitrogen and phosphorus efficiencies at animal level (%) were also positive. The third factor was identified as ‘Change to maize’; the highest eigenvalue was for the amount of maize silage in cow ration (kg of DMI); the percentage of forage on DMI was also positive, whereas grass land on-farm (% land) and concentrate feeds (kg of DMI) were characterised by highly negative values. Factor 4 was defined as ‘DMI level’; it showed highly negative value for feed intake (kg DMI/cow); this factor had also a negative value for maize silage land on-farm (% land). The last farming strategy was defined as ‘Farm nitrogen efficiency’; it was only related with efficiency of nitrogen utilisation at farm level (expressed as percentage of N output/N input).
Results of the factor analysis: loading values of the variables and communalities (h2). In bold loading values ⩾0·58 (as absolute value)

Farming strategy effect on impact categories
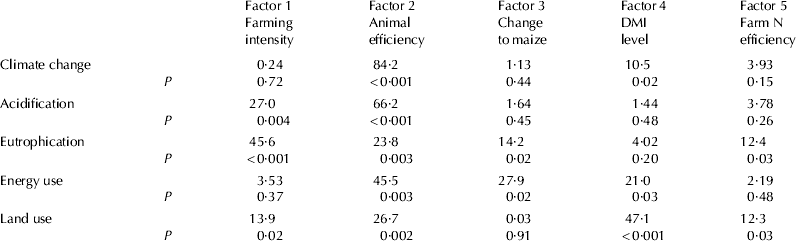
The percentage of variation explained by each farming strategy (factor) for each impact category is shown in Table 3. The ‘Farming intensity’ strategy significantly contributed to eutrophication, acidification and land use. ‘Animal efficiency’ significantly influenced all impact categories; in particular its load on climate change variation was very high: 84·2% (P<0·001). All farming strategies, with the exception of ‘DMI level’, had an important impact on eutrophication. The most significant contribution to non-renewable energy use came from the ‘Animal efficiency’ strategy. The highest impact on land use was associated with the ‘DMI level’ factor.
Percentage of variance for each impact category explained by each farming strategy
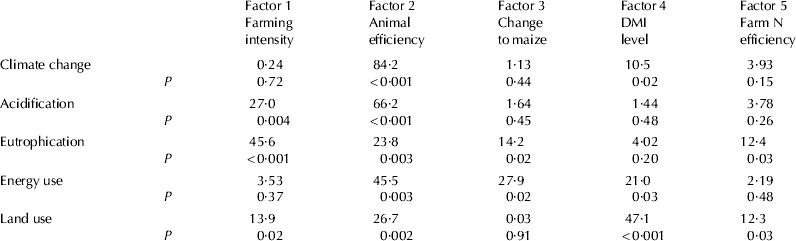
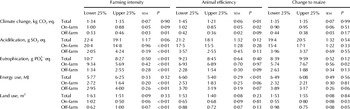
Table 4 shows the effects of the first three farming strategies (factors 1, 2 and 3) on each impact category per kg FPCM, comparing the upper and lower quartiles.
Effect of farming strategies on impact categories from the production of 1 kg of FPCM: comparison between upper 25% and lower 25% of estimated factor scores

‘Farming intensity’ did not influence climate change potential per kg FPCM very much and there was no difference between the upper and the lower quartiles for GHG production. However, climate change potential off-farm was significantly higher (P<0·05) for the top class of ‘Farming intensity’ in comparison with the bottom one. The relation between farming intensity and off-farm climate change was also identified by Penati (Reference Penati2009). The upper class of ‘Farming intensity’ had significantly higher stocking density (8·62 LU/ha) than the bottom class (3·46 LU/ha; P<0·001) and lower level of feed self-sufficiency (42·3 vs. 75·6%; P<0·001). As a result of growing use of purchased feed, global warming potential off-farm increased with farming intensity. For the same reason off-farm fractions of acidification, eutrophication, energy use and land use were significantly higher in the upper class characterised by high farming intensification and low feed self-sufficiency. As previously shown, the loading value of feed self-sufficiency was highly negative in factor analysis for the strategy ‘Farming intensity’ (−0·77). Penati (Reference Penati2009) found a similar relation between feed self-sufficiency and off-farm fraction of acidification, eutrophication and land use. Comparable results for energy use and acidification were found by Thomassen et al. (Reference Thomassen, van Calker, Smits, Iepema and de Boer2008), who examined conventional and organic farms. Reduced on-farm land use in the intensive farms was also found by Müller-Lindenlauf et al. (Reference Müller-Lindenlauf, Deittert and Köpke2010), who compared low and high input farms.
The strategy ‘Farming intensity’ highly influenced eutrophication and acidification potentials and a significant difference was registered in terms of eutrophication per kg of FPCM between the upper and the lower class of intensification: the more intensified farms had always better performances than the less intensified ones. However, considering the eutrophication risks from a local perspective, the results were completely different: nitrogen balance per hectare was significantly higher in the upper class of intensification than in the lower one (854 vs. 299 kg N/ha per year; P<0·001). The environmental advantage of livestock production intensification should be assessed considering also soil vulnerability and other local factors such as biodiversity richness and environmental value.
The largest difference in terms of climate change was between the top and the bottom groups identified by the strategy ‘Animal efficiency’; GHG production as CO2 eq. per kg FPCM was 17% lower in the upper class than in the lower one. The upper class had significantly higher milk yield per cow (11 429 vs. 8846 kg FPCM; P<0·001) and dairy efficiency (1·45 vs. 1·15 kg FPCM/kg DMI; P<0·001) than the lower class. As production efficiency (units of milk produced per unit of input) increased, climate change impact decreased, as found by Capper et al. (Reference Capper, Cady and Bauman2009). Kristensen et al. (Reference Kristensen, Mogensen, Knudsen and Hermansen2011) reported that lower emissions of GHG in efficient farms are mainly due to higher conversion of feed to milk which reduced the CH4 emission, and, to some extent, to the higher milk yield per cow. A difference of 8% of CO2 eq. per kg milk was found by Rotz et al. (Reference Rotz, Montes and Chianese2010) in a simulated comparison among farms with different milk production levels. The negative relation between climate change potential and milk production level was also highlighted by Penati (Reference Penati2009). Animal efficiency, expressed as feed conversion efficiency, is increased by the use of fewer animals with high genetic value and high milk production. This effect is based on dilution of maintenance energy requirements, where fewer efficient animals are required to produce the same FPCM/unit land area. Thus CH4 emitted and urinary N excreted/unit product are lower (Beukes et al. Reference Beukes, Gregorini and Romera2011). Johnson & Johnson (Reference Johnson and Johnson1995) reported that high producing cows usually receive low fibre rations reducing their methane emission per kg milk. Diets rich in starch that favour propionate production decrease CH4 production per unit of fermentable organic matter in the rumen. Conversely, roughage based diets favour acetate production and increase CH4 production per unit of fermentable organic matter.
The farming strategy based on enhanced animal efficiency showed significantly better performances also in terms of non-renewable energy use per kg FPCM. Farming systems characterised by high dairy efficiency and nitrogen conversion efficiency at animal level needed and bought less feed for each milk unit produced. As, from our data, purchased feeds (concentrates and forages) loaded for more than 50% on energy use impact, the better feed conversion saves energy.
The upper class of the farming strategy defined as ‘Change to maize’ produced significantly higher eutrophication on-farm than the other; nitrogen from artificial fertilisers was significantly different between classes (82·8 vs. 137·3 kg/ha, for the lower and upper class; P<0·05). On-farm crop production loaded for 50·8% on eutrophication.
The two classes of the strategy ‘Change to maize’ were significantly different in terms of feed self-sufficiency (47·6 vs. 64·4, for the lower and upper class; P=0·01); this can explain the difference found for land use on-farm, that was higher in the upper class of this farming strategy.
The lower class of the ‘DMI level’ strategy had lower energy use and land occupation than the upper class. Dairy efficiency, expressed as kg milk/kg DMI, and nitrogen animal efficiency were higher in the bottom class than in the upper (1·35 vs. 1·25, P<0·10; 28·0 vs. 26·0%, P<0·09 respectively). The animals of the bottom class of ‘DMI level’ produced the same amount of milk (10·18 vs. 10·24 t FPCM/cow; P=0·90) with lower level of DMI (20·7 vs. 22·5 kg DM/cow day; P<0·001).
The farming strategy identified as ‘Farm nitrogen efficiency’, did not show any difference in terms of impact categories; in this case nitrogen efficiency seems to derive mainly from management choices than from animal efficiency.
Conclusions
The study analysed the environmental impact of milk production, in a cradle-to-farm-gate perspective, in one of the most intensified district of Italian dairy farming.
Average results in terms of climate change, acidification, eutrophication and land use per kg of milk were similar to those obtained by authors from other European countries, even if milk production intensity (t/ha) of the farms analysed in the study was higher than in the other studies. Non- renewable energy consumption per kg of milk was quite high, in particular the off-farm fraction. Significant variations were found among different farming strategies in terms of environmental impacts. In particular farming strategies based on high production intensity and high animal efficiency were better able to mitigate environmental impacts per kg milk at farm gate. Increasing production intensity of the farm by increasing stocking density seems to have some advantages on a global scale in terms of acidification and eutrophication potentials per kg of milk produced and did not affect the other impact categories per kg of milk. However, on a local scale the risk of eutrophication associated with this strategy notably increases due to very high nitrogen balance. Another weakness of the intensification strategy is represented by high off-farm fractions of impact categories associated with the high inputs of purchased feeds. As a consequence, the farmer's control of a large part of environmental costs of the process is strongly reduced: environmental impacts of purchased feeds depend on how and where they are produced and they may significantly vary over time. The strategy based on enhanced production efficiency at animal level seems to produce the best results: it allows reduction of GHG production and non-renewable energy use per kg of milk produced. Moreover it does not have negative impact on a local scale in terms of nitrogen balance. High efficiency of feed conversion is mainly associated with balanced and precise feeding and selection of high producing cows. But very high milk yield may have some detrimental effects in terms of animal health, welfare and profitability that cannot be ignored.
The authors thank COMAZOO, in the person of Dr Sonia Rumi, and the farmers who took part in the research for their collaboration and for data providing.